(8th edition) (the pearson series in economics) robert pindyck, daniel rubinfeld microecon 116
Bạn đang xem bản rút gọn của tài liệu. Xem và tải ngay bản đầy đủ của tài liệu tại đây (124.88 KB, 1 trang )
CHAPTER 3 • Consumer Behavior 91
car, or additional medical care that might extend
your life by a year? Many would choose the extra
health care.
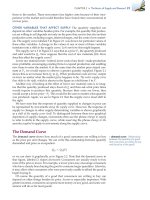
The preferences for health care are illustrated in
Figure 3.16, which shows a series of indifference
curves and budget lines that characterize the tradeoff between consumption of health care (H) versus
other goods (O). Indifference curve U1 applies to a
consumer with low income; the consumer’s budget
line is tangent at point A, so that the consumption
of health care and consumption of other goods that
maximize the consumer’s satisfaction are H1 and
O1. Indifference curve U2 yields a greater amount
of satisfaction, but is only feasible for a consumer
with higher income. In this case utility is maximized
at point B. Curve U3 applies to a high-income
consumer, and implies less willingness to give up
health care for other goods. Moving from point B to
point C, the consumer’s consumption of health care
increases considerably (from H2 to H3), while her
consumption of other goods increases only modestly (from O2 to O3).
Does Figure 3.16 correctly characterize the
preferences of consumers? At least one recent
statistical study indicates that it does. 10 So does
common sense. If your income were high enough
so that you could have most of the things you
wanted, would you prefer to spend additional
income on life-extending health care or on
another car?
F IGURE 3.16
CONSUMER PREFERENCES
FOR HEALTH CARE VERSUS
OTHER GOODS
Health
Care
C
H3
B
H2
H1
U3
A
U2
U1
O1
10
O2
O3
Other
Goods
These indifference curves show the
trade-off between consumption of
health care (H) versus other goods
(O). Curve U1 applies to a consumer
with low income; given the consumer’s
budget constraint, satisfaction is maximized at point A. As income increases
the budget line shifts to the right, and
curve U2 becomes feasible. The consumer moves to point B, with greater
consumption of both health care and
other goods. Curve U3 applies to a
high-income consumer, and implies
less willingness to give up health care
for other goods. Moving from point B
to point C, the consumer’s consumption of health care increases considerably (from H2 to H3), while her consumption of other goods increases
only modestly (from O2 to O3).
See the interesting article by Robert E. Hall and Charles I. Jones, “The Value of Life and the Rise in
Health Spending,” Quarterly Journal of Economics, February 2007, pp. 39–72. The authors explain that
the optimal composition of total spending shifts toward health as income increases. They predict
that the optimal heath share of spending is likely to exceed 30 percent by 2050.