(8th edition) (the pearson series in economics) robert pindyck, daniel rubinfeld microecon 271
Bạn đang xem bản rút gọn của tài liệu. Xem và tải ngay bản đầy đủ của tài liệu tại đây (100.62 KB, 1 trang )
246 PART 2 • Producers, Consumers, and Competitive Markets
Capital
per
year
K2
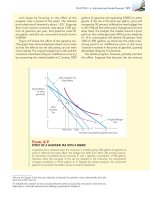
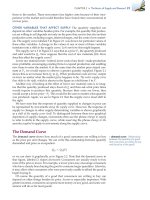
F IGURE 7.3
PRODUCING A GIVEN OUTPUT
AT MINIMUM COST
Isocost curves describe the combination of inputs to production that cost the same amount
to the firm. Isocost curve C1 is tangent to isoquant q1 at A and shows that output q1 can be
produced at minimum cost with labor input
L1 and capital input K1. Other input combinations—L2, K2 and L3, K3—yield the same output
but at higher cost.
A
K1
K3
q1
C0
L2
C1
L1
C2
L3
Labor per year
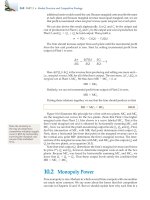
magnitude and the isocost line would become steeper. Figure 7.4 shows this.
Initially, the isocost line is C1, and the firm minimizes its costs of producing output q1 at A by using L1 units of labor and K1 units of capital. When the price of
labor increases, the isocost line becomes steeper. The isocost line C2 reflects the
higher price of labor. Facing this higher price of labor, the firm minimizes its cost
of producing output q1 by producing at B, using L2 units of labor and K2 units
Capital
per
year
F IGURE 7.4
INPUT SUBSTITUTION WHEN AN INPUT
PRICE CHANGES
Facing an isocost curve C1, the firm produces output q1 at point A using L1 units of labor and K1
units of capital. When the price of labor increases,
the isocost curves become steeper. Output q1 is
now produced at point B on isocost curve C2 by
using L2 units of labor and K2 units of capital.
B
K2
A
K1
q1
C2
L2
L1
C1
Labor per year