By foot, bus or car: children''''s school travel and school choice policy docx
Bạn đang xem bản rút gọn của tài liệu. Xem và tải ngay bản đầy đủ của tài liệu tại đây (1.92 MB, 19 trang )
Environment and Planning A 2010, volume 42, pages 2168 ^ 2185
doi:10.1068/a435
By foot, bus or car: children's school travel and school choice
policy
Elizabeth J Wilson
Humphrey Institute of Public Affairs, University of Minnesota, 301 19th Ave S., Minneapolis,
MN 55455, USA; e-mail:
Julian Marshall
Department of Civil Engineering, University of Minnesota, 301 19th Ave S., Minneapolis,
MN 55455, USA; e-mail:
Ryan Wilson
Active Communities/Transportation (ACT) Research Group, Humphrey Institute of Public
Affairs, University of Minnesota, 301 19th Ave S., Minneapolis, MN 55455, USA;
e-mail:
Kevin J Krizek
Active Communities/Transportation (ACT) Research Group, Environmental Design Building,
University of Colorado, Campus Box 314, Boulder, CO 80309-0314, USA;
e-mail:
Received 7 January 2010; in revised form 24 March 2010
Abstract. Many school districts in the United States allow parents to choose which school their child
attends (`school choice' or `magnet schools') while other school districts require students to attend
their nearest (`neighborhood') school. Such policies influence children's transportation. We survey
elementary-school parents in St. Paul and Roseville, Minnesota, to discover how children travel to
school and underlying factors influencing parent's choice of their child's travel mode. From this
information we develop a statistical model of travel mode choice. We find that children's commute
mode and parental attitudes towards school selection differ by school type (magnet versus neighborhood), income, and race. Relative to neighborhood schools, magnet schools draw from broader
geographic regions, have lower rates of walking, bicycling, and commuting by automobile, and higher
busing rates. Parent attitudes towards transportation also differ by race and school type. For example,
parents of nonwhite and magnet school students placed greater-than-average importance on bus
service and quality. This paper highlights the potentially unintended influence of school district policy
on school commute mode.
1 Introduction
Recent policy attention and research have focused on children's school commuting.
Concerns include children's health and safety, traffic congestion, environmental
impacts of transportation, and parents' time chauffeuring children. Popular responses
aim to increase rates of commuting by bicycle and walking (Rosenthal, 2009), but
rarely do these initiatives directly account for other policies, such as school choice,
that also impact school transportation. School travel is intricately tied to geography (eg
urban, suburban, or rural environments), state and district school bus policy, school
quality, extracurricular activities of children, and other factors. School travel policies
differ among and within states; for example, some but not all states require that districts
provide bus service for students.
In the United States, the Safe, Accountable, Flexible, Efficient Transportation
Equity Act: A Legacy for Users (SAFETEA-LU) aims to create and augment school
travel programs under the banner of Safe Routes to School (SR2S). Such initiatives
often address physical infrastructure, improvements to street design, volunteer opportunities, and educational activities to encourage bicycling and walking. Assessing the
By foot, bus or car: children's school travel and school choice policy
2169
effectiveness of SR2S is difficult in part because other factors (eg educational policies)
affect children's commute patterns.
Historically, children typically attended the school closest to their home (`neighborhood school'). Today, in some US school districts, children can enroll in a school
choice program, attending a `magnet school' instead of the closest neighborhood
school. We aim to explore interactions between school choice and school commute
mode, especially walking and cycling. Given the increasing prominence of both types
of initiatives (school choice and SR2S), improved understanding of this topic can help
researchers, practitioners, government and school officials, and the general public
understand the impacts of specific school policies on transportation. This topic is
set against a backdrop of declining school budgets, rising transportation costs, and
heightened attention worldwide to greenhouse gas emissions.
To our knowledge, only one previous effort (Wilson et al, 2007) explicitly studied
school travel in light of school choice. There, we found that school choice led to
longer school commute distances (because children attend schools across the district
rather than in their neighborhood) and reduced levels of walking and bicycling to
school (because longer commutes are less amenable to walking or bicycling). The
current study strengthens and expands earlier research. We survey parents to determine
attitudes that affect school choice and school travel mode. Rather than rely on national
data, we analyze differences at the local level between an urban and a suburban school
district and investigate how parents' school transportation mode choices and attitudes
differ by ethnicity, school type, and income. Using the survey data, we develop a
statistical model of the factors that determine school travel mode.
After the introduction (part 1), in part 2 we provide background, the context of
the study, and review relevant literature. Part 3 describes the study locations and the
survey and part 4 presents survey results and the multinomial logistic regression
model. In part 5 we discuss implications for school policy.
2 Background
The US youth population (53 million people in 2007, aged 5 ^ 17 years) is larger than
most nations. Concerns about school commuting include traffic congestion, safety,
environmental impacts, and direct and indirect costs. Increasing obesity and decreasing physical activity among children have led to federal (Centers for Disease Control
and Prevention, 2005; Federal Highway Administration, 2006) and state (Boarnet et al,
2005; Butcher, 2006; Staunton et al, 2003) projects to increase walking and cycling to
school (Krizek et al, 2004). The US SR2S program, funded through SAFETEA-LU
(Section 1404), is a well-known example and source of funding (McDonald and Howlett,
2007).
2.1 School choice
School choice allows a child to attend a school other than the one closest to home. A
single school district may include school-choice (magnet) schools and non-school-choice
(neighborhood) schoolsöas is the case for both of the cities we surveyedöand choice can
be solely within district (as with the two cities we surveyed) or between districts.
Two main aims of school choice are (1) enhanced educational performance and (2)
racial and socioeconomic diversity in each school, owing to greater mixing among
segregated neighborhoods (`voluntary desegregation') (Gorard et al, 2001; Schellenberg
and Porter, 2003; Schneider et al, 1997; Whitty, 1998). A study in St. Paul, Minnesota,
found that the dominant motivation for school choice has shifted over time, from
voluntary desegregation previously to, at present, improved educational performance
(Schellenberg and Porter, 2003). The 2002 ``No Child Left Behind'' Act encourages
2170
E J Wilson, J Marshall, R Wilson, K J Krizek
school choice by (1) allowing students whose school has not maintained adequate
progress for two years to attend a school with better test scores and (2) encouraging
the funding of magnet schools (Part B, Voluntary Public School Choice Program 115
Stat. 1803). We do not take a position in favor of or against school choice ölegitimate
arguments exist on both sides of this debateöand instead note that school-choice
programs are more common today than a decade or two ago; both support and
criticism for school choice can be found throughout the political spectrum (Gorard
et al, 2001). At issue for this work is that school choice has important implications for
school commuting and especially for walking and bicycling.
2.2 Factors that determine mode choice
Table 1 summarizes literature-identified factors that influence school travel mode.
Travel distance has the greatest impact: at distances greater than 0.8 km from the
school, walking ceases to be the most common travel mode; at 1.6 km walking rates
decrease to near zero (DiGuiseppi et al, 1998; McDonald, 2007a). One study found
Table 1. Example factors that can influence school travel mode.
Factor
Trip
Type
Effect
Mode a
Association b
from-school
(vs. to-school)
w
() McMillan (2003), Schlossberg et al
(2005)
(0) DiGuiseppi et al (1998), Sirard et al
(2005a)
() McMillan (2003), Sirard et al
(2005a), Schlossberg et al (2005)
(À)/() McMillan (2007), Schlossberg
et al (2005; 2006), Wen et al (2007)
b
Travel distance
School attribute
Choice
increase
w/b/a
magnet
w/b/a
(vs. neighborhood)
increase
w
(À)/() Wilson et al (2007)
elementary
(vs. secondary)
female (vs. male)
w
(0) Dellinger and Staunton (2002)
w
(À) Evenson et al (2003), McMillan
et al (2006); (0) McDonald (2007b)
Household characteristic
Vehicle
increase
w/a
Sibling
Income
presence
increase
w
w/a
(À)/() Ewing et al (2004), Wen et al
(2007)
() McDonald (2007a)
(À)/() California Department of
Health Services (2004), Ewing et al
(2004)
Urban form
Population density
increase
w
increase
increase
w
w
() McDonald (2007a), Braza et al
(2004); (0) Ewing et al (2004)
() Kerr et al (2006)
() Ewing et al (2004)
increase
w
() Schlossberg et al (2006)
Enrollment
Child characteristic
Grade
Sex
Walkability index
Sidewalk
connectivity
Street connectivity
a wÐwalk,
(À) Kouri (1999), Braza et al (2004);
(0) Ewing et al (2004)
bÐbike, aÐauto.
b () increase in travel mode; (À) decrease in travel mode; (0) no effect on travel mode.
By foot, bus or car: children's school travel and school choice policy
2171
that a child has nearly three times greater odds of walking or bicycling within 1.6 km
than outside 1.6 km (McMillan et al, 2006). Even within 1.6 km, as few as 31% of
students walk or bicycle to school (Dellinger and Staunton, 2002).
School location influences travel distance, which in turn influences travel behavior
(McDonald, 2005; 2008; McMillan, 2005; McMillan et al, 2006). School commuting
via walking and bicycling decreased from 41% in 1969 to 13% in 2003, with the largest
decreases among nonwhite elementary students; roughly half (47%) of the decline was
explained by the increased distance between home and school (McDonald, 2008).
Changes in the school-age population, including race and child age, and changing
attitudes towards school travel likely explain some of the decline as well. Decreasing
residential density and increasing number of students per school generally result in
fewer children living near their school. McDonald estimates that a residential density
of nearly 400 people per square kilometer is necessary to sustain a 300-student community school in which all students could commute by walking or cycling (assumed
maximum travel distance: 1.6 km). Roughly two thirds (64%) of US households with
school-age children currently live in locations at or above this level of residential
density (McDonald, 2008).
SR2S programs often focus on a third factor influencing active-travel rates: urban
form. Relative to travel distance and demographic characteristics, urban form has been
found to play a smaller but still important role in school commute mode (McMillan,
2007). One study found that infrastructure constructed through SR2S programs
increased walking (Boarnet et al, 2005) and suggested further evaluation in multiple
locations to help generate firm conclusions.
Parental concerns and preferences about school travel are often identified as
important factors, but many studies do not explore or quantify how this factor
influences travel mode choice. This gap in the literature is noteworthy because parental
attitudes may be at least as influential as urban form, especially perceptions about
safety, social interaction, and convenience (McMillan, 2007). Common concerns
include traffic, bullies, and strangers (DiGuiseppi et al, 1998; Hillman et al, 1990;
Kerr et al, 2006; Martin and Carlson, 2005). Concerns about traffic may prevent up
to 40% of children from walking or bicycling (Dellinger and Staunton, 2002). Parents
have stated that a walking escort may increase their willingness to allow their child to
walk to school (Schlossberg et al, 2005), perhaps helping to explain a British study
that estimated 84% of parents accompanied their children when they walked to
school (DiGuiseppi et al, 1998). A parent might also prefer to drop their child off
at school separately or as part of another trip regardless of bus availability or school
proximity (Schlossberg et al, 2006).
Whether mode choice yields expected impacts on daily activity level remains an
open question. Available research confirms declining activity levels for children (Dietz
and Gortmaker, 2001; Trost et al, 2002) and adolescents (Sallis, et al, 2000). However,
studies evaluating the role of walking to school have been mixed in finding statistically
significant increases in children's daily activity level (Krizek et al, 2004). For example,
one study found no effect on total activity for five-year-olds driven to school (Metcalf
et al, 2004); another found increased total activity correlated with walking to school,
yet with statistical significance only in boys (Cooper et al, 2003). More recent studies
have found increased total activity for children walking to school (Cooper et al, 2005;
Sirard et al, 2005a; 2005b).
2172
E J Wilson, J Marshall, R Wilson, K J Krizek
3 Research approach
3.1 Survey administration and study area
We surveyed parents of students in grade K-6 in two Minnesota school districts:
St. Paul (the state capital) and Roseville Area Schools (a group of suburbs bordering St. Paul (1). The survey was developed in concert with the school districts (Roseville
Area Schools, 2009; Saint Paul Public Schools, 2009). Our survey questions were
informed by several sources, including the Marin County Safe Routes to School Parent
Survey, the New York City Walk to School Parent/Guardian Survey, and the Michigan
Fitness Walk to School Day Parent Survey (Marin County Safe Routes to School
Program, 2009; New York City Department of Transportation, 2009; Safe Routes to
School Michigan, 2009). The survey consisted of twenty-two questions to measure
students' school commute modes and route, and parent attitudes about school choice
and their respective transportation choices. The communities were selected to explore
variations in urban form (urban versus suburban; see table 2) and school-choice policy.
St. Paul and Roseville provide bus services to students living more than 1.6 km and
0.8 km, respectively, from the school they attend. In St. Paul approximately 5% of the
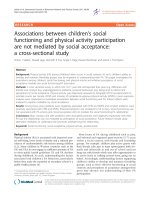
school district budget is for transportation (School Choice Taskforce, 2005). Figure 1
shows the school district boundaries and identifies the location and type of each
elementary school.
Roseville's post-war development pattern is typical of US suburban development.
In contrast, St. Paul was largely developed before World War II, and displays attributes
of a walkable community (sidewalks, local streets, relatively high density). In St. Paul
91% of elementary school students live within 1.6 km of an elementary school, which
suggests that, in the absence of school choice and with the current bus policy, only
$ 9% of school children would need a bus service.
Table 2. Description of case-study school districts.
Characteristic
St. Paul
Roseville area
Area (km2 )
Number of municipalities served
Year(s) incorporated
Year-2000 population
Dominant urban form
145
1
1854
287 151
urban
53
7
1948 ± 1974
52 143
suburban
Number of children in public schools
Number of children in public elementary schools
Number of `neighborhood' public elementary schools
Number of `magnet' public elementary schools
Median enrollment per school (neighborhood/magnet)
Percentage of students living within 0.8 km of an
elementary school a
Percentage of students living within 1.6 km of an
elementary school a
40 543
21 766
21
34
392/324
52
6 396
3 222
6
1
412/703
19
91
53
Number of respondents (percentage of respondents)
Number of respondents included in the analyses
(percentage of sample)
Attend neighborhood school (percentage of sample)
Attend magnet school (percentage of sample)
1264 (58)
917 (58)
861 (40)
516 (42)
34
66
80
20
a Network
(1) The
distance.
Roseville Area School District serves Roseville plus the municipalities of Arden Hills,
Falcon Heights, Lauderdale, Little Canada, Maplewood, and Shoreview (all of which are too small
to have their own school districts).
By foot, bus or car: children's school travel and school choice policy
2173
Magnet
Neighborhood
District
boundary
Parks
Water
0
0
1
Freeway
2 km
1
2miles
Figure 1. [In color online, see Location of St. Paul and Roseville
Area elementary schools.
To increase school diversity, geographic boundaries for St. Paul's neighborhood
schools are not always contiguous; magnet schools include socioeconomic status
(specifically, whether a student qualifies for reduced-cost or free lunch programs)
among their selection criteria (Schellenberg and Porter, 2003). In 1974 almost all
students in the St. Paul school district attended a school located in or near their
neighborhood. Today, any public school student [in the US, `public schools' refers to
schools receiving most of their funding from public government (tax-based) monies] in
St. Paul is eligible to attend a `choice' school; an estimated 67% of students attended a
school that is not their neighborhood school (School Choice Taskforce, 2005). Roseville
has one `choice school' which any student in the district is eligible to attend.
Surveys were mailed in late May 2007 to 8744 households with children in grade
K-8 (St. Paul: 6000, Roseville: 2744). School districts provided home addresses for
mailings. We maintained confidentiality by using an off-site mailing service; investigators never saw home addresses. The survey was translated into Hmong, Somali, and
Spanish for households with dominant languages other than English. One week later,
we followed up with reminder postcards. Approximately 215 surveys were returned
undeliverable by the post office and we received 2185 completed surveys. The response
rate (25%) is similar to previous mail surveys by St. Paul School District (Schellenberg,
personal communication, 2007). Of the completed surveys, 1835 (84%) provided their
home location and school name, which were necessary to calculate distance to
school. Analyses here focus on primary-school children (grade K-8) who made five
to-school and five from-school trips, resulting in a final sample of 1433.
2174
E J Wilson, J Marshall, R Wilson, K J Krizek
3.2 School travel model
Only a few previous studies have developed statistical models to predict school
commute modes. Existing models employed logistic regressions, such as binary
(McMillan et al, 2006; Wen et al, 2007), nested (Ewing et al, 2004), and multinomial
(McDonald, 2007a). We use the survey data to develop a multinomial logistic regression model that describes the likelihood a child will travel via auto, bus, or walk, as a
function of continuous and categorical independent variables (school attributes,
distance, child and household characteristics, and commute-route urban form).
We measured and tested whether the following variables affect walking (basis:
200 m buffer around each child's shortest walking path): number of busy intersections
crossed, intersection and street density, total daily vehicle-miles traveled, average
vehicle speed along the route, population density, and land use (R Wilson, 2008).
Sidewalk coverage data do not exist for Roseville and could not be tested in the model.
We refined the model through systematic testing of independent variables as the difference in log-likelihood ratios. Violating independent irrelevant alternatives is not a large
concern: the travel survey sample has known travel choices and school district officials
confirmed that nearly all children travel to school via auto, school bus, or walking
(Schellenberg, personal communication, 2007).
In developing the school travel model, we eliminated the 217 students who live
outside of their school district boundary or are missing variable information, yielding
a sample of 1216 used for model development. We calculated distance to school as the
shortest road network travel distance, using ArcGIS v.9.2. We weighted the travel
survey sample against the Census 2000 population residing in the school district,
accounting for differences in race and income (MetroGIS DataFinder, 2009). Weighting to census data rather than specifically to the school population is imperfect, but is
the best approach available (household income data are not available for the Roseville
Area School District) (Kennedy, 2007; Saint Paul Public Schools, 2005).
4 Results
4.1 Demographic comparison
Compared with the overall school district population, our survey sample is both whiter
and wealthier, an occurrence similar to previous surveys conducted in these school
districts (Schellenberg, personal communication, 2007). The greater affluence in our
sample may represent a response bias (if higher income parents are more likely to
respond to the survey) or an accurate reflection of the sampled populations [if parents
of elementary-age children are more affluent than the general public öa plausible
scenario because college students and retirees have lower-than-average incomes
and are included in census data but not heavily represented in our survey population
(US Census Bureau, 2006)]. Our survey results indicate that the Roseville magnet
school has a higher median household income ($90 000) than Roseville neighborhood schools ($75 000), St. Paul neighborhood schools ($70 000), and St. Paul magnet
schools ($60 000).
4.2 Comparison of to-school and from-school trips
Consistent with previous investigations, (McMillan, 2003; Schlossberg et al, 2005), we
find that travel mode may differ during the week and between to-school and fromschool commutes: in our data 35% of students rely on different modes to-school versus
from-school and 40% of students used at least two different modes during the week.
Considering separately the five to-school and five from-school trips per week, 77% of
respondents used one travel mode for all five to-school trips; 78% used only one travel
mode for the five from-school trips; 99% of students have a dominant (between three
By foot, bus or car: children's school travel and school choice policy
2175
and five trips per week) mode for to-school and a dominant mode for from-school
commutes. Furthermore, 89% have a dominant mode when all ten weekly trips (ie six
or more trips by one mode) are considered collectively. We conclude that employing
dominant mode is a useful and appropriate simplification for our logistic model, and
that incorporating to-school versus from-school differences strengthens the model.
4.3 Travel for magnet schools versus neighborhood schools
We examined relationships between dominant travel mode and distance, stratified by
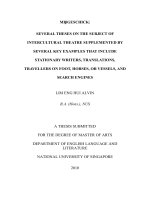
school type and show St. Paul school district in table 3. As an illustration, figure 2
displays the locations of one neighborhood and one magnet school in St. Paul and the
home locations of respondents who attend the respective schools. The data show
similarities in travel mode between magnet and neighborhood schools for similar
distances to school. The percentage of St. Paul children who walk or bicycle is similar
for neighborhood and magnet schools at distances less than 0.8 km, though the
percentage of students walking is nearly two times greater at neighborhood schools
than magnet schools in the 0.8 ^ 1.6 km interval. For commute distances greater than
1.6 km, walking is nearly zero and busing is more common than automobile, with the
proportion of students being bused being greater at magnet than at neighborhood
schools. As St. Paul only offers a bus service at distances greater than 1.6 km, the
findings are expected and appear to reflect school policy. For Roseville there is more
bus and auto use and less walking at both short distances and more busing at longer
distances (0.8 ^ 4.8 km), highlighting the effect of district busing policy.
Comparing total trips (ie, not stratifying on travel distance), walking and driving
are less common for magnet than for neighborhood schools. Relative to neighborhood
schools, magnet schools walk three times less (27% neighborhood; 9% magnet), drive
1.4 times less (42%; 30%), and use the bus twice as much (30%; 61%). For both types of
school, driving represents the largest share for the 0.8 ^ 1.6 km distance (50% and 54%
of trips for neighborhood and magnet schools, respectively), highlighting the low
number of elementary school children who walk at this distance. Roseville magnet
school students lived farther from school and fewer walked at all distances. Compared
with Roseville neighborhood schools, magnet school students were nine times less
likely to walk or cycle (9.7% for neighborhood; 1.1% for magnet), 8 percentage points
higher for busing (63.4% to 55.5%) and comparable in auto use (35% to 34.5%).
Table 3. Comparison of St. Paul neighborhood and magnet school student travel mode.
Distance to school (km)
`0.4
(%)
0.4 ± 0.8
(%)
0.8 ± 1.6
(%)
1.6 ± 3.2
(%)
3.2 ± 4.8
(%)
b4.8
(%)
St. Paul neighborhood school
bus
6.9
3.7
auto
15.8
27.7
walk/bike
77.3
68.6
16.3
51.1
32.5
41.3
55.0
3.7
51.4
48.6
0.0
60.3
37.6
2.1
30.4
42.2
27.3
954
1 324
856
St. Paul magnet
bus
auto
walk/bike
29.8
53.3
16.9
67.3
30.5
2.2
74.2
24.6
1.2
69.0
30.2
0.8
61.1
30.1
8.8
3 684
1 812
529
school
6.4
10.3
21.6
21.0
72.0
68.7
Difference (magnet-neighborhood)
bus
À0.5
6.6
13.5*
26.1**
auto
5.8
À6.7
2.2
À24.5**
walk/bike
À5.3
0.1
À15.6** À1.5
* Significant at p ` 0X05, ** significant at p ` 0X01.
22.8
À24.0**
1.2
Percentage
of total
8.7
30.7
À7.4 À12.2
À1.3** À18.5
Total
trips n
2176
E J Wilson, J Marshall, R Wilson, K J Krizek
Respondents
School
District boundary
Parks
Water
Roads
Interstate
State highway
US highway
........ Local
0
1.5
0
3 km
1.5
3miles
Figure 2. [In color online.] Location of one neighborhood and one magnet school in St. Paul and
the home locations of respondents who attend the respective schools.
Percentage of total students attending
Children who attend a magnet school often have a longer commute distance.
Figure 3 compares travel distance for neighborhood and magnet schools in St. Paul
and illustrates this finding: a greater percentage of neighborhood school students live
closer to the school they attend (results for Roseville are similar). Median travel
distance is 2.7 times greater for magnet than for neighborhood schools (4.3 km versus
1.6 km). The portion of students commuting more than 3.2 km is 2.5 times greater for
magnet than for neighborhood schools (43% versus 17%).
45
40
St. Paul neighborhood, n 312
35
St. Paul magnet, n 605
30
25
20
15
10
5
0
` 0X4
0.4 ^
0.8 ^
1.6 ^
3.2 ^
b 4X8
0.8
1.6
3.2
4.8
Distance to elementary school (km)
Figure 3. Travel distance by school type for St. Paul.
By foot, bus or car: children's school travel and school choice policy
2177
4.4 Explaining school selection and travel
Parents' school selection decisions influence child travel mode and in this section we
examine reasons parents choose their child's schools and explore differences by race,
sex, and income. Table 4 compares survey respondent attitudes on school selection
between neighborhood and magnet school parents, showing data for St. Paul. When
parents were queried about the reasons underlying their choice for their child's school,
three criteria (of ten (2) listed in the survey) were very or somewhat important for most
parents: quality of teachers, size of class, and curriculum. This was the same for
Roseville.
Among St. Paul magnet school parents, 85% ranked curriculum as very important
compared with 75% of neighborhood school parents (statistically significant at
p 5 0X01)önot surprising considering most magnet schools offer a specialized curriculum (eg language, math and science, arts, and others). More parents of children
attending neighborhood schools ranked the school being close to home as very or
somewhat important (49% versus 31%), while more magnet parents valued availability
of a bus service (56% versus 33%). One St. Paul parent wrote,
``Our child's school is 5 minutes (walking) and 1 minute (drive) away. The most
important benefit is he can either sleep more or play more or study more.''
Writes a St. Paul magnet school parent,
``Safe and reliable bus service is an integral part of the school choice program. Our
neighborhood school was an unacceptable option for us, so going `further afield' to
a magnet school was the best choice for us, but wouldn't have been feasible without
bus transportation.''
Roseville neighborhood and magnet school parents were similar (neighborhood parents
value school proximity to home more than magnet school parents: 52% to 29%), but not
statistically significant, relating in part to the smaller sample size and lack of statistical
power.
Survey responses are different for white and nonwhite parents, with responses
from St. Paul parents shown in table 5. Compared with the survey median, nonwhite
respondents are, on average, poorer and live farther from school ( p 5 0X01). Nonwhite children are also more likely to take the bus and attend a magnet school (71%
nonwhite versus 63% white); 72% of nonwhite parents ranked the availability of a
school bus service as very important, versus 37% of white parents ( p 5 0X01). For
Roseville 60% of nonwhite parents versus 43% of white parents ( p 5 0X05) scored
bus availability as `very important'. There were also some differences between white
and nonwhite parents' responses to important factors in determining whether their
child rides the bus: 81% of nonwhite parents placed safety at the bus stop as `very
important', versus 63% of white parents ( p 5 0X05). Nonwhite parents were more
concerned about cold temperatures at the bus stop (`very important': 66%) than
white parents (`very important': 21%) ( p 5 0X01). Nonwhite parents also placed
greater importance on diversity and on the school being close to home ( p 5 0X01).
Responses were similar for Roseville.
Overall, among the eight reasons offered for why children did not recently walk or
bicycle to school, distance was the primary reason (66% of the sample) followed by
difficult crossings (40%). These results were similar for Roseville. This finding suggests
that school choice and the popularity of magnet schools strongly affect children's
tendency to walk or bicycle to school.
(2) The
ten factors are: school bus services available, close to home, quality of teachers, size of class,
diversity, curriculum, close to work, school start time, distance from your other child's school, and
other factors.
School bus service available
Close to home
Quality of teachers
Size of class
Diversity
Curriculum
Close to work
School start time
Distance from other child's school
* p ` 0X05, ** p ` 0X01. a Percentages
significance).
Neighborhood school (%) a (n 314)
Magnet schools (%) (n 603)
very somewhat not very not at
all
School attribute
very
33.1
49.4
94.9
71.3
33.1
75.2
5.1
20.7
9.9
may
23.2
13.4
40.1
8.3
3.5
0.6
25.8
1.6
46.8
13.4
20.4
1.6
17.2
33.4
37.6
29.0
19.1
18.5
not add up to 100%
does not
apply
22.9
5.7
0.6
0.6
0.0
0.3
0.0
0.0
2.9
1.3
0.0
0.6
33.4
8.9
11.1
0.6
10.5
39.8
due to missing values.
somewhat
not very
not at
all
does not
apply
Difference
statistic b
56.1 24.5
8.0
8.6
2.2
À6.23**
30.8 46.3
16.1
4.5
1.0
À6.01**
95.5
3.3
0.5
0.0
0.2
À0.16
64.7 29.7
4.1
0.5
0.0
À2.16*
45.6 40.6
9.6
2.3
0.2
À3.17**
84.9 13.1
0.5
0.2
0.3
À3.28**
6.6 20.9
34.5
29.5
6.3
À0.69
20.2 37.5
28.2
12.8
0.3
À0.49
11.8 20.2
18.6
11.4
36.3
À0.77
b Reporting Z-statistic from Mann ± Whitney U-test (2-tailed
White students (%) a (n 626)
very somewhat not very not at
all
School bus service available
Close to home
Quality of teachers
Size of class
Diversity
Curriculum
Close to work
School start time
Distance from other child's school
* p ` 0X05, ** p ` 0X01. a Percentages
significance).
37.0
32.6
97.1
67.3
35.0
81.6
2.9
10.1
6.1
may
28.8
12.5
47.9
15.0
2.6
0.0
29.9
1.9
50.2
12.1
16.8
0.8
16.3
35.8
39.9
34.2
20.1
18.4
not add up to 100%
Nonwhite students (%) (n 291)
does not
apply
17.4
3.3
3.2
0.6
0.0
0.2
0.2
0.0
1.8
0.3
0.0
0.3
37.9
6.2
14.9
0.2
12.3
41.9
due to missing values.
very
somewhat
not very
not at
all
does not
apply
Difference
statistic b
71.8 14.4
4.5
5.2
3.4
À9.30**
47.1 36.1
10.0
3.1
1.4
À3.76**
91.4
5.2
1.7
0.0
0.3
À3.61**
66.3 25.1
6.2
0.7
0.0
À0.92
55.0 26.8
8.2
4.1
1.0
À4.02**
81.4 13.1
1.0
0.3
0.7
À0.07
13.1 26.8
30.6
15.8
9.3
À6.91**
42.6 32.3
16.2
6.5
1.0
À10.00**
22.0 19.2
18.9
8.6
28.2
À1.45
b Reporting Z-statistic from Mann ± Whitney U-test (2-tailed
E J Wilson, J Marshall, R Wilson, K J Krizek
Table 5. Comparison of St. Paul white and nonwhite parent importance of school attribute in selecting school.
School attribute
2178
Table 4. Parent's responses of school attributes by St. Paul neighborhood versus magnet school.
N:/psfiles/epa4209w/
By foot, bus or car: children's school travel and school choice policy
2179
Differences in income and sex are as follows: (1) when a child was driven to school,
66% of drivers were female in both neighborhood and magnet schools; (2) roughly
42 ^ 47% of children (neighborhood ^ magnet) who were driven to school did so as part
of a parent's trip to work, while 42 ^ 45% of children (neighborhood ^ magnet) were
driven in a separate single-child trip; (3) only 12% of neighborhood and 7% of magnet
school children travel to school in a carpool; (4) the sex of the child did not have a
significant effect on mode choice. Those with an income below the county median level
lived slightly farther away from school: at a median distance of 2.8 km, compared with
above-median income families at a distance of 2.4 km.
4.5 School travel model analysis
Using the survey data, we constructed a weighted multinomial logistic regression model
to estimate the odds of (1) bus and (2) walk relative to the reference mode auto. The
model has a pseudo r 2 of 0.53 and correctly predicts travel mode for 74% of the travel
survey sample. Notable statistically insignificant variables include child sex, parent
attitudes towards school and travel mode, school enrollment, and school-specific test
scores.
Results from the logistic model (table 6) suggest that, relative to the reference mode
(auto), the odds are greater that a student will: (1) walk at the shortest travel distances,
(2) bus when service is available, (3) walk and bus more when traveling from-school
than to-school, (4) bus more in Roseville than St. Paul, (5) bus more for magnet
schools than for neighborhood schools, (6) walk or bus more if they are older,
(7) walk or bus more if they are from a larger household, (8) bus if they are nonwhite,
(9) ride more frequently in an auto as household income increases, and (10) are more
likely to be driven by female drivers.
Travel distance has the largest effect on school travel mode, suggested by the large
odds ratio compared with other variables. The output from the model reflects the
descriptive statistics well: busing odds are greater at most distances outside 1.2 km;
walking odds decrease markedly outside 0.8 km and are nearly zero outside 1.6 km; and,
the odds of walking are higher traveling from-school than to-school, though trip type
is not a statistically significant predictor of bus relative to auto. Possible explanations
for greater from-school walking include more daylight, warmer temperatures, more
`eyes on the street' (ie general activity and awareness by the public), challenges getting
children off to school on time, or parents better able to coordinate morning work and
school start times.
Magnet school students are more than twice as likely to take the bus as neighborhood school students (odds: 2.4), likely attributable to more students living near their
neighborhood school and traveling by walking or auto since a bus service is unavailable at shorter distances. School type is not predictive of walking odds on its own.
However, total walking rates are 2.3 times greater for neighborhood schools than for
magnet (18% and 8%, respectively), as mentioned above. Such a finding reflects the
shorter travel distances for neighborhood schools: 46% of neighborhood versus 17% of
magnet students travel less than 1.6 km.
Examining school location, we find that busing is less likely among St. Paul than
Roseville students (odds: 0.155), reflecting the different district bus policies. Despite
initial expectations, after controlling for other variables, the odds of walking relative to
auto are not significantly higher in St. Paul than in Roseville. However, total walking
rates are 1.9 times greater for St. Paul compared with Roseville (15% versus 8%).
School siting alone cannot explain this finding as 28% of St. Paul students and 39%
of Roseville students travel less than 1.6 km. Further analysis to isolate the influence of
urban form or other factors would be fruitful.
2180
E J Wilson, J Marshall, R Wilson, K J Krizek
Table 6. Multinomial logistic regression model estimating elementary-age school travel mode.
Variable
Bus a
Walk a
coef.
std.
P b jzj odds
error
coef.
std.
error
P b jzj odds
Intercept
À2.51
0.55
0.000
À4.12
0.77
0.000
Trip type
To-school (0 from-school)
À0.21
0.11
0.061
0.81
À0.47
0.19
0.014
0.63
0.31
0.28
1.07
0.93
1.68
1.69
1.85
0.00
0.88
0.43
0.41
0.41
0.39
0.41
0.40
0.40
0.475
0.497
0.009
0.017
0.000
0.000
0.000
1.36
1.32
2.92
2.54
5.38
5.41
6.33
0.35
0.35
0.40
0.46
0.81
1.10
0.59
0.284
0.000
0.000
0.000
0.000
0.000
0.000
0.69
0.19
0.11
0.02
0.01
0.00
0.01
0.14
0.000
2.41
À0.37
À1.68
À2.17
À3.83
À4.64
À5.94
À4.67
0.00
À0.09
0.23
0.697
0.91
À1.87
0.21
0.000
0.15
0.29
0.34
0.388
1.34
0.57
0.09
1.02
0.47
0.98
1.49
0.00
0.18
0.19
0.21
0.21
0.21
0.23
0.001
0.616
0.000
0.028
0.000
0.000
1.76
1.10
2.78
1.60
2.66
4.44
0.18
0.09
0.04
0.24
0.95
2.15
0.00
0.35
0.35
0.40
0.37
0.38
0.38
0.602
0.793
0.924
0.514
0.013
0.000
1.20
1.10
1.04
1.27
2.60
8.62
0.41
À0.56
2.17
1.46
0.98
0.56
0.20
À0.14
0.00
0.05
0.16
0.25
0.22
0.22
0.25
0.24
0.31
0.000
0.000
0.000
0.000
0.000
0.023
0.399
0.650
1.50
0.57
8.79
4.30
2.67
1.75
1.23
0.87
0.59
0.15
0.01
0.99
0.95
0.76
0.66
0.30
0.00
0.08
0.27
0.58
0.38
0.37
0.39
0.40
0.50
0.000
0.589
0.993
0.009
0.010
0.053
0.101
0.547
1.81
1.16
1.01
2.70
2.58
2.14
1.94
1.35
0.05
0.03
0.100
1.05
0.17
0.05
0.000
1.18
School attributes
Travel distance, 0.4 ± 0.8 km
Travel distance, 0.8 ± 1.2 km
Travel distance, 1.2 ± 1.6 km
Travel distance, 1.6 ± 2.4 km
Travel distance, 2.4 ± 3.2 km
Travel distance, 3.2 ± 4.8 km
Travel distance, b 4.8 km
Travel distance, ` 0.4 km
Type, magnet
(0 neighborhood)
City, St. Paul (0 Roseville)
Child characteristics
Child grade, 1
Child grade, 2
Child grade, 3
Child grade, 4
Child grade, 5
Child grade, 6
Child grade, kindergarten
Household characteristics
Size (1 member)
Race, white (0 nonwhite)
Income, $0 ± 19 999
Income, $20 000 ± 39 999
Income, $40 000 ± 59 999
Income, $60 000 ± 79 999
Income, $80 000 ± 99 999
Income, $100 000 ± 119 000
Income, b$120 000
Route urban form (per km2)
Local street length (km)
Log-likelihood with constants
only
Log-likelihood at convergence
Likelihood ratio (50 df)
Prob b w 2
Nagelkerke pseudo r 2
Number of observations
a Car
4142.50
2766.15
1376.34
0.00
0.53
1216
is the reference mode.
Child and household characteristics also impact mode selection. Busing and
walking are more likely among older children than among the youngest children
(grades 3 ^ 6 busing odds relative to kindergarteners range from 1.6 ^ 4.4; grades 5
and 6 walking odds relative to kindergarteners are 2.6 and 8.6, respectively). Parents
might be more confident that older children can travel without them, though the survey
By foot, bus or car: children's school travel and school choice policy
2181
does not discern if the child travels alone or in a group [for example, for the walking
school bus had varied success in New Zealand (Kingham and Ussher, 2007)]. Students
from households with income levels below $80 000 are more likely to ride the bus than
ride in an auto (odds ranging from 1.8 to 8.8). Students with household-income levels
between $20 000 and $60 000 are more likely to walk than ride in an auto (odds:
2.6 ^ 2.7). One possible explanation is that households with higher income have greater
vehicle ownership (3) on average, and may prefer to drive their children. Alternatively,
lower income households might not have the means or available time to drive their
child; instead relying on walking or busing. Each additional household member
increases the odds that the child will bus or walk (busing odds of 1.5 with each
additional household member, walking odds of 1.8). Students from larger households
may have older siblings with whom to walk or ride the bus. Finally, white students are
less likely to ride in a bus than nonwhite students (odds 0.57), though race is not
predictive of walking odds.
The model found only one measure of urban form significant among the ten tested;
kilometers of local (ie noncounty, highway, or interstate) streets per square kilometer is
positively correlated with the odds of walking relative to riding in an automobile. This
measure reflects street connectivity: greater street connectivity means more local streets
and possibly lower vehicle speeds, making walking potentially safer. Finding only one
significant urban form variable has one of two implications: either local urban form is
not a large factor in determining school travel mode, or, alternatively, local urban form
does matter and the right measures have not yet been found and modeled.
5 Conclusions and policy implications
We find that school choice substantially influences school commuting travel behavior,
mainly by increasing travel distance, and subsequently, mode choice. School commute
mode may also be influenced by urban form (specifically, local road density), demographics, and parent mode choice. Our findings have direct implications for school
district transportation budgets and parents, but also speak to local traffic congestion,
childhood exercise levels, urban air pollutants, and greenhouse gas emissions.
Magnet schools draw from broader geographic regions than neighborhood schools,
so students are less able to walk or bicycle to school. Our survey results suggest that
the underlying reason for this difference is not different parent choices towards mode
selection, but simply because children live too far from their schools to walk or bicycle.
The higher proportion of magnet school students busing than being driven by auto
increases transportation costs for the district, but likely reduces air pollution emissions
than if more students commuted via automobile.
These results highlight the interplay between district policy, socioeconomic factors,
parental behavior, and attitudes in determining school mode choice. To the extent that
school-choice programs increase students' commute distance, such programs may
dramatically reduce opportunities for active school commuting. Policies focused on
improving active travel or implementing effective SR2S initiatives would benefit from
incorporating such knowledge into their project selection, analysis, and planning.
Not surprisingly, a greater proportion of magnet school students rely on a school
bus service. As service cost becomes an increasingly important issue, especially given
declining state and school district budgets, school-choice policy may require more fully
considering travel demand, racial and economic equity issues, trade-offs between
public and private costs, and environmental implications of any system changes.
(3) Vehicle
ownership and household income share a significant bivariate correlation (0.437); thus
testing only one variable is necessary. Household income improved overall model fit more than
vehicle ownership.
2182
E J Wilson, J Marshall, R Wilson, K J Krizek
The policy implications of this work span several distinct decision-making areas;
we focus on three. The first, and most general, is the need to evaluate policies within a
larger system perspective. For school choice, the environmental, budgetary, and mode
choice implications of the policy on school transportation are important yet often fall
outside of the traditional decision-making framework of school districts. While any
school district transportation analysis will include direct costs, an accounting of environmental emissions, children's activity, or total system costs, including private car
operation and transportation infrastructure considerations falls outside of traditional
analytical boundaries. Including and quantifying these `second order effects' highlight
the broader policy implications and impacts on other seemingly unrelated sectors and
policies.
Our parent survey data revealed different concerns for white and nonwhite parents.
In particular, nonwhite parents surveyed are more likely to have a child who rides the
bus and are more likely to attend a magnet school. This could be due to residential
segregation and the fact that many magnet schools are located in neighborhoods with
higher concentrations of nonwhite residents. However, because of this, any change in
district-level bus policy would disproportionately impact nonwhite parents. Parental
concern about availability of bus service and safety while waiting for and riding the bus
is greater for nonwhite than for white parents. Policies to encourage nonwhite children to walk or bicycle should be sensitive to different nonwhite parental concerns.
Additionally, families below the poverty line live farther away from school than wealthier
ones, though this may be in part an artifact of school choice.
All of these issues affect the success of SR2S projects and addressing these factors
could allow for better project prioritization and design to manage equity concerns. The
interplay between school policy and travel behavioröin this case SR2S and school
choiceöis likely to have an impact both on programs and on their eventual success.
Parents would likely prefer to send their children to nearby schools, but magnet
schools may offer dimensions (curricular, quality, or other factors) that subsume the
desire to send their children to the nearest school. These choices have important policy
implications beyond school transportation and begin to ask questions about neighborhood school quality and equality and approaches for school improvement. For
instance, a strategy to increase walking might be to strengthen an existing or add a
new curriculum to a neighborhood school or make a declining school more desirable
through capital investments.
5.1 Future implications
Several factors, including the `No Child Left Behind Act' in the US which (1) allows
students in underperforming schools to switch to a school with better test scores, and
(2) encourages the funding of magnet schools, suggest that school choice may become
increasingly prevalent. St. Paul may be indicative of future conditions for an increasing
number of US school districts. The analyses presented here capture only the first-order
effects of school choice; the total impacts may be greater and must be viewed within a
larger context of school and individual child performance, and larger societal goals.
Our model can be adapted to evaluate different school district choice policies by
creating scenarios in terms of mode share, cost (public and private), and environmental
emissions. It also would allow school boards, district transportation planners, and other
policy makers to estimate the mode choice, transportation, environmental, and fiscal
impacts of different educational policies.
Tackling issues of children's school transportation highlights the need to evaluate school policy on transportation and SR2S initiatives in light of policies about
school choiceöundoubtedly areas where state and city governments, school districts,
By foot, bus or car: children's school travel and school choice policy
2183
and parents are engaged and passionate. This work uncovers and frames some of the
difficult issues facing parents when deciding where to send their child to school and
how to get them there; furthermore, it highlights some of the challenges school districts
face in designing safe, equitable, and affordable transportation systems to transport
children to school.
Acknowledgements. We thank Emily Polak, Katie Meyer, and Melisa Pollak for their research
assistance, and David Levinson for his role as reader of Ryan Wilson's MS thesis and the
anonymous reviewers. The State and Local Policy Program, the Intelligent Transportation Systems
Institute, and the Center for Transportation Studies at the University of Minnesota provided
financial support for this research. Thanks also to Chrissy Rehnberg and Jan Vanderwall at
Roseville Area School District and Steve Schellenberg of St. Paul Public Schools. We are grateful
to the parents who filled out our survey.
References
Boarnet M G, Anderson C L, Day K, McMillan T, Alfonzo, M, 2005, ``Evaluation of the
California Safe Routes to School legislation, urban form changes and children's active
transportation to school'' American Journal of Preventive Medicine 28(2S2) 134 ^ 140
Braza M, Shoemaker W, Seeley A, 2004, ``Neighborhood design and rates of walking and biking
to elementary school in 34 California communities'' American Journal of Health Promotion
19 128 ^ 136
Butcher H L, 2006, ``Safe routes to school in Superior, WI and Duluth, MN'', paper presented
at the 10th National Conference on Transportation Planning for Small and Medium-Sized
Communities, Nashville, TN, Transportation Research Board, />view.aspx?id=804982
California Department of Health Services, 2004, California Children's Healthy Eating and
Exercise Practices Survey 1999 Data Tables (Table 56), />research/calcheeps.htm
Centers for Disease Control and Prevention, 2005, ``Kids walk-to-school'', />nccdphp/dnpa/kidswalk/
Cooper A R, Page A S, Foster L J, Qahwahi D, 2003, ``Commuting to school: are children who
walk more physically active? American Journal of Preventive Medicine 25 273 ^ 276
Cooper A R, Andersen L B, Wedderkopp N, Page A S, Froberg K, 2005, ``Physical activity levels
of children who walk, cycle, or are driven to school'' American Journal of Preventive Medicine
29 179 ^ 184
Dellinger A M, Staunton C E, 2002, ``Barriers to children walking and biking to school ö United
States, 1999'' Journal of the American Medical Association 288 1343 ^ 1344
Dietz W H, Gortmaker, S. L, 2001, ``Preventing obesity in children and adolescents'' Annual
Review of Public Health 22 337 ^ 353
DiGuiseppi C, Roberts I, Li L, Allen D, 1998, ``Determinants of car travel on daily journeys to
school: cross sectional survey of primary school children'' British Medical Journal 316(7142)
1426 ^ 1428
Evenson K R, Huston S L, McMillen B J, Bors P, Ward D S, 2003, ``Statewide prevalence and
correlates of walking and bicycling to school'' Archives of Pediatrics and Adolescent Medicine
157 887 ^ 892
Ewing R, Schroeer W, Greene W, 2004, ``School location and student travel: analysis of factors
affecting mode choice'' Transportation Research Records number 1895, 55 ^ 63
Federal Highway Administration, 2006, ``Safe routes to school'', />Gorard S, Fitz J, Taylor C, 2001,``School choice impacts: what do we know?'' Educational Researcher
30(7) 18 ^ 23
Hillman M, Adams J, Whitelegg J, 1990 One False Move ...: A study of Children's Independent
Mobility (Policy Studies Institute, London)
Kennedy P, 2007 Ethnic Diversity Data: School Year 2006 ^ 2007 Roseville Area School District,
Roseville, MN
Kerr J, Rosenberg D, Sallis J F, Saelens B E, Frank L D, Conway T L, 2006, ``Active commuting
to school: associations with environment and parental concerns'' Medicine and Science in
Sports and Exercise 38 787 ^ 793
Kingham S, Ussher S, 2007,``An assessment of the benefits of the walking school bus in Christchurch,
New Zealand'' Transportation Research, Part A 41 502 ^ 510
2184
E J Wilson, J Marshall, R Wilson, K J Krizek
Kouri C, 1999, ``Wait for the bus: how Lowcountry school site selection and design deter walking
to school'', storage 01/0000019b/
80/16/ef/b5.pdf
Krizek K J, Birnbaum A S, Levinson D M, 2004,``A schematic for focusing on youth in investigations
of community design and physical activity''American Journal of Health Promotion 19(1) 33 ^ 38
McDonald N C, 2005, Children's Travel: Patterns and Influences PhD dissertation, Department
of City and Regional Planning, University of California, Berkeley, CA
McDonald N, 2007a, ``Children's mode choice for the school trip: the role of distance and school
location in walking to school'' Transportation 35(1) 23 ^ 35
McDonald N C, 2007b, ``Active transportation to school: trends among U.S. schoolchildren,
1969 ^ 2001'' American Journal of Preventive Medicine 32 509 ^ 516
McDonald N C, 2008, ``Children's mode choice for the school trip: the role of distance and school
location in walking to school'' Transportation 35 23 ^ 35
McDonald N C, Howlett M A, 2007, ``Pupil transportation funding: a framework for analysis''
Transportation Research Board number 2009, 98 ^ 103
McMillan T, 2003 Walking and Urban Form: Modeling and Testing Parental Decisions about Children's
Travel PhD dissertation, Department of Urban and Regional Planning, University of
California, Irvine, CA
McMillan T E, 2005, ``Urban form and a child's trip to school: the current literature and a
framework for future research'' Journal of Planning Literature 19 440 ^ 456
McMillan T E, 2007, ``The relative influence of urban form on a child's travel mode to school''
Transportation Research, Part A: Policy and Practice 41(1) 69 ^ 79
McMillan T, Day K, Boarnet M, Alfonzo M, Anderson C, 2006, ``Johnny walks to school ödoes
Jane? Sex differences in children's active travel to school'' Children, Youth and Environments
16(1) 75 ^ 89
Marin County Safe Routes to School Program, 2009, ``Safe routes to schools: parent survey'',
3d 3d%22%3E
Martin S, Carlson S, 2005, ``Barriers to children walking to or from school öUnited States, 2004''
Morbidity and Mortality Weekly Report 54 949 ^ 952
Metcalf B, Voss L, Jeffery A, Perkins J, Wilkin T, 2004, ``Physical activity cost of the school run:
impact on schoolchildren of being driven to school'' British Medical Journal 329 832 ^ 833
MetroGIS DataFinder, 2009, DataFinder Catalog, />New York City Department of Transportation, 2009, ``New York City walk to schoolöparent/
guardian survey'', />No Child Left Behind Act of 2001 20 USC 6301 C.F.R (2002)
Rosenthal E, 2009, ``Students give up wheels for their own two feet'' New York Times 26 March,
r=1
Roseville Area Schools, 2009, ``Roseville area schools'', />Safe, Accountable, Flexible, Efficient Transportation Equity Act: A Legacy for Users
(SAFETEA-LU) 23 USC 101 C.F.R (2005)
Safe Routes to School Michigan, 2009, ``Michigan fitness walk to school day parent survey'',
/>Saint Paul Public Schools, 2005, ``Racial/ethnic student count by school or program'', Saint Paul
Public Schools, St. Paul, MN
Saint Paul Public Schools, 2009, ``Saint Paul Public Schools'', />Sallis J F, Prochaska J J, Taylor W C, 2000, ``A review of correlates of physical activity of children
and adolescents'' Medicine and Science in Sports and Engineering 32 963 ^ 975
Schellenberg S J, Porter C, 2003, ``School choice in established magnet school systems: voluntary
desegregation after thirty-five years'', paper presented at Symposium ``Are School Choice
and Charter Schools Resegregating Public Schooling?'' at Annual Meeting of the American
Educational Research Association, Chicago, IL, 24 April, />All Topics SPPS
Schlossberg M, Phillips P, Johnson B, Parker B, 2005, ``How do they get there? A spatial analysis
of a sprawl school in Oregon'' Planning Practice and Research 20 147 ^ 162
Schlossberg M, Greene J, Phillips P, Johnson B, Parker B, 2006, ``School trips: effects of urban form
and distance on travel mode'' Journal of the American Planning Association 72 337 ^ 346
Schneider M, Teske P, Marschall M, Mintrom M, Roch C, 1997, ``Institutional arrangements and
the creation of social capital: the effects of public school choice'' The American Political Science
Review 91(1) 82 ^ 93
By foot, bus or car: children's school travel and school choice policy
2185
School Choice Taskforce, 2005 The Report of the School Choice Taskforce School Choice Taskforce,
St. Paul, MN
Sirard J R, Ainsworth B E, McIver K L, Pate R R, 2005a, ``Prevalence of active commuting at
urban and suburban elementary schools in Columbia, SC'' American Journal of Public Health
95 236 ^ 237
Sirard J R, Riner W F J, McIver K L, Pate R R, 2005b, ``Physical activity and active commuting
to elementary school'' Medicine and Science in Sports and Exercise 37 2062 ^ 2069
Staunton C E, Hubsmith D, Kallins W, 2003, ``Promoting safe walking and biking to school:
the Marin County success story'' American Public Health Association 93 1431 ^ 1434
Trost S G, Pate R R, Sallis J F, Freedson P S, Taylor W C, Dowda M, et al, 2002, ``Age and
gender differences in objectively measured physical activity in youth'' Medicine and Science
in Sports and Exercise 34 350 ^ 355
US Census Bureau, 2006, ``2000 Census of Population and Housing'', />main/www/cen2000.html
Wen L M, Fry D, Rissel C, Dirkis H, Balafas A, Merom D, 2007, ``Factors associated with children
being driven to school: implications for walk to school programs'' Health Education Research
23 325 ^ 334
Whitty G, 1998, ``School choice policies in England and the United States: an exploration of
their origins and significance'' Comparative Education 34 211 ^ 227
Wilson E J, Wilson R, Krizek K J, 2007, ``The implications of school choice on travel behavior
and environmental emissions'' Transportation Research, Part D: Transport and Environment
12 506 ^ 518
Wilson R, 2008, ``Effect of Education Policy and Urban Form on Elementary-age School Travel'',
unpublished master's thesis, Department of Civil Engineering, University of Minnesota,
Minneapolis, MN
ß 2010 Pion Ltd and its Licensors
Conditions of use. This article may be downloaded from the E&P website for personal research
by members of subscribing organisations. This PDF may not be placed on any website (or other
online distribution system) without permission of the publisher.