(8th edition) (the pearson series in economics) robert pindyck, daniel rubinfeld microecon 273
Bạn đang xem bản rút gọn của tài liệu. Xem và tải ngay bản đầy đủ của tài liệu tại đây (83.5 KB, 1 trang )
248 PART 2 • Producers, Consumers, and Competitive Markets
Capital
D
(machinehours per
month)
5000
F
4000
3500
B
3000
A
2000
1000
Output of 2000
Tons of Steel per Month
E
5000
10,000 12,000
C
18,000 20,000
Wastewater
(gallons per month)
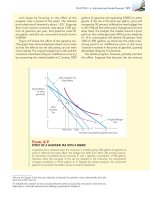
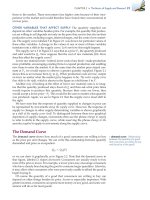
F IGURE 7.5
THE COST-MINIMIZING RESPONSE TO AN EFFLUENT FEE
When the firm is not charged for dumping its wastewater in a river, it chooses to produce
a given output using 10,000 gallons of wastewater and 2000 machine-hours of capital at A.
However, an effluent fee raises the cost of wastewater, shifts the isocost curve from FC to DE,
and causes the firm to produce at B—a process that results in much less effluent.
removal methods or private treatment plants are
relatively expensive.
Because taconite particles are a nondegradable waste that can harm vegetation and fish, the
Environmental Protection Agency (EPA) has imposed
an effluent fee—a per-unit fee that the steel firm
must pay for the effluent that goes into the river. How
should the manager of a steel plant deal with the
imposition of this fee to minimize production costs?
Suppose that without regulation the plant is
producing 2000 tons of steel per month, using
2000 machine-hours of capital and 10,000 gallons
of water (which contains taconite particles when
returned to the river). The manager estimates that
a machine-hour costs $40 and that dumping each
gallon of wastewater in the river costs $10. The total
cost of production is therefore $180,000: $80,000
for capital and $100,000 for wastewater. How should
the manager respond to an EPA-imposed effluent
fee of $10 per gallon of wastewater dumped? The
manager knows that there is some flexibility in the
production process. If the firm puts into place more
expensive effluent treatment equipment, it can
achieve the same output with less wastewater.
Figure 7.5 shows the cost-minimizing response.
The vertical axis measures the firm’s input of capital in machine-hours per month—the horizontal
axis measures the quantity of wastewater in gallons
per month. First, consider the level at which the
firm produces when there is no effluent fee. Point
A represents the input of capital and the level
of wastewater that allows the firm to produce its
quota of steel at minimum cost. Because the firm
is minimizing cost, A lies on the isocost line FC,
which is tangent to the isoquant. The slope of the
isocost line is equal to -$10/$40 = -0.25 because
a unit of capital costs four times more than a unit
of wastewater.