(8th edition) (the pearson series in economics) robert pindyck, daniel rubinfeld microecon 276
Bạn đang xem bản rút gọn của tài liệu. Xem và tải ngay bản đầy đủ của tài liệu tại đây (87.88 KB, 1 trang )
CHAPTER 7 • The Cost of Production 251
2. From the chosen isocost line, determine the minimum cost of producing
the output level that has been selected.
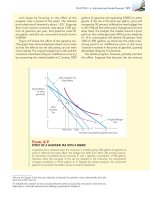
3. Graph the output-cost combination in Figure 7.6 (b).
Suppose we begin with an output of 100 units. The point of tangency of the
100-unit isoquant with an isocost line is given by point A in Figure 7.6 (a). Because
A lies on the $1000 isocost line, we know that the minimum cost of producing an
output of 100 units in the long run is $1000. We graph this combination of 100 units
of output and $1000 cost as point D in Figure 7.6 (b). Point D thus represents the
$1000 cost of producing 100 units of output. Similarly, point E represents the $2000
cost of producing 200 units which corresponds to point B on the expansion path.
Finally, point F represents the $3000 cost of 300 units corresponding to point C.
Repeating these steps for every level of output gives the long-run total cost curve in
Figure 7.6 (b)—i.e., the minimum long-run cost of producing each level of output.
In this particular example, the long-run total cost curve is a straight line.
Why? Because there are constant returns to scale in production: As inputs
increase proportionately, so do outputs. As we will see in the next section, the
shape of the expansion path provides information about how costs change with
the scale of the firm’s operation.
EX AMPLE 7. 5 REDUCING THE USE OF ENERGY
Policy makers around the world have been concerned with finding ways to reduce the use of
energy. In part, this reflects environmental concerns—most energy consumption uses fossil fuels
and thus contributes to the emission of greenhouse
gases and global warming. But energy, whether in
the form of oil, natural gas, coal or nuclear, is also
expensive, so if companies can find ways to reduce
their energy use, they can lower their costs.
There are essentially two ways that companies
can reduce the amount of energy they use. The
first is to substitute other factors of production for
energy. For example, some machines might be more
costly but also use less energy, so if energy prices
rise, firms could respond by buying and using those
energy-efficient machines, effectively substituting
capital for energy. This is exactly what has happened
as energy prices rose in recent years: firms bought
and installed expensive but more energy-efficient
heating and cooling systems, industrial processing
equipment, trucks, cars, and other vehicles.
The second way to reduce energy use is through
technological change. As time passes, research
and development lead to innovations that make it
8
possible to produce the same output using fewer
inputs—less labor, less capital, and less energy. Thus
even if the relative prices of energy and capital stay
the same, firms will use less energy (and less capital)
to produce the same output. Advances in robotics
during the past two decades are an example of this;
cars and trucks are now produced with less capital
and energy (as well as less labor).
These two ways of reducing energy use are
illustrated in Figures 7.7(a) and (b), which show
how capital and energy are combined to produce
output.8 The isoquants in each figure represent the
various combinations of capital and energy that
can be used to generate the same level of output.
The figures illustrate how reductions in energy use
can be achieved in two ways. First, firms can substitute more capital for energy, perhaps in response
to a government subsidy for investment in energysaving equipment and/or an increase in the cost of
electricity. This is shown as a movement along isoquant q1 from point A to point B in Figure 7.7(a),
with capital increasing from K1 to K2 and energy
decreasing from E2 to E1 in response to a shift in the
isocost curve from C0 to C1. Second, technological
This example was inspired by Kenneth Gillingham, Richard G. Newell, and Karen Palmer, “Energy
Efficiency Economics and Policy,” Annual Review of Resource Economics, 2009, Vol. 1: 597–619.