(8th edition) (the pearson series in economics) robert pindyck, daniel rubinfeld microecon 138
Bạn đang xem bản rút gọn của tài liệu. Xem và tải ngay bản đầy đủ của tài liệu tại đây (122.45 KB, 1 trang )
CHAPTER 4 • Individual and Market Demand 113
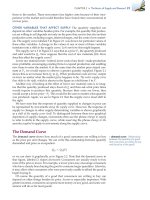
price almost always holds. But what happens to the consumption of clothing
as the price of food falls? As Figure 4.1 (a) shows, the consumption of clothing
may either increase or decrease. The consumption of both food and clothing can
increase because the decrease in the price of food has increased the consumer’s
ability to purchase both goods.
An individual demand curve relates the quantity of a good that a single
consumer will buy to the price of that good. In Figure 4.1 (b), the individual
demand curve relates the quantity of food that the consumer will buy to the
price of food. This demand curve has two important properties:
• individual demand
curve Curve relating the
quantity of a good that a single
consumer will buy to its price.
1. The level of utility that can be attained changes as we move along the curve.
The lower the price of the product, the higher the level of utility. Note from
Figure 4.1 (a) that a higher indifference curve is reached as the price falls.
Again, this result simply reflects the fact that as the price of a product falls, the
consumer’s purchasing power increases.
Clothing
(units per
month)
U1
Price-Consumption Curve
A
6
D
5
B
4
U3
U2
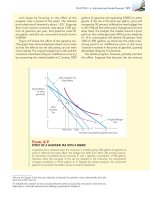
F IGURE 4.1
EFFECT OF PRICE CHANGES
4
12
20
Food (units
per month)
(a)
Price
of food
E
$2.00
1.50
Demand Curve
G
1.00
H
0.50
4
12
20
(b)
Food (units
per month)
A reduction in the price of food, with income and the
price of clothing fixed, causes this consumer to choose
a different market basket. In (a), the baskets that maximize utility for various prices of food (point A, $2; B, $1;
D, $0.50) trace out the price-consumption curve. Part (b)
gives the demand curve, which relates the price of food
to the quantity demanded. (Points E, G, and H correspond to points A, B, and D, respectively).