(8th edition) (the pearson series in economics) robert pindyck, daniel rubinfeld microecon 142
Bạn đang xem bản rút gọn của tài liệu. Xem và tải ngay bản đầy đủ của tài liệu tại đây (90.31 KB, 1 trang )
CHAPTER 4 • Individual and Market Demand 117
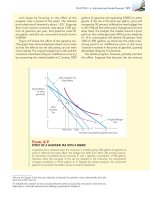
an upward-sloping Engel curve, is derived directly from Figure 4.2 (a). In both
figures, as the individual’s income increases from $10 to $20 to $30, her consumption of food increases from 4 to 10 to 16 units. Recall that in Figure 4.2 (a) the vertical axis measured units of clothing consumed per month and the horizontal axis
units of food per month; changes in income were reflected as shifts in the budget
line. In Figures 4.4 (a) and (b), we have replotted the data to put income on the
vertical axis, while keeping food and hamburger on the horizontal.
The upward-sloping Engel curve in Figure 4.4 (a)—like the upward-sloping
income-consumption curve in Figure 4.2 (a)—applies to all normal goods. Note
that an Engel curve for clothing would have a similar shape (clothing consumption increases from 3 to 5 to 7 units as income increases).
Figure 4.4 (b), derived from Figure 4.3, shows the Engel curve for hamburger.
We see that hamburger consumption increases from 5 to 10 units as income
increases from $10 to $20. As income increases further, from $20 to $30, consumption falls to 8 units. The portion of the Engel curve that slopes downward
is the income range within which hamburger is an inferior good.
E XAMPLE 4 .1
CONSUMER EXPENDITURES IN THE UNITED STATES
The Engel curves we just examined apply to individual consumers. However, we can also derive
Engel curves for groups of consumers. This information is particularly useful if we want to see how
consumer spending varies among
different income groups. Table 4.1
illustrates spending patterns for
several items taken from a survey by the U.S. Bureau
of Labor Statistics. Although the data are averaged
over many households, they can be interpreted as
TABLE 4.1
describing the expenditures of a
typical family.
Note that the data relate expenditures on a particular item rather
than the quantity of the item to
income. The first two items, entertainment and owned dwellings,
are consumption goods for which
the income elasticity of demand is
high. Average family expenditures on entertainment
increase almost fivefold when we move from the
lowest to highest income group. The same pattern
ANNUAL U.S. HOUSEHOLD CONSUMER EXPENDITURES
INCOME GROUP (2009 $)
EXPENDITURES
($) ON:
LESS THAN
$10,000
10,000–
19,999
20,000–
29,999
30,000–
39,999
40,000–
49,999
50,000–
69,999
70,000 AND
ABOVE
Entertainment
1,041
1,025
1,504
1,970
2,008
2,611
4,733
Owned Dwelling
1,880
2,083
3,117
4,038
4,847
6,473
12,306
Rented Dwelling
3,172
3,359
3,228
3,296
3,295
2,977
2,098
Health Care
1,222
1,917
2,536
2,684
2,937
3,454
4,393
Food
3,429
3,529
4,415
4,737
5,384
6,420
9,761
799
927
1,080
1,225
1,336
1,608
2,850
Clothing
Source: U. S. Department of Labor, Bureau of Labor Statistics, “Consumer Expenditure Survey, Annual Report 2010.”