(8th edition) (the pearson series in economics) robert pindyck, daniel rubinfeld microecon 143
Bạn đang xem bản rút gọn của tài liệu. Xem và tải ngay bản đầy đủ của tài liệu tại đây (103.59 KB, 1 trang )
118 PART 2 • Producers, Consumers, and Competitive Markets
applies to the purchase of homes: There is a more
than a sixfold increase in expenditures from the lowest to the highest category.
In contrast, expenditures on rental housing actually fall as income rises. This pattern reflects the
fact that most higher-income individuals own rather
than rent homes. Thus rental housing is an inferior
good, at least for incomes above $30,000 per year.
Finally, note that health care, food, and clothing are
consumption items for which the income elasticities
are positive, but not as high as for entertainment or
owner-occupied housing.
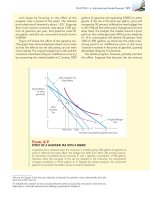
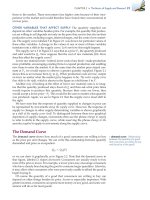
The data in Table 4.1 for rented dwellings,
health care, and entertainment have been plotted
in Figure 4.5. Observe in the three Engel curves
that as income rises, expenditures on entertainment and health care increase rapidly, while
expenditures on rental housing increase when
income is low, but decrease once income exceeds
$30,000.
$80,000
$70,000
F IGURE 4.5
Annual Income
$60,000
ENGEL CURVES FOR
U.S. CONSUMERS
$50,000
Average per-household expenditures on rented dwellings, health care, and entertainment are plotted as
functions of annual income.
Health care and entertainment are normal goods, as
expenditures increase with
income. Rental housing, however, is an inferior good for
incomes above $30,000.
$40,000
$30,000
$20,000
$10,000
$0
$500
$1000 $1500 $2000 $2500 $3000 $3500 $4000 $4500 $5000
Annual Expenditure
Entertainment
Rented Dwelling
Health Care
Substitutes and Complements
The demand curves that we graphed in Chapter 2 showed the relationship
between the price of a good and the quantity demanded, with preferences,
income, and the prices of all other goods held constant. For many goods,
demand is related to the consumption and prices of other goods. Baseball bats
and baseballs, hot dogs and mustard, and computer hardware and software are
all examples of goods that tend to be used together. Other goods, such as cola
and diet cola, owner-occupied houses and rental apartments, movie tickets and
videocassette rentals, tend to substitute for one another.
Recall from Section 2.1 (page 22) that two goods are substitutes if an increase
in the price of one leads to an increase in the quantity demanded of the other.