(8th edition) (the pearson series in economics) robert pindyck, daniel rubinfeld microecon 145
Bạn đang xem bản rút gọn của tài liệu. Xem và tải ngay bản đầy đủ của tài liệu tại đây (116.35 KB, 1 trang )
120 PART 2 • Producers, Consumers, and Competitive Markets
Clothing
(units per
month)
R
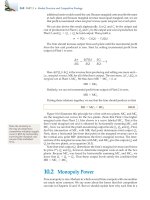
F IGURE 4.6
INCOME AND SUBSTITUTION
EFFECTS: NORMAL GOOD
A decrease in the price of food has both an income effect and a substitution effect. The consumer is initially at A, on budget line RS. When
the price of food falls, consumption increases
by F1F2 as the consumer moves to B. The substitution effect F1E (associated with a move from
A to D) changes the relative prices of food and
clothing but keeps real income (satisfaction)
constant. The income effect EF2 (associated
with a move from D to B) keeps relative prices
constant but increases purchasing power. Food
is a normal good because the income effect EF2
is positive.
A
C1
B
C2
D
U2
U1
O
F1
E
Substitution
Effect
S
F2
Income
Effect
T
Food
(units per
month)
Total Effect
In §3.4, we show how information about consumer
preferences is revealed by
consumption choices made.
Now let’s see what happens if the price of food falls, causing the budget line
to rotate outward to line RT. The consumer now chooses the market basket at
B on indifference curve U2. Because market basket B was chosen even though
market basket A was feasible, we know (from our discussion of revealed preference in Section 3.4) that B is preferred to A. Thus, the reduction in the price of
food allows the consumer to increase her level of satisfaction—her purchasing
power has increased. The total change in the consumption of food caused by the
lower price is given by F1F2. Initially, the consumer purchased OF1 units of food,
but after the price change, food consumption has increased to OF2. Line segment
F1F2, therefore, represents the increase in desired food purchases.
Substitution Effect
• substitution effect
Change in consumption of a
good associated with a change
in its price, with the level of
utility held constant.
The drop in price has both a substitution effect and an income effect. The
substitution effect is the change in food consumption associated with a change in the
price of food, with the level of utility held constant. The substitution effect captures
the change in food consumption that occurs as a result of the price change that
makes food relatively cheaper than clothing. This substitution is marked by a
movement along an indifference curve. In Figure 4.6, the substitution effect can
be obtained by drawing a budget line which is parallel to the new budget line
RT (reflecting the lower relative price of food), but which is just tangent to the
original indifference curve U1 (holding the level of satisfaction constant). The
new, lower imaginary budget line reflects the fact that nominal income was
reduced in order to accomplish our conceptual goal of isolating the substitution effect. Given that budget line, the consumer chooses market basket D and
consumes OE units of food. The line segment F1E thus represents the substitution effect.
Figure 4.6 makes it clear that when the price of food declines, the substitution
effect always leads to an increase in the quantity of food demanded. The explanation lies in the fourth assumption about consumer preferences discussed in