(8th edition) (the pearson series in economics) robert pindyck, daniel rubinfeld microecon 146
Bạn đang xem bản rút gọn của tài liệu. Xem và tải ngay bản đầy đủ của tài liệu tại đây (119.4 KB, 1 trang )
CHAPTER 4 • Individual and Market Demand 121
Section 3.1—namely, that indifference curves are convex. Thus, with the convex
indifference curves shown in the figure, the point that maximizes satisfaction on
the new imaginary budget line parallel to RT must lie below and to the right of
the original point of tangency.
Income Effect
Now let’s consider the income effect: the change in food consumption brought
about by the increase in purchasing power, with relative prices held constant. In
Figure 4.6, we can see the income effect by moving from the imaginary budget
line that passes through point D to the parallel budget line, RT, which passes
through B. The consumer chooses market basket B on indifference curve U2
(because the lower price of food has increased her level of utility). The increase
in food consumption from OE to OF2 is the measure of the income effect, which
is positive, because food is a normal good (consumers will buy more of it as their
incomes increase). Because it reflects a movement from one indifference curve
to another, the income effect measures the change in the consumer’s purchasing power.
We have seen in Figure 4.6 that the total effect of a change in price is given
theoretically by the sum of the substitution effect and the income effect:
• income effect Change in
consumption of a good resulting
from an increase in purchasing
power, with relative prices held
constant.
Total Effect (F1F2) = Substitution Effect (F1E) + Income Effect (EF2)
Recall that the direction of the substitution effect is always the same: A decline
in price leads to an increase in consumption of the good. However, the income
effect can move demand in either direction, depending on whether the good is
normal or inferior.
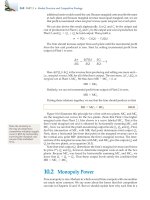
A good is inferior when the income effect is negative: As income rises, consumption falls. Figure 4.7 shows income and substitution effects for an inferior
good. The negative income effect is measured by line segment EF2. Even with
Clothing
(units per
month)
R
• inferior good A good that
has a negative income effect.
F IGURE 4.7
INCOME AND SUBSTITUTION
EFFECTS: INFERIOR GOOD
A
B
U2
D
U1
O
F1
F2
Substitution
Effect
Total Effect
E
S
Income
Effect
Food
T
(units per
month)
The consumer is initially at A on budget line RS.
With a decrease in the price of food, the consumer moves to B. The resulting change in food
purchased can be broken down into a substitution effect, F1E (associated with a move from A
to D), and an income effect, EF2 (associated with
a move from D to B). In this case, food is an inferior good because the income effect is negative.
However, because the substitution effect exceeds
the income effect, the decrease in the price of
food leads to an increase in the quantity of food
demanded.