Báo cáo khoa học: Interaction of G-rich GT oligonucleotides with nuclearassociated eEF1A is correlated with their antiproliferative effect in haematopoietic human cancer cell lines potx
Bạn đang xem bản rút gọn của tài liệu. Xem và tải ngay bản đầy đủ của tài liệu tại đây (405 KB, 12 trang )
Interaction of G-rich GT oligonucleotides with nuclearassociated eEF1A is correlated with their antiproliferative
effect in haematopoietic human cancer cell lines
Bruna Scaggiante1, Barbara Dapas1, Gabriele Grassi2 and Giorgio Manzini1
1 Department of Biochemistry, Biophysics and Macromolecular Chemistry, University of Trieste, Italy
2 Department of Clinical, Morphological, and Technological Sciences, Division of Internal Medicine, University of Trieste, Italy
Keywords
aptamers; CCRF-CEM; cell growth
inhibition; eEF1A; G-rich GT oligonucleotides
Correspondence
B. Scaggiante, Molecular Biology Section,
Department of Biochemistry, Biophysics and
Macromolecular Chemistry, via Giorgeri, 1,
34127-Trieste, Italy
Fax: +39 040558 3691
Tel.: +39 040558 3678
E-mail:
(Received 30 August 2005, revised 12 January 2006, accepted 18 January 2006)
doi:10.1111/j.1742-4658.2006.05143.x
G-rich GT oligonucleotides with a different content of G clusters have
been evaluated for their ability to exert cytotoxicity and to bind to
nuclear-associated proteins in T-lymphoblast CCRF-CEM cells. Only the
oligomers that did not form G-based structures or had a poor structure,
under physiological conditions, were able to exert significant cellular
growth inhibition effect. The cytotoxicity of these oligomers was related
to their binding to the nuclear-associated eEF1A protein, but not to the
recognition of nucleolin or other proteins. In particular, GT oligomers
adopting a conformation compatible with G-quadruplex, did not exert
cytotoxicity and did not bind to eEF1A. The overall results suggest that
the ability of oligomers to adopt a G-quadruplex-type secondary structure
in a physiological buffer containing 150 mm NaCl is not a prerequisite
for antiproliferative effect in haematopoietic cancer cells. The cytotoxicity
of G-rich GT oligomers was shown to be tightly related to their binding
affinity for eEF1A protein.
Single-stranded DNA may act as aptamer in recognizing proteins with an affinity similar to or higher than
that of antibodies [1]. Novel strategic applications of
aptameric single-stranded DNA encompass probes for
protein localization [1], therapeutic oligomers [2–4] and
microarrays of proteins [5].
Among oligomers able to adopt structures that are
recognized by specific proteins, there are those with a
high G content. Within eukaryotic cells, G-rich singlestranded structures appear to be involved in senescence
and aging by affecting telomere structure [6]. Chromosomes end with a G-rich single-stranded overhang,
which is able to adopt a four-stranded G-quadruplex
structure that is a poor substrate for telomerase and
can be stabilized by ligands. One of these, telomestatin,
stabilizes G-quadruplexes, thus inhibiting telomerase
activity [7]. Moreover, a human protein named translin
was recently shown to stimulate telomerase activity by
specifically binding to the G-rich Tetrahymena and
human telomeric repeats [8]. Furthermore, the forma-
tion of G-quadruplex structures is thought to contribute to nonantisense effects by their ability to bind to
cellular proteins [9,10]. In particular, some protein targets of these G-rich oligonucleotides have been identified as nucleolin and a helicase [10,11].
Other proteins able to bind to G-quadruplex structures have been recently discovered. For example, it
has been demonstrated that the human ribosomal protein L7a interacts in vitro with a presumably G-rich
RNA structure [12]. G-quartet-forming oligodeoxynucleotides interacting with the SH2 domain of Stat3,
a protein encoded by a proto-oncogene that is activated in many human cancer cells, represent a novel class
of aptameric therapeutic agents for the treatment of
metastasis in cancer [13]. Stat3 mediates upregulation
of bcl-x and mcl-1 gene expression and thus cell proliferation [14].
GT oligomers have been demonstrated to exert a
specific, dose-dependent growth inhibition effect on
a variety of human cancer cell lines [15–17]. The
Abbreviations
CRC, cytotoxicity-related complex; eEF1A, Elongation Factor 1 A.
1350
FEBS Journal 273 (2006) 1350–1361 ª 2006 The Authors Journal compilation ª 2006 FEBS
B. Scaggiante et al.
GT oligonucleotides, eEF1A and antiproliferative effect
resultant cytotoxicity was tightly related to the aptameric behaviours of these GTs and in particular to
their ability to specifically bind to nuclear proteins
forming a major cytotoxicity-related complex (CRC)
of apparent molecular mass 45 ± 7 kDa [15–20].
Recently, a component of this complex has been isolated from the nuclear enriched fraction of haematopoietic cancer cell lines and identified as the eukaryotic
Elongation Factor 1 A (eEF1A) [21]. Factors involved
in the translation of mRNA are known to contribute
to development of cancer [22,23].
It has been reported that the GT sequences with a
G-rich content can exert antiproliferative effects and
display aptameric properties by binding to nucleolin
[10] or to SV40 large T antigen helicase [11]. Moreover
G-quartet-forming GTs have been shown to bind to
Stat3 and to induce tumour cell apoptosis [13]. Here,
we wish to elucidate if GT oligomers with a G-rich
content can exert their antiproliferative activity in
human T-lymphoblast cancer cells and if they bind to
eEF1A protein.
Results
The GT sequences are listed in Table 1. The 27-mer GT
was the reference oligomer able to exert cytotoxicity
and displaying the specific protein binding activities
[15–21]. Starting from the GT and GT-G4 sequences,
the following oligomers were planned in order to contain different clusters of G: GT-G1 has one cluster of
four guanines, GT-G2 has two clusters of four guanines, GT-G3 has one cluster of seven guanines and
one of four guanines. The human T-lymphoblast
CCRF-CEM cell line was used to perform the analysis,
being the reference cells extensively used in previous
works on GT oligomers and their protein interactors
[15–21].
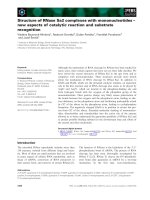
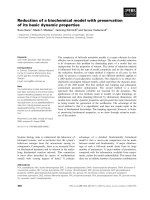
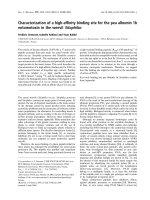
The electrophoretic mobility of these oligomers
under native and denaturing conditions is illustrated in
Fig. 1. To evidence different conformations the oligomers were labelled at their 5¢-end by [32P]dATP[cP].
Figure 1A shows that under denaturing conditions, all
Table 1. Oligonucleotide sequences and names.
Sequence
Name
Length
(-mer)
5¢-TGTTTGTTTGTTTGTTTGTTTGTTTGT-3¢
5¢-TGGTGTGTGTGGGGTGGTTGGTG-3¢
5¢-TGGGGTGTGTGGGGTGGTTGGTG-3¢
5¢-TGGGGTGTGTGGGGGGGTTGGTG-3¢
5¢-TGGTTGGGGTGGGGGGGGGGGTG-3¢
GT
GT-G1
GT-G2
GT-G3
GT-G4
27
23
23
23
23
oligomers migrate according to their lengths. It was
previously demonstrated that GT does not fold into
intra- or intermolecular structures and thus it migrates
according to its length also in native conditions [18].
Figure 1B shows the migrations in native conditions of
the oligomers denatured and renatured overnight in a
buffer with salt composition similar to that of the
extracellular medium. With respect to the unstructured
GT, GT-G1 does not appear to form significant interor intramolecular structures, the electrophoretic mobility being in accord with its length. GT-G2 shows a
band migrating on the basis of its length, and a
slightly slower nonresolved migrating band that might
be due to a dynamic interconversion with a bimolecular structure. GT-G3 can form an intermolecular
structure of higher order demonstrated by the slowly
migrating band, albeit a major band corresponding to
its length was also present. GT-G4 was shown to
fold into an intramolecular structure (the faster migrating band), and to associate into an intermolecular one
(the slower migrating band). Analogous results were
obtained when the oligomers were renatured in a
potassium phosphate buffer similar to the intracellular
medium (data not shown).
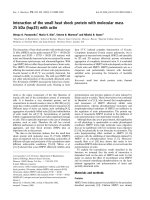
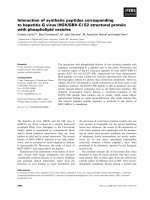
To test the effect of these oligomers on cellular
growth we performed a cytotoxicity assay. The oligomers were applied to human lymphoblast CCRFCEM cells in serum-containing medium and cell
growth was evaluated after 72 h without changing
the medium [15]. As illustrated in Fig. 2, GT-G1 and
GT-G2 caused a reduction of cell growth at a level
comparable to that of GT, showing almost complete
inhibition at 15 lm. This effect was cytotoxic, as previously demonstrated for GT [15], as no recovery of
cell growth was observed by prolonging cell culture
for up to a further 4 days (data not shown). GT-G3
showed a moderate effect, giving not more than 50%
of cell growth inhibition at the highest dose (15 lm),
probably due to a cytostatic effect as shown by the
absence of cellular debris by microscope observation.
On the contrary, no cell growth inhibition effect was
observed for GT-G4.
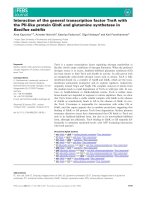
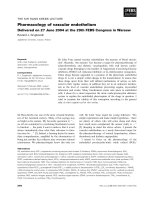
The ability of these sequences to bind to proteins
forming the CRC of 45 ± 7 kDa was checked by UV
cross-linking assays in competition experiments. As
illustrated in Fig. 3A, the nonlabelled GT-G1, GT-G2
and GT-G3 were able to displace the labelled GT
from binding to the CRC (white arrow) in the order
GT-G1 > GT-G2 > GT-G3 (lanes 3, 4, 5). GT-G3
(lane 5) was the least efficient in acting as competitor
of GT, in agreement with the fact that it displayed a
reduced cytotoxicity with respect to GT. All competitors were able to displace GT from the minor complex
FEBS Journal 273 (2006) 1350–1361 ª 2006 The Authors Journal compilation ª 2006 FEBS
1351
4
TG
G
TG
G
TG
G
TG
G
nt
G
T
4
3
TG
G
2
TG
G
1
TG
G
TG
G
T
G
nt
1
B
A
3
B. Scaggiante et al.
2
GT oligonucleotides, eEF1A and antiproliferative effect
45
45
30
30
25
20
25
10
20
10
Fig. 1. Denaturing and native electrophoresis of G-rich GT oligomers. (A) Denaturing electrophoresis. Five micrograms of oligomers were
denatured by heating at 95 °C for 10 min in 7 M urea and then cooled on ice. The samples were then loaded onto a 20% polyacrylamide gel
in 0.1 M sodium acetate ⁄ acetic acid buffer pH 5.0, containing 7 M urea. The gel was run in 0.1 M sodium acetate ⁄ acetic acid buffer pH 5.0,
at 42 °C at 15 VỈcm)1. The gel was stained by 0.01% Stainsall dye in 50% formamide (v ⁄ v). The nucleotide length markers are noted on the
left (nt). (B) Native electrophoresis. The oligomers were 5¢-end labelled by using [32P]dATP[cP] polynucleotide kinase as described in Experimental procedures. One microgram of unlabelled oligomers and about 1 ng of corresponding labelled ones adjusted to a specific activity of
15 000 cpm, were added together in a total volume of 10 lL in 150 mM NaCl, 10 mM K2HPO4 ⁄ KH2PO4, 1 mM EDTA pH 7.0. The samples
were denatured by heating at 95 °C for 5 min and then slowly cooled overnight at room temperature. After adding 3 lL of 50% glycerol in
TBE buffer, the samples were loaded onto 20% polyacrylamide gel in TBE buffer and run at 10 VỈcm)1, at 4 °C. The gel was fixed in 10%
acetic acid, dried and then exposed to X-LS Kodak film. The nucleotide length markers are noted on the left (nt).
of 100 kDa (black arrow). Self-competition of GT was
reported as reference (lane 2).
On the contrary, GT-G4 did not displace GT from
the CRC (lane 6). This evidence was in agreement with
the finding that GT-G4 did not exert any growth inhibition effect. It was able to displace the GT oligomer
only from the minor 100-kDa complex probably
formed with nucleolin [21]. In fact, nucleolin was previously found to recognize the structured GT-G4
oligomer and to form with it the 100-kDa complex
[21]. Figure 3B shows the binding of labelled oligomers
to the nuclear-enriched fraction of proteins. The efficiency of labelling of the single oligomers being not
homogenous, the ratios of the different binding signals
within each lane instead of their absolute values have
to be considered. It can be seen that GT is present
mainly in the CRC and in a minor complex of about
1352
100 kDa, but that GT-G1, GT-G2 and GT-G3 can
form in addition to the CRC (white arrow) and the
100-kDa complex (black arrow), analogously to GT, a
complex of about 70 kDa also. Moreover, the G-rich
oligomers produced a band of about 26 kDa, due to a
nonspecific protein binding previously described, probably derived from a cytoplasmic contaminant [15]. The
ratios of oligomer bound in the CRC to that bound
in the 70-kDa complex estimated for each lane by
phosphoimager was shown to be 0.38, 0.37, 0.19, for
GT-G1, GT-G2, GT-G3, respectively. This may
explain why GT-G3 exerted a reduced antiproliferative
activity, i.e. by its preferential binding to other proteins. On the contrary, GT-G4 did not form the CRC,
whereas it was found to produce the 70-kDa and the
100-kDa complexes, that therefore cannot be involved
in the cell growth inhibition effect. Thus, the lack of
FEBS Journal 273 (2006) 1350–1361 ª 2006 The Authors Journal compilation ª 2006 FEBS
GT oligonucleotides, eEF1A and antiproliferative effect
120
A
Competitor
–
G
T
G
TG
G 1
TG
G 2
TG
G 3
TG
4
B. Scaggiante et al.
kDa
119
% of cellular growth
100
GT
80
76
GT-G1
60
GT-G2
47
GT-G3
40
29
GT-G4
20
15
ODN concentration
(µM)
B
Labelled oligomer
3
4
5
6
TG
G 1
TG
G 2
TG
G 3
TG
4
10
T
5
G
0
2
G
1
0
kDa
119
Fig. 2. Cytotoxicity of G-rich GT oligomers. CCRF-CEM cells
(5 · 103) in exponential growth phase were seeded in triplicate in
200 lL of serum-containing medium in a 96-well microtiter plate.
After overnight incubation, the oligomers were directly added to
the cell medium at the indicated concentrations. Cell growth was
evaluated 72 h after oligonucleotide addition by incorporation of
0.5 mgỈmL)1 of MTT, as described in Experimental procedures. The
percentage cell growth was calculated by taking growth of an
internal nontreated control as 100%. The results are mean ± SD of
5–10 independent experiments.
formation of the CRC agrees with the absence of cell
growth inhibition by GT-G4.
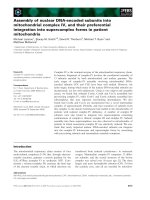
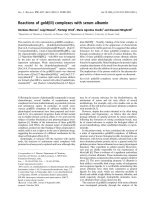
By affinity chromatography, using a GT biotinylated
51-mer, the proteins interacting with GT were isolated
from the pool of nuclear-enriched fraction and used to
perform competition experiments by UV crosslinking
assays. Figure 4 shows a western blot of the total nuclear extracts used for the affinity chromatography with
antinucleolin and anti-eEF1A antibodies. It is evident
that at the level of eEF1A recognition no nucleolin
fragments are present. This excludes interference from
possible proteolytic fragments of nucleolin to the GT
oligomer binding at the level of the eEF1A band. As
illustrated in Fig. 4B, the isolated proteins formed two
complexes with GT (lane 1): the most abundant, compatible with the binding of eEF1A in the CRC (white
arrow), the other of apparent molecular mass of about
100 kDa compatible with binding to nucleolin (black
arrow). The competition experiments in UV cross-linking assays with the GT-recognizing proteins confirmed
the results obtained with the total nuclear-enriched proteins: a decreasing ability from GT-G1 (lane 3) to GTG3 (lane 5) to displace GT from the CRC and a lack
of competition by GT-G4 (lane 6). Competition by
76
47
29
1
2
3
4
5
Fig. 3. Binding of the G-rich GT oligomers to total nuclear proteins.
(A) Competition of binding to GT. Three micrograms of total
nuclear CCRF-CEM cell extract were incubated with 2 ng of 5¢-end
32
P-labelled GT in buffer C in the presence of the nonspecific competitors (1 lg salmon sperm DNA, 1 lg of CT oligomer) and in the
absence or in the presence of the indicated specific competitors
added at 1000-fold molar excess. After 30 min incubation at room
temperature, the samples were exposed to UV light for 10 min and
then denatured by adding SDS ⁄ PAGE loading buffer and boiling the
samples. The samples were loaded onto an SDS ⁄ PAGE gel (10%
acrylamide) and run at 15 VỈcm)1. The gel was dried and exposed
to X-AR Kodak film. The black arrow indicates the 100-kDa complex; the white arrow indicates the 45 ± 7-kDa complex (CRC). (B)
UV crosslinking of G-rich GT oligomers. Three micrograms of total
nuclear extract of CCRF-CEM cells were incubated in buffer C in
the presence of 2 ng of the indicated 5¢-end 32P-labelled G-rich GT
oligomers and with 1 lg salmon sperm DNA and 1 lg of CT oligomer as nonspecific competitors. After 30 min incubation at room
temperature, the samples were exposed to UV light for 10 min and
then denatured by adding SDS ⁄ PAGE loading buffer and boiling the
samples. The samples were loaded onto an SDS ⁄ PAGE gel (10%
acrylamide) and run at 15 VỈcm)1 2 ng of 5¢-end 32P-labelled GT
sample were included as reference (lane 1). The gel was dried and
exposed to X-LS Kodak film. The black arrow indicates the 100-kDa
complex; the white arrow indicates the CRC.
FEBS Journal 273 (2006) 1350–1361 ª 2006 The Authors Journal compilation ª 2006 FEBS
1353
GT oligonucleotides, eEF1A and antiproliferative effect
αn
u
cl
e
αe olin
EF
1A
A
B. Scaggiante et al.
116 kDa
85
47
36
kDa
116
G
TG
G 1
TG
4
Competitor
--
B
2
G
T
G
TG
G 1
TG
G 2
TG
G 3
T-- G4
1
66
45
29
1
2
3
4
5
C
6
7
66 kDa
WB:αeEF1A
45 kDa
1
2
Fig. 4. (A) Western blotting of nuclear extract with anti-eEF1A and anti-nucleolin IgG. Twenty micrograms of nuclear extract were separated
by SDS ⁄ PAGE (12% acrylamide) and then blotted onto a 0.22-lm nitrocellulose membrane as described in Experimental procedures. The
blotted membrane was blocked with 3% nonfat dried milk in NaCl ⁄ Pi and incubated with eEF1A (lane 2) or nucleolin (lane 1) mAb
(1 lgỈmL)1) in NaCl ⁄ Pi, overnight, at 4 °C with constant rocking. After washing, the membrane was incubated for 1.5 h with a horseradish
peroxidase-conjugated anti-mouse IgG secondary antibody, then rinsed once with NaCl ⁄ Pi containing 0.05% Tween-20 and four times with
deionized water. The blot was developed as described in Experimental procedures. (B) Binding of G-rich GT to affinity-purified proteins: (left)
3.5 lL of proteins purified by affinity chromatography as described in Experimental procedures were incubated in 10 lL buffer C containing
2 ng of 5¢-end 32P-labelled GT and in the presence or in the absence of the indicated specific competitors added at 500-fold molar excess,
or (right) in 10 lL buffer C containing 2 ng of the indicated 5¢-end 32P-labelled oligomers without specific competitors. After 30 min incubation at room temperature, the samples were crosslinked by exposure to UV light for 10 min, denatured by adding SDS ⁄ PAGE loading buffer
and boiling. The samples were loaded onto 10% SDS ⁄ PAGE and run at 15 VỈcm)1. The gel was dried and exposed to X-AR Kodak film. The
black arrow indicates the 100-kDa complex; the white arrow indicates the CRC. (C) Western blotting of the affinity-purified proteins with
anti-eEF1A. Thirty micrograms of affinity purified proteins (lane 1) or 7.5 lg total nuclear proteins (lane 2) were separated by SDS ⁄ PAGE
(12% acrylamide) and then blotted onto a 0.22 lm nitrocellulose membrane as described in Experimental procedures. The blotted membrane
was blocked with 3% nonfat dried milk in NaCl ⁄ Pi and incubated with eEF1A mAb (1 lgỈmL)1) in NaCl ⁄ Pi overnight, at 4 °C with constant
rocking. The blot was developed as described in (A).
nonlabelled GT is shown as reference (lane 2). Moreover, full ability to compete in the binding to the higher
molecular weight protein (i.e. nucleolin; black arrow)
1354
was observed for all G-rich oligomers. In panel B
at right it can be observed that GT-G1 formed both
complexes, whereas GT-G4 formed only the 100 kDa
FEBS Journal 273 (2006) 1350–1361 ª 2006 The Authors Journal compilation ª 2006 FEBS
B. Scaggiante et al.
A
Labelled oligomer
1
-
2.
5
5. µL
0
10 µL
2. µL
5
5. µL
0
10 µL
µ
- L
--
eEF1A protein
GT
GT-G4
2 3 4 5
6 7 8
G
Competitor
eEF1A protein
T
G
TG G1
T
G -G2
T
G -G3
TG
– 4
B
–
complex. The presence of eEF1A in the purified protein
mix was confirmed by western blotting with the specific
antibody (Fig. 4C, lane 1). The eEF1A protein from
total nuclear extract is shown as control in lane 2.
To test the binding abilities of the oligomers toward
the isolated protein, eEF1A was excised from
Coomassie-stained gel and recovered as previously
demonstrated [21]. Figure 5 illustrates EMSA and UV
cross-linking assays with purified eEF1A. Figure 5A
shows that in the absence of competition the noncytotoxic oligomer GT-G4 was found to bind very faintly
to eEF1A, also with addition of increasing amounts of
protein (lanes 2–4). In contrast, labelled GT was found
to bind with stronger affinity to eEF1A in a manner
directly proportional to protein quantities (lanes 5–7).
The presence of a minor slower migrating band in lanes
5–7 might be due to a complex of higher molecularity.
The slightly faster mobility of the complex between
GT-G4 and eEF1A (lanes 2–4) is probably accounted
for by the difference in length and thus in migration of
the free oligomer (lane 1 vs. lane 8). Moreover, it seems
conceivable that GT-G4, forming the G-quartet structure, gave a more compact (i.e. faster) complex than
that generated by the nonstructured GT.
Figure 5B shows competition experiments performed
with the isolated eEF1A in UV cross-linking assays.
GT-G1 (lane 3) and, to a lesser extent, GT-G2 (lane 4)
were able to displace GT from eEF1A. GT-G3 (lane
5) and GT-G4 (lane 6) resulted inefficient in producing
competition. On the left the western blot with the antieEF1A antibody of the protein recovered from the gel
band is shown.
To completely elucidate the relationship between the
structure of the GTs and their ability to inhibit cell
growth by forming the CRC, we performed CD at
37 °C. As a control we used two oligomers, GRO29A
and GRO26A, whose structures were related to antiproliferative activity in tumour cells [10]. As illustrated
in Fig. 6A, the weak CD bands of GT and GT-G1
indicate absence of appreciable secondary structure at
37 °C, under conditions similar to those of the extracellular medium. The spectra of GT-G2 and GRO29A
showed a small band at 263 nm, suggesting the formation of a limited structure. GT-G3 was found to give a
peak at 263 nm compatible with G-quartet structure.
However, no full structure in the G-quadruplex was
detected as shown by the low intensity of the 263-nm
band. A clear structure formation was found for
GRO26A and GT-G4: a positive peak at 263 nm and
a negative one at 242 nm. These CD spectra were
compatible with parallel G-quadruplex. Moreover,
GRO26A showed a slight signal at 295 nm that might
be related to a minor amount of antiparallel G-quad-
GT oligonucleotides, eEF1A and antiproliferative effect
+
+
+ + + + –
kDa
116
79
46
31
47 kDa
WB:αeEF1A
α
1 2
3
4
5
6
7
Fig. 5. Binding of G-rich GTs to eEF1A protein. The eEF1A protein
was purified from a Coomassie blue-stained gel, as described in
Experimental procedures. (A) Band-shift assay. From 2.5 to 10 lL
of the isolated eEF1A protein were incubated with 1 ng of 5¢-end
32
P-labelled GT-G4 (lanes 1–4) or 1 ng of 5¢-end 32P-labelled GT
(lanes 5–8) in 25 mM Tris ⁄ HCl pH 8.0, containing 0.05% SDS,
0.05 mgỈmL)1 BSA, 0.1 mM EDTA, 1.25% glycerol and 0.1 M NaCl,
for 30 min at room temperature. The samples were then loaded
onto 8% polyacrylamide in TBE buffer and run at 20 VỈcm)1 at
4 °C. The gel was then dried and exposed to X-AR Kodak film. (B)
UV cross-linking assay. Ten microlitres of the isolated eEF1A protein were incubated in buffer C with 1 ng of 5¢-end 32P-labelled GT
in the presence or absence of the indicated specific nonlabelled
competitors added at 10-fold molar excess. After 30 min incubation
at room temperature, the samples were exposed to UV light for
10 min, denatured by adding SDS ⁄ PAGE loading buffer and boiling.
The samples were separated by SDS ⁄ PAGE (12% acrylamide) and
run at 10 VỈcm)1. The gel was then dried and exposed to X-AR Kodak film. On the left is shown western blotting of 50 lL of the
recovered protein performed after SDS ⁄ PAGE (12% acrylamide)
with an anti-eEF1A mAb as described in Experimental procedures.
ruplex. The CD spectra of GRO29A and GRO26A
agree with their electrophoretic mobilities under nondenaturing conditions: GRO29A, forming a poor
FEBS Journal 273 (2006) 1350–1361 ª 2006 The Authors Journal compilation ª 2006 FEBS
1355
GT oligonucleotides, eEF1A and antiproliferative effect
A
B. Scaggiante et al.
8
GT
GT-G1
GT-G2
GT-G3
GT-G4
GRO26A
GRO29A
5
CD[mdeg]
0
-3
220
B
7
6
240
260
280
300
Wavelength [nm]
320
GRO26A
4
CD[mdeg] 2
0
-2
220
240 260 280 300
Wavelength [nm]
320
8
20ºC
37ºC
50ºC
65ºC
80ºC
100ºC
20ºC, H2O
65ºC, H2O
GT-G4
5
CD[mdeg]
0
-4
220
240 260 280 300
Wavelength [nm]
320
structure, was found to run on the basis of its length,
whereas GRO26A, demonstrating a full G-based structure, showed a fast and a slow migrating band similarly to GT-G4 (data not shown). Figure 6B illustrates
the stability of GRO26A and GT-G4: these structures
were not disrupted by increasing the temperature to
90 °C. They showed CD spectra indicative of absence
of structure only when they were resuspended in water
and heated at 65 °C (dashed green spectrum). On the
contrary, the structure of GT-G3 was not so stable
and it was disrupted by increasing the temperature to
65 °C (data not shown). The effect of GRO29A and
GRO26A on CCRF-CEM cell growth is shown in
Fig. 7A: in accordance with previous data, we found
1356
Fig. 6. Circular dichroism of oligomers.
(A) A 10 lM solution of the indicated
oligomer was diluted in renaturation buffer
(150 mM NaCl, 10 mM K2HPO4 ⁄ KH2PO4,
1 mM EDTA pH 7.0) to a final concentration
of 0.5 lM recording the spectra at 37°C as
described in Experimental procedures. (B)
GRO26A and GT-G4 were diluted to 0.5 lM
final concentration in water and the spectra
were recorded at the indicated temperatures.
that GRO29A exerted a significant growth inhibition
effect, similar to GT, whereas the G-quartet forming
GRO26A did not alter cellular growth, similar to GTG4. Moreover, as illustrated in Fig. 7B, GRO29A
(lane 4) was able to compete in the binding to specific
nuclear proteins (CRC) as did GT (lane 3). On the
contrary, no competition was observed using GRO26A
(lane 5).
Discussion
A series of guanosine-rich phosphodiester oligodeoxynucleotides strongly inhibits proliferation in a number
of human tumour cell lines and the presence of
FEBS Journal 273 (2006) 1350–1361 ª 2006 The Authors Journal compilation ª 2006 FEBS
B. Scaggiante et al.
GT oligonucleotides, eEF1A and antiproliferative effect
100
80
60
40
20
4
TG
GT
GR
O
GR 29A
O2
6A
G
G
RO
26
A
G
RO
29
G
B
A
0
T
% of cellular growth
A
Competitor -- -Proteins
-- + + + +
116 kDa
70 kDa
46 kDa
32 kDa
23 kDa
1 2 3 4 5
Fig. 7. Cytotoxic assay of GRO26A and GRO29A and their binding
to nuclear proteins. (A) CCRF-CEM cells (5 · 103) in exponential
growth phase were seeded in triplicate in 200 lL of serum-containing medium in 96-well microtiter plates. After overnight incubation,
the oligomers were directly added to the cell medium at 10 lM
concentration. Cell growth was evaluated 72 h after oligonucleotide
addition by incorporation of 0.5 mgỈmL)1 of MTT, as described in
Experimental procedures. As reference oligomers GT and GT-G4
were used in the same experiment. (B) Two micrograms of total
nuclear proteins (lanes 2–5) were incubated with 2 ng of 5¢-end
32
P-labelled GT in buffer C in the presence of the nonspecific competitors (1 lg poly(dIdC) and 1 lg of CT oligomer) and with the
indicated specific competitors added at 500-fold molar excess
(lanes 3–5). After 30 min incubation at room temperature, the samples were cross-linked by UV exposure and then separated by
SDS ⁄ PAGE (12% acrylamide) as described in Experimental procedures. Reference lane 1 shows the migration of the free oligomer;
the open arrow shows the CRC.
G-quartets in the active oligonucleotides was found to
determine cell growth inhibition activity [10,13,14].
The G-rich oligonucleotides bind to specific cellular
proteins in both nuclear and cytoplasmic extracts and
to proteins derived from the plasma membrane, and
their biological activity correlates with binding to these
proteins. Strong evidence showed that one of these
proteins is nucleolin, a multifunctional phosphoprotein
whose levels are related to the rate of cell proliferation
in a variety of solid tumour cell lines [10]. The biological activity of the G-rich oligomers was found to be
associated with their ability to form stable G-quartetcontaining structures and with their binding to specific
cellular proteins, most likely nucleolin [10]. More
recently, the antiproliferative activity of G-rich oligonucleotides has been directly related to their inhibition
effect on DNA replication, resulting from negative
modulation of a helicase activity [11]. Independently,
other authors found that G-quartet-forming oligomers
bind to Stat3, a protein involved in tumour cell progression. The oligomers inhibited Stat3 binding to
DNA, thus blocking the transcription of Stat3-regulated genes and the progression of prostate and breast
cancers in mice [13].
Here we demonstrate that G-rich GT oligomers can
exert cytotoxicity on haematopoietic T-lymphoblast
CCRF-CEM cells only if the oligomers bind to nuclear
proteins forming the CRC, derived from eEF1A recognition. Similar results were confirmed in other cell lines
of haematopoietic tumour origin, such as Jurkat,
CEM-VLB, Raji, HL60, K562 (data not shown). The
cytotoxicity and the formation of the CRC with nuclear proteins seem related to the presence of oligomers
migrating according to their length, as demonstrated
by electrophoresis for GT-G1, GT-G2 and GT-G3.
GT-G4, demonstrating the formation of a full structure, did not form the CRC and did not exert any
appreciable growth inhibition effect on the tumour
cells. The nontoxic GT-G4 has 78% G-content, two
clusters of four and 11 consecutive Gs, and it appears
to form structure in native electrophoresis, probably as
a G-quadruplex. Our CD spectrum clearly indicates a
very stable G-quartet structure at physiological conditions. A melting curve, recorded at 295 nm, compatible
with the disruption of a G-quartet structure [10] was
also found for GT-G4 (data not shown). A NMR
study has shown that a DNA oligonucleotide containing different G clusters adopts an asymmetric bimolecular G-quadruplex structure in solution [24], and the
topology of this structure is distinct from the folds of
the closely related and well-characterized sequences
d(G4T4G4) and d(G3T4G3) [25]. Recently, the ability of
the G-rich oligomers to exert an antiproliferative effect
has been related to their binding to specific cellular
proteins, rather than to G-quadruplex formation [26].
The absence of cytotoxicity of GT-G4 appears not to
be related to a reduced intracellular accumulation of this
oligomer. In fact, the incorporation of 32P-labelled
oligomers into viable cells showed similar uptakes with
the only exception of GT-G4, whose internalization rate
was even higher (data not shown).
FEBS Journal 273 (2006) 1350–1361 ª 2006 The Authors Journal compilation ª 2006 FEBS
1357
GT oligonucleotides, eEF1A and antiproliferative effect
B. Scaggiante et al.
GT-G4, showing a G-quartet-based structure, did
not exert cytotoxic effects on haematopoietic cancer cell
lines, whereas the G-rich GT oligomer GRO29A was
successfully used by Bates to significantly inhibit the
growth of a variety of human cancer cells derived from
solid tumours [10]. The same author used as a control
GRO26A, that did not significantly alter cellular
growth. Accordingly with these authors, we found that
GRO29A exerted on CCRF-CEM cells a growth inhibition effect similarly to GT, whereas GRO26A did not
significantly alter cellular proliferation. On the
contrary, in our experimental conditions, which were
similar to those of the extracellular medium, the
CD spectra of GRO26A show that it formed a stable
G-quadruplex structure as GT-G4 did, whereas
GRO29A exhibited a CD indicative of a poor structure.
In experimental conditions similar to that of the intracellular medium (in 140 mm KCl containing buffer),
GRO29A did not show a CD spectrum diagnostic of
G-quartet-based structure (data not shown). In fact, the
spectra clearly show only minor differences with that
obtained in NaCl containing buffer, and this is indicative of a rather weak secondary structure. The apparent
discrepancy with literature results [10,26] can be
explained by the fact that the formation of G-quartet
based structures from a rather various repertoire often
implies rather long kinetic processes, depending on
molecularity, oligomer concentration, salt, temperature
of annealing, and frequently different coexisting competing forms. In particular GRO29A needs 56 h annealing at 60 °C in 140 mm KCl to assume a G-quartet
containing structure [26]. In agreement with our results,
competition experiments demonstrated that GRO29A
was able to displace the labelled oligomer from eEF1A,
similarly to GT, whereas GRO26 was not. Furthermore, in nondenaturing electrophoresis under our
experimental conditions GRO29A migrated mostly on
the basis of its length in accordance with other findings
[26], whereas GRO26A demonstrated the formation of
a full structure. Thus it seems likely that GRO29A can
exert a growth inhibition effect on human haematopoietic cancer cells because in physiological conditions it
does not significantly form G-quartets and can bind to
eEF1A. The binding of GRO29A to eEF1A was not
observed by Bates et al. [10] in solid tumour, but this
might be related to the absence in these cells of the
eEF1A isoforms that we identified in the haematopoietic cell line [21], or to the buffer conditions used for the
binding. Thus the G-quartet structure is clearly not a
prerequisite for the antiproliferative activity of G-rich
oligomers in haematopoietic cancer cells.
The toxic GT-G1 has 60% G content and only one
cluster of four guanines. It migrates on the basis of its
1358
length in electrophoresis, it was as cytotoxic as GT
and showed the formation of the CRC. GT-G2, with
65% G-content, demonstrated a very faint structure
and inhibited the cellular growth similarly to GT-G1.
GT-G3, which, with 69% content, assumed ) in
part ) intermolecular structures clearly related to the
increase in the number of Gs in the cluster (from four
in GT-G2 to seven in GT-G3), gave a reduced cellular
growth inhibition; accordingly, it showed a reduced
capacity to form CRC. The lower ability of GT-G2 to
compete for the binding of GT to eEF1A with respect
to GT-G1 both in total nuclear extract and in affinitychromatography-purified proteins does not agree with
cytotoxicity data, the two oligomers showing irrelevant
differences in growth inhibition. The overall results
suggest that the kinetics of binding of GT-G2 to
eEF1A might be slower with respect to that of GT-G1
explaining its reduced ability to displace GT from
the CRC and this might be related to the mild
grade of structure formation observed in its CD spectrum. However, it cannot be completely excluded that
GT-G1 and GT-G2 have a different in vivo intracellular localization, i.e. GT-G2 being predominately nuclear in localization with respect to GT-G1, thus taking
into account the different binding ability vs. the same
cytotoxicity. Although a different intracellular localization could explain differences in antiproliferative effect,
the protein binding ability suggests that the biological
activity of the G-rich GT oligomers is related to their
recognition of nuclear-associated eEF1A. Furthermore,
all of the oligomers were able to displace GT from
nucleolin (the complex of highest molecular weight),
both in assays with total nuclear extract and with
affinity chromatography purified proteins, but not all
were able to exert cell growth inhibition. Thus it seems
unlikely that nucleolin is related to the antiproliferative
effect exerted by G-rich GTs. Moreover, the oligomers
that did not bind to eEF1A, such as GT-G4, did not
exert growth inhibition.
It is interesting to note that GT-G1 recognizes also
another nuclear protein, forming a complex of 70 kDa,
just as GT-G2, GT-G3 and GT-G4. This complex is
unlikely to involve already described proteins such as
Stat3 [14] or a helicase [11], whose molecular masses
are 80 and 124 kDa, respectively. The formation of
this complex clearly suggests that these G-rich
oligomers target other proteins that GT does not
engage, but this fact is not related to the cytotoxic
effect. Moreover, the binding of the G-rich oligomers
GT-G1, GT-G2, GT-G3 and GT-G4 to proteins forming the 70-kDa complex might be due to the interaction with a proteolytic fragment of nucleolin observed
by Bates [10] as well as by us (Fig. 4A). This agrees
FEBS Journal 273 (2006) 1350–1361 ª 2006 The Authors Journal compilation ª 2006 FEBS
B. Scaggiante et al.
with the observation that the nontoxic GT-G4 forms
the two complexes of 100 kDa and of 70 kDa, both
compatible with nucleolin recognition. The possibility
that a 48-kDa fragment of nucleolin [27] could be a
major contaminant of eEF1A protein can be excluded
by MALDI TOF analysis of the Coomassie blue band
extract [21] and by the absence of a corresponding
nucleolin signal in western-blotting of our nuclear
extracts (Fig. 4A).
Thus these results indicate that in haematopoietic
cancer cells G-rich GT oligomers exert a growth inhibition effect by binding to nuclear-associated eEF1A
protein and this effect is inversely related to the ability
of oligomers to adopt G-quartet structures in physiological conditions.
Experimental procedures
Oligonucleotide sequences
HPLC-purified phosphodiester oligomers were from MWGBiotech AG (Ebersberg, Germany). The oligomers were
resuspended in physiological solution at 1000 lm stock
solution and sterilized by centrifugation in 0.2 lm filter
spin-X tubes.
Native and denaturing electrophoresis
The oligomers (5 lg) were denatured by heating at 95 °C
for 10 min and supplemented with 7 m urea. The samples
were loaded onto 20% polyacrylamide gel (acrylamide:bisacrylamide, 29 : 1 w ⁄ w) in 0.1 m acetic acid, pH 5.0,
10 mm NaCl, 10 mm MgCl2 containing 7 m urea. The gel
was run in 0.1 m acetic acid, pH 5.0, at 10 VỈcm)1 for 2.5 h
at 42 °C. In nondenaturing conditions, the oligomers (5 lg)
were denatured by heating at 95 °C for 10 min and renatured in 150 mm NaCl, 10 mm K2HPO4 ⁄ KH2PO4, 1 mm
EDTA, pH 7.0, by slowly cooling at room temperature
overnight. The samples were then electrophoresed through
20% polyacrylamide gel (acrylamide:bisacrylamide, 29 : 1
w ⁄ w) in TBE buffer (0.09 m Tris ⁄ borate, pH 8.0, 2 mm
EDTA) at 5 VỈcm)1 for 4 h at room temperature. The
gels were stained by using 0.01% Stainsall dye (Sigma
Chemical Co., St Louis, MO, USA) in 50% formamide
(v ⁄ v). Alternatively, using 32P-labelled oligomers, the gels
were fixed in 10% acetic acid, dried and then exposed to
autoradiography on X-AR Omat Kodak film.
Cell cultures and cytotoxicity assay
The human T-lymphoblastic leukaemic CCRF-CEM cell
line was cultured in RPMI 1640 medium supplemented with
10% foetal serum (Euroclone, Celbio, Devon, UK), 2 mm
L-Gln, 100 mL)1 penicillin, 100 lgỈmL)1 streptomycin.
GT oligonucleotides, eEF1A and antiproliferative effect
CCRF-CEM cells (5 · 103) in exponential growth phase
were seeded in 200 lL foetal clone serum (Euroclone, Celbio, Devon, UK) containing medium, in 96-well microtiter
plate in triplicate. After overnight incubation, the oligomers
were directly added to the cell medium at the indicated final
concentrations. Cell growth was evaluated 3 days of culture
after oligonucleotide administration by incorporation of
0.5 mgỈmL)1 MTT into viable cells [28]. The percentage of
cellular growth was estimated by considering 100% cell
growth that of the internal-control nontreated cells.
Total nuclear extracts preparation
Total nuclear extracts were obtained from approximately
20 · 106 CCRF-CEM cells by a small modification of Dignam’s method [15]. The protein content was determined by
the Bradford method [29] using BSA (Sigma Chemical Co.)
as standard.
Affinity chromatography
The 5¢-biotin labelled oligomer 5¢-T(GTTT)9GT-3¢ (MWGBiotech AG) was immobilized on streptavidin magnetic
particles (Boehringer, Mannhein) in 10 mm Tris ⁄ HCl, 1 mm
EDTA, 100 mm NaCl, pH 7.5 (TEN 100) at a concentration of 1 lg oligomerỈmg)1 beads. After 30 min incubation
at room temperature, the beads were washed twice with
10 mm Tris ⁄ HCl, 1 mm EDTA, 1 m NaCl, pH 7.5 (TEN
1000). The beads were equilibrated in TEN 1000. For protein binding, the beads were preincubated with 0.5 mgỈmL)1
BSA in TEN 100 for 10 min. The beads were washed thrice
with TEN 100 and then equilibrated in 20 mm Hepes,
1.5 mm MgCl2, 0.2 mm EDTA, 0.42 m NaCl, containing
10% glycerol and 0.05% NP40 (buffer C). The beads were
incubated with 3 mg proteins from the nuclear-enriched
fraction supplemented with 1 mm phenylmethanesulfonyl
fluoride (PMSF), 0.01% NP40 and 0.05 mgỈmL)1 salmon
sperm DNA, for 1 h with gentle stirring. The beads were
washed twice with buffer C and twice with buffer C without NP40. The elution was made with three volumes of
buffer C without NP40 adjusted to 1.5 m NaCl, incubating
for 10 min with gentle stirring. The beads were then washed
with TEN 100 and stored at 4 °C with 0.01% NaN3. The
eluted proteins were dialysed with a 3000-Da cutoff membrane (Centricon) in 1 mm Hepes, 0.2 mm EDTA, 5% glycerol, 5 mm dithiothreitol (DTT), 5 mm PMSF and then
lyophilized. The protein was resuspended in 50 lL water
containing 10% glycerol and 5 mm DTT.
Purification of eEF1A from Coomassie
blue-stained gel
We have previously shown that the protein eEF1A can be
isolated from a Coomassie blue stained gel [21]. Briefly, the
FEBS Journal 273 (2006) 1350–1361 ª 2006 The Authors Journal compilation ª 2006 FEBS
1359
GT oligonucleotides, eEF1A and antiproliferative effect
B. Scaggiante et al.
band corresponding to eEF1A was excised from the gel and
recovered in 50 mm Tris ⁄ HCl pH 8.0, containing 0.1%
SDS, 0.1 mgỈmL)1 BSA, 0.2 mm EDTA, 2.5% glycerol.
After two steps of freeze ⁄ thawing, followed by precipitation
with cold acetone, the protein was rinsed with methanol,
denatured with 8 m urea and then renatured by overnight
incubation in a fixed volume of 50 mm Tris ⁄ HCl pH 7.6,
100 mm KCl, 5 mm DTT, 0.1 mm PMSF. It was not possible to quantify the amount of recovered protein owing to
the presence of a high molar excess of BSA remaining in
the recovery buffer. Therefore, a fixed aliquot of the protein
was incubated with 1 ng of the indicated probes. After
30 min incubation at room temperature, the samples were
loaded onto a native 8% polyacrylamide gel in TBE and
run at 10 VỈcm)1, at a temperature of 4 °C.
0.05% Tween-20 and four times with deionized water, the
nitrocellulose blot was developed using enhanced chemiluminescence detection (Pierce, Rockford, IL) according to the
manufacturer’s protocols, and then exposed to X-ray film.
Circular dichroism
The oligomers were resuspended in 150 mm NaCl, 10 mm
K2HPO4 ⁄ KH2PO4, 1 mm EDTA, pH 7.0 at 10 lm and
denatured at 100 °C and then renatured by slowly cooling
overnight. The oligomers were diluted in 150 mm NaCl,
10 mm K2HPO4 ⁄ KH2PO4, 1 mm EDTA pH 7.0 buffer or in
water at a final concentration of 0.5 lm and then analysed
with a Jasco JT-710 CD spectrophotometer equipped with a
thermostatic bath. The spectra were recorded at different
temperatures by a Spectra manager analyser software.
EMSA and UV cross-linking assay
Samples containing 2 lg total nuclear proteins or 2.5–
10 lL of proteins purified by affinity chromatography or
by PAGE, were incubated with 2 ng [c-32P]ATP-labelled
probe and with 1 lg of poly(dIdC) and 1 lg of CT oligomer (5¢-TCTTTCTTTCTTTCTTTCTTTCTTTCT-3¢), as
nonspecific competitors, in the absence or in the presence
of 500-fold molar excess of the indicated nonlabelled specific competitors. For EMSA, after 30 min incubation at
room temperature, the samples were loaded onto a 12%
polyacrylamide gel (acrylamide:bisacrylamide, 29 : 1, w ⁄ w)
in TBE and run at 10 VỈcm)1 for 2 h at 4 °C. The gels were
fixed in 10% acetic acid, then dried and exposed to KodaK
XAR-OMAT film. For the UV crosslinking, after 30 min
incubation at room temperature, samples were exposed to
UV light at 302 nm for 10 min using a transilluminator,
denatured and loaded onto 12% SDS ⁄ PAGE gel. The gels
were dried and exposed to KodaK XAR-OMAT film.
Western blotting analysis
Five micrograms total nuclear proteins and 30 lL affinity
purified proteins, separated by 12% SDS ⁄ PAGE were electrophoretically transferred onto a 0.22-lm nitrocellulose
membrane (Schleicher & Schuell, Keene, NH) in 50 mm
Tris ⁄ HCl, 40 mm glycine, 0.4% SDS, 20% methanol buffer,
using a transblot semidry apparatus system (Amersham
Pharmacia Biotech, Uppsala, Sweden). The membrane was
stained with Ponceau S (Sigma Chemical Co.) and destained
with deionized water. The blotted membrane was blocked
with 3% nonfat dried milk in NaCl ⁄ Pi and incubated with
eEF1A mAb (1 lgỈmL)1) (Upstate Biotechnology, Lake Placid, NY) or with nucleolin mAb (Santa Cruz Biotechnology
Inc., CA) in NaCl ⁄ Pi, overnight, at 4 °C with constant rocking. Then, it was washed twice with deionized water and
incubated for 1.5 h with a horseradish peroxidase-conjugated antimouse IgG secondary antibody (Promega, Madison, WI). After washing once with NaCl ⁄ Pi containing
1360
Acknowledgments
This work was supported in part by FIRB number
RBNE0155LB and in part by the program ‘Rientro
cervelli’ art. 1 DM n.13 of Italian Ministry for University and Research, MIUR.
References
1 Stanlis KKH & Mcintosh JR (2003) Single-strand DNA
aptamers as probes for protein localization in cells.
J Histochem Cytochem 51, 708–808.
2 Farokhzad OC, Jon S, Khademhosseini A, Tran TN,
Lavan DA & Langer R (2004) Nanoparticle-aptamer
bioconjugates: a new approach for targeting prostate
cancer cells. Cancer Res 64, 7668–7672.
3 Zhang Z, Blank M & Schluesener HJ (2004) Nucleic
acid aptamers in human viral disease. Arch Immunol
Ther Exp 52, 307–315.
4 Lee JF, Hesselberth JR, Meyer LA & Ellington AD
(2004) Aptamer database. Nucl Acids Res 32, D95–D100.
5 Choi YS, Pack SP & Yoo YJ (2005) Development of a
protein microarray using sequence-specific DNA binding domain on DNA chip surface. Biochem Biophys Res
Commun 329, 1315–1319.
6 Riou JF, Guittat L, Mailliet P, Laoui A, Renou E, Petitgenet O, Megnin-Chanet F, Helene C & Mergny JL
(2002) Cell senescence and telomere shortening induced
by a new series of specific G-quadruplex DNA ligands.
Proc Natl Acad Sci USA 99, 2672–2677.
7 Gomez D, Paterski R, Lemarteleur T, Shin-Ya K,
Mergny JL & Riou JF (2004) Interaction of telomestatin with the telomeric single-strand overhang. J Biol
Chem 279, 41487–41494.
8 Cohen S, Jacob E & Manor H (2004) Effects of singlestranded DNA binding proteins on primer extension by
telomerase. Biochim Biophys Acta 1679, 129–140.
FEBS Journal 273 (2006) 1350–1361 ª 2006 The Authors Journal compilation ª 2006 FEBS
B. Scaggiante et al.
9 Lang R, Hultner L, Lipford GB, Wagner H & Heeg K
(1999) Guanosine-rich oligodeoxynucleotides induce
proliferation of macrophage progenitors in cultures of
murine bone marrow cells. Eur J Immunol 29, 3496–
3506.
10 Bates PJ, Kahlon JB, Thomas SD, Trent JO & Miller
DM (1999) Antiproliferative activity of G-rich oligonucleotides correlates with protein binding. J Biol Chem
274, 26369–26377.
11 Xu X, Hamhouya F, Thomas D, Burker TJ, Girvant
AC, McGregor WG, Trent JO, Miller DM & Bates P
(2001) Inhibition of DNA replication and induction of
S phase cell cycle arrest by G-rich oligonucleotides.
J Biol Chem 276, 43221–43230.
12 Russo G, Cuccurese M, Monti G, Russo A, Amoresano
A, Pucci P & Pietropaolo C (2005) Ribosomal protein
L7a binds RNA through two distinct RNA-binding
domains. Biochem J 385, 289–299.
13 Jing N, Li Y, Xiong W, Sha W, Li P, Jing L &
Tweardy DJ (2004) G-quartet oligonucleotides: a new
class of signal transducer and activator of transcription
3 inhibitors that suppresses growth of prostate and
breast tumors through induction of apoptosis. Cancer
Res 64, 6603–6609.
14 Jing N, Li Y, Xu X, Sha W, Li P, Feng L & Tweardy
DJ (2003) Targeting Stat3 with G-quartet oligodeoxynucleotides in human cancer cells. DNA Cell Biol 22,
685–696.
15 Scaggiante B, Morassutti C, Dapas B, Tolazzi G, Ustulin F & Quadrifoglio F (1998) Human cancer cell lines
growth inhibition by GTn oligodeoxyribonucleotides
recognizing single-stranded DNA-binding proteins. Eur
J Biochem 252, 207–215.
16 Morassutti C, Dapas B, Scaggiante B, Paroni G, Xodo
L & Quadrifoglio F (1999) Effect of oligomer length
and base substitutions on the cytotoxic activity and specific nuclear protein recognition of GTn oligonucleotides
in the human leukemic CCRF-CEM cell line. Nucleosides Nucleotides 18, 1711–1716.
17 Dapas B, Perissin L, Pucillo C, Quadrifoglio F & Scaggiante B (2002) Increase in therapeutic index of doxorubicin and vinblastine by aptameric oligonucleotide in
human T lymphoblastic drug-sensitive and multidrugresistant cells. Antisense Nucl Acid Drug Dev 12, 247–
255.
18 Morassutti C, Scaggiante B, Dapas B, Xodo L, Tell G
& Quadrifoglio F (1999) Effect of phosphorothioate
modifications on the ability of GTn oligodeoxynucleotides to specifically recognize single-stranded DNA-
GT oligonucleotides, eEF1A and antiproliferative effect
19
20
21
22
23
24
25
26
27
28
29
binding proteins and to affect human cancer cellular
growth. Biochimie 81, 1115–1122.
Scaggiante B, Dapas B & Quadrifoglio F (2001) Alphaanomeric configuration of GT oligodeoxynucleotide
leads to loss of the specific aptameric and cytotoxic
properties retained by the beta-anomeric analog. Antisense Nucl Acid Drug Dev 11, 395–399.
Scaggiante B, Dapas B, Perissin L & Manzini G (2005)
Aptameric GT oligomers need to be complexed to
ethoxylated polyethylenimine as pre-paired duplexes to
efficiently exert their cytotoxic activity in human lymphoblastic cancer cells. Biochimie 87, 713–723.
Dapas B, Tell G, Scaloni A, Pines A, Ferrara L, Quadrifoglio F & Scaggiante B (2003) Identification of different isoforms of eEF1A in the nuclear fraction of human
T-lymphoblastic cancer cell line specifically binding to
aptameric cytotoxic GT oligomers. Eur J Biochem 270,
3251–3262.
Thornton S, Anand N, Purcell D & Lee J (2003) Not
just for housekeeping: protein initiation and elongation
factors in cell growth and tumorigenesis. J Mol Med 81,
536–548.
Abbott CM & Proud CG (2004) Translation factors: in
sickness and in health. Trends Biochem Sci 29, 25–31.
Crnugelj M, Sket P & Plavec J (2003) Small change in a
G-rich sequence, a dramatic change in topology: new
dimeric G-quadruplex folding motif with unique loop
orientations. J Am Chem Soc 125, 7866–7871.
Crnugelj M, Hud NV & Plavec J (2002) The solution
structure of d (G (4) T (4) G (3) (2): a bimolecular
G-quadruplex with a novel fold. J Mol Biol 320, 911–924.
Dapic V, Abdomerovic V, Marrington R, Peberdy J,
Rodger A, Trent JO & Bates PJ (2003) Biophysical and
biological properties of quadruplex oligodeoxyribonucleotides. Nucl Acids Res 31, 2097–2107.
Sapp M, Richter A, Weisshart K, Caizergues-ferrer M,
Amalric F, Wallace MO, Kirstein MN & Olson MO
(1989) Characterization of a 48 kDa nucleic-acid-binding fragment of nucleolin. Eur J Biochem 179, 541–548.
Monks A, Scudiero D, Skehan P, Shoemaker R, Paull
K, Vistica D, Hose C, Langley J, Cronise P, VaigroWolff A, Gray-Goodrich M, Campbell H, Mayo J &
Boyd M (2001) Feasibility of a high-flux anticancer
drug screen using a diverse panel of cultured human
tumor cell lines. J Natl Cancer Inst 83, 757–766.
Bradford MM (1976) A rapid and sensitive method for
the quantitation of microgram quantities of protein utilizing the principle of protein-dye binding. Anal Biochem
72, 248–225.
FEBS Journal 273 (2006) 1350–1361 ª 2006 The Authors Journal compilation ª 2006 FEBS
1361