Báo cáo khoa học: Pyruvate metabolism in rat liver mitochondria What is optimized at steady state? pptx
Bạn đang xem bản rút gọn của tài liệu. Xem và tải ngay bản đầy đủ của tài liệu tại đây (228.96 KB, 10 trang )
Pyruvate metabolism in rat liver mitochondria
What is optimized at steady state?
Jo
¨
rg W. Stucki and Robert Urbanczik
Department of Pharmacology, University of Bern, Switzerland
Mitochondria are generally regarded as the power-
house of the cell having the main task of supplying
energy in the form of ATP produced during oxidative
phosphorylation from ADP and P
i
. Furthermore, it is
well known that mitochondria take up Ca
2+
ions in
an energy-dependent manner. Other important reac-
tions are the Krebs cycle, oxidation of fatty acids and
the urea cycle [1,2]. One may ask, which of these reac-
tions are optimized and play the most important role?
There are probably no dominant tasks in liver mito-
chondria and we are therefore faced with multiple
optimizations, depending on the cellular demands.
Mitochondria from liver and kidney contain pyru-
vate carboxylase and are actively involved in gluconeo-
genesis [3]. The aim of this study was to discover the
importance of this first step in gluconeogenenesis, and
special conditions were therefore chosen to allow us to
study the carboxylation of pyruvate, the Krebs cycle
and ketone body production by ignoring the many
other reactions also present in these organelles. In this
sense, the model and experiments of mitochondrial
pyruvate metabolism are biased and do not consider
the typical intracellular environment of hepatocytes.
Genomics has led to construction of the stoichio-
metry matrices of several simple organisms such as
Escherichia coli and Saccharomyces cerevisiae. Apply-
ing linear programming methods, researchers have
analysed the optimizations of different goals, the most
prominent being the maximization of cellular growth
[4–7]. It goes without saying that this cannot be the
major task of liver mitochondria. Therefore, we inves-
tigated the optimization of metabolic functions. In
Keywords
dominant reactions; mitochondria;
optimization of metabolism; pyruvate
metabolism; stoichiometric network analysis
Correspondence
J. W. Stucki, Department of Pharmacology,
University of Bern, Friedbu
¨
hlstrasse 49,
CH-3010 Bern, Switzerland
Fax: +41 31 632 4992
Tel: +41 31 632 3281
E-mail:
Website: />index.html
(Received 17 August 2005, revised 28
September 2005, accepted 4 October 2005)
doi:10.1111/j.1742-4658.2005.05005.x
A representative model of mitochondrial pyruvate metabolism was broken
down into its extremal independent currents and compared with experimen-
tal data obtained from liver mitochondria incubated with pyruvate as a
substrate but in the absence of added adenosine diphosphate. Assuming no
regulation of enzymatic activities, the free-flow prediction for the output of
the model shows large discrepancies with the experimental data. To study
the objective of the incubated mitochondria, we calculate the conversion
cone of the model, which describes the possible input⁄ output behaviour of
the network. We demonstrate the consistency of the experimental data with
the model because all measured data are within this cone. Because they are
close to the boundary of the cone, we deduce that pyruvate is converted
very efficiently (93%) to produce the measured extramitochondrial
metabolites. We find that the main function of the incubated mitochondria
is the production of malate and citrate, supporting the anaplerotic path-
ways in the cytosol, notably gluconeogenesis and fatty acid synthesis.
Finally, we show that the major flow through the enzymatic steps of the
mitochondrial pyruvate metabolism can be reliably predicted based on the
stoichiometric model plus the measured extramitochondrial products. A
major advantage of this method is that neither kinetic simulations nor
radioactive tracers are needed.
Abbreviations
ACAC, acetoacetate; AcCoA, acetyl-CoA; AKG, 2-oxoglutarate; BOB, 3-OH-butyrate; CIT, citrate; FUM, fumarate; ICI, isocitrate; MAL,
malate; OAA, oxaloacetate; SucCoA, succinyl-CoA; SUC, succinate.
6244 FEBS Journal 272 (2005) 6244–6253 ª 2005 FEBS No claim to original US government works
previous studies we analysed the efficiency of oxidative
phosphorylation and found different degrees of coup-
ling [8], which could be regulated by the metabolic
states of the liver, for example, feeding and starvation
[9].
In this study, we investigated whether the first step
of gluconeogenesis may also be a possible target for
optimization. Finally, we wanted to see whether any
reasonable predictions about the behaviour of the sys-
tem could be made from knowledge of the stoichio-
metry matrix alone without any experimental data or
additional assumptions in what we called the free-flow
system.
Experimental data and computational
procedures
Our experimental data were taken from a previous
publication in which computer-simulated fluxes were
compared with experimentally measured values [10].
These procedures are not repeated here because an
exhaustive description already exists. Suffice it to men-
tion that sodium [2-
14
C] pyruvate was used as a sub-
strate, and allowed measurement of the pertinent
metabolic flows in incubated mitochondria from rat
liver. The model investigated was somewhat simplified
by omitting activation of the pyruvate carboxylase by
acetyl-CoA and its inhibition by ADP in order to get
an idea of the general properties of the unconstrained
free-flow system and compare it with incubated mito-
chondria. The remaining reactions considered are listed
in Table 1. From these reactions the stoichiometry
matrix was set up and the extremal currents were cal-
culated using the mathematica program [11]. Note
that this program can deal directly only with irrevers-
ible reactions and yields all extremal currents as
defined by Clarke [12]. It is based on the Nullspace
approach and it is, in fact, an early version of a
Table 1. Major reactions involved in mitochondrial pyruvate metabolism rat liver. The reactions are taken from a previously published model
[10] and simplified as described in the text. In addition to the numbering scheme the reactions and the enzymes catalysing them are listed
together with their corresponding EC numbers. The extramitochondrial pool is indicated by curly brackets.
No Reaction Enzyme(s) EC No
1{}fi Pyruvate Influx
2 Pyruvate + CoASH + NAD
+
fi Acetyl-CoA + NADH + H
+
+CO
2
Pyruvate dehydrogenase 1.2.4.1
3 2 Acetyl-CoA fi Acetoacetate +2 CoASH Acetyltransferase, AcetoacetylCoA
hydrolase
2.3.1.9 3.1.2.11
4 Acetoacetate + NADH + H
+
fi 3 -OH-Butyrate + NAD
+
3-Hydroxybutyrate dehydrogenase 1.1.1.30.
5 3 -OH-Butyrate + NAD
+
fi Acetoacetate + NADH + H
+
3-Hydroxybutyrate dehydrogenase 1.1.1.30.
6 Acetyl-CoA + Oxaloacetate + H
2
O fi Citrate + CoASH Citrate synthase 2.3.3.1.
7 Pyruvate + ATP + CO
2
fi Oxaloacetate + ADP + P
i
Pyruvate carboxylase 6.4.1.1.
8 Citrate fi Isocitrate Aconitate hydratase 4.2.1.3
9 Isocitrate fi Citrate Aconitate hydratase 4.2.1.3.
10 Isocitrate + NAD
+
fi 2 -Oxoglutarate + NADH + H
+
+CO
2
Isocitrate dehydrogenase 1.1.1.41.
11 2 -Oxoglutarate + NAD
+
+ CoASH fi Succinyl-CoA + NADH + H
+
+CO
2
Oxoglutarate dehydrogenase 1.2.4.2.
12 SuccinylCoA + GDP + P
i
fi Succinate + GTP + CoASH Succinyl-CoA synthetase 6.2.1.4.
13 Succinate + FAD fi Fumarate + FADH
2
Succinate dehydrogenase 1.3.99.1.
14 Fumarate + H
2
O fi Malate Fumarase 4.2.1.2.
15 Malate fi Fumarate + H
2
O Fumarase 4.2.1.2.
16 Malate + NAD
+
fi Oxaloacetate + NADH + H
+
Malate dehydrogenase 1.1.1.37.
17 Oxaloacetate + NADH + H
+
fi Malate + NAD
+
Malate dehydrogenase 1.1.1.37.
18 3 ADP + 3 P
i
+ NADH + H
+
+1⁄ 2O
2
fi 3 ATP + NAD
+
+H
2
O Oxidative phosphorylation
19 2 ADP + 2 P
i
+ FADH
2
+1⁄ 2O
2
fi 2 ATP + FAD + H
2
O Oxidative phosphorylation
20 ADP + GTP fi ATP + GDP Nucleoside-diphosphate kinase 2.7.4.6.
21 ATP fi ADP + P
i
,ATPase’
22 Acetoacetate fi { } Efflux
23 3 -OH-Butyrate fi { } Efflux
24 Citrate fi { } Efflux
25 Isocitrate fi { } Efflux
26 2 -Oxoglutarate fi { } Efflux
27 Succinate fi { } Efflux
28 Fumarate fi { } Efflux
29 Malate fi { } Efflux
30 Oxaloacetate fi { } Efflux
J. W. Stucki and R. Urbanczik Pyruvate metabolism in rat liver mitochondria
FEBS Journal 272 (2005) 6244–6253 ª 2005 FEBS No claim to original US government works 6245
program by Urbanczik and Wagner [13] that handles
reversible reactions without splitting them into two
irreversible ones.
Elementary flux modes [14], by contrast to extremal
currents, are able to deal with both reversible and irre-
versible reactions. The extremal currents represent the
full solution of the system, whereas elementary flux
modes are generally a subset of them. Only when all
reactions are irreversible, are the elementary flux
modes identical to the extremal currents, otherwise
they are a projection from the extremal current poly-
tope into a polytope with a lower dimension. Because
a proper transformation operator exists [13], one can
switch from one representation to the other without
losing information.
In order to arrive at a consistent presentation,
we use the same abbreviations for the metabolites
throughout.
The free-flow system
As a first step we wanted to get a general idea about
mitochondrial pyruvate metabolism without any
experimental information, and to verify what conclu-
sions could be drawn at that stage. Table 1 lists the
reactions we considered for pyruvate metabolism in
isolated mitochondria from rat liver. Several reactions
were omitted for clarity. First, the regulation of pyru-
vate carboxylase by acetyl-CoA and ADP is ignored.
Second, different exchangers such as the citrate–malate
antiporter and the malate–oxoglutarate exchanger were
also omitted. The main reason for this was not only to
simplify the model, but also because extramitochond-
rial counter ions were not added to the incubation
medium in the experiment, with the exception of P
i
.
Hence, all metabolites leaving the mitochondria do so
by simple efflux. The same applies to pyruvate uptake,
because its exact mechanism remains unclear. The
advantage of this procedure is that it provides infor-
mation about the unconstrained flows possible in this
scheme. In other words, this simplified model furnishes
an idea about the general behaviour of the model. Fur-
thermore, the metabolites P
i
,O
2
,H
2
O and CO
2
were
treated as external molecules in large excess and thus
as being essentially constant. Because we are not inter-
ested in tracking these four metabolites they were
ignored in the stoichiometry matrix.
For the intramitochondrial reactions in Table 1, the
corresponding stoichiometry matrix was set up (not
shown). This matrix was then further processed to find
all extremal currents by using the program mathemat-
ica. The resulting matrix of the extremal currents is
shown in Fig. 1. The 30 reactions listed in Table 1
produced 37 extremal currents all fulfilling the steady-
state condition. Note that the algorithm used is based
on the Nullspace approach, which eliminates all inde-
pendent species automatically. Therefore conservation
conditions like NADH + NAD
+
¼ constant could be
ignored. The same goes for the free and bound CoA.
The matrix in Fig. 1 shows all 37 extremal currents
possible for the reactions listed in Table 1. Column 1
shows the entry of pyruvate and the last nine columns
represent the different outputs of the produced meta-
bolites (reactions 22–30 in Table 1). Four of these
extremal currents produce no output because they rep-
resent reversible reactions. For example, row 3 stands
for the reversible reaction of the fumarase and row 5
represents the reversible conversion of citrate to iso-
citrate. Furthermore, row 2 represents the Krebs cycle,
which generates no output except CO
2
and H
2
O but
consumes pyruvate and dissipates ATP in reaction 21.
Because, as mentioned above we are ignoring CO
2
,
H
2
O and P
i
, in our notation the Krebs cycle appears
as simply consuming pyruvate but generating no out-
put.
The numbers in Fig. 1 are not easy to visualize.
They could, for example, be drawn as reaction dia-
grams, as done previously [12,15]. Here, by simply
adding the numbers in each column of the extremal
current matrix, we obtain the free-flow diagram shown
in Fig. 2. This gives a general graphical picture of the
mutual interconnections of the flows.
Of course, assigning an equal weight of unity to
every extremal current is of questionable physiological
meaning. However, in the absence of experimental
data determining the true weights, constructing the
free-flow system may still be the best thing one can do.
The incubated mitochondria
How does the free-flow system compare with incuba-
ted rat liver mitochondria? To this end, we used the
experimental results from a previous publication in
which mitochondria were incubated with 2-[
14
C]-pyru-
vate [10]. This allowed measurement of all intramito-
chondrial fluxes including the citric acid cycle and
ketone body production. The measurements of the
extramitochondrial metabolites are given in Table 2
and are compared in Fig. 3 together with the free
flow data.
Obviously, there is a discrepancy between the two
data sets. Notably, in the free-flow system there is a
large production of oxaloacetate, whereas none was
found in the incubation. The same goes for isocitrate.
Furthermore, there is a large difference in the cit-
rate produced during incubation compared with the
Pyruvate metabolism in rat liver mitochondria J. W. Stucki and R. Urbanczik
6246 FEBS Journal 272 (2005) 6244–6253 ª 2005 FEBS No claim to original US government works
free-flow system. This emphasizes the need for the
experimental data to get closer to the realistic beha-
viour of mitochondrial pyruvate metabolism.
The conversion cone
When describing the metabolic model by the cone of
extremal currents, flows through the internal reactions
play an important role. However, the experimental
results in Table 2 provide information about the flows
through the extramitochondrial exchange reaction of
the network only. Hence, in analysing the model, we
consider only conversions between the external metab-
olites, in effect treating the mitochondria as a black
box input ⁄ output system.
Obtaining a description of the possible input ⁄ output
behaviour is straightforward. We delete the columns
(2–21) in the current matrix that correspond to the
internal reactions. Then, as a matter of convention, we
invert the sign of the first column, as this represents an
input exchange. The projected current matrix thus
obtained, which we call P is shown in Table 3. For
instance, from the first row of the current matrix we
obtain the first row of P as ()160000000015),
showing that 16 PYR fi 15 OAA is one of the
RYP
CcAoA A CACBBO
ICI
GKA
AoCcuSC
U
S
M
UF
LAM
A
AOCTI
6
01
172286111
05
9
81
87
43
81
82
83
54
05
9
3
1
1
6
0134
46 6
0
1
82
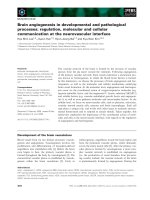
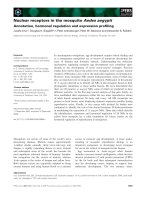
Fig. 2. Free, unconstrained flows at steady state. This diagram was
constructed by using the information contained in the extremal cur-
rents matrix in Fig. 1 (see text).
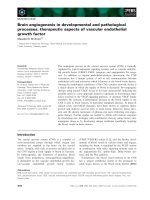
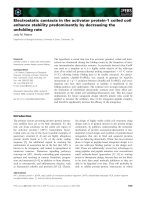
Fig. 1. Extremal currents for the reactions listed in Table 1. These were calculated using the MATHEMATICA program [11]. Because the 30 col-
umns of this matrix correspond exactly to the numbering scheme used in Table 1 (from left to right) the last nine columns correspond to
the metabolites leaving the mitochondria. Similarly column 1 represents pyruvate uptake. Note that of the 37 extremal currents, 5 produce
no output measured in the experiment (see text).
J. W. Stucki and R. Urbanczik Pyruvate metabolism in rat liver mitochondria
FEBS Journal 272 (2005) 6244–6253 ª 2005 FEBS No claim to original US government works 6247
conversions between the external metabolites that the
network can perform.
Each row of P, the projected current matrix, thus
describes an allowed input ⁄ output behaviour, and
indeed any possible input ⁄ output behaviour is
obtained as a linear combination (with non-negative
scalar coefficients) of these 37 rows of P. Such linear
combinations generate a convex cone, which we call
the conversion cone C. Unfortunately, although the
conversion cone is obtained from P, this method of
describing C is too complicated. It would be simpler if
we just knew the edges of the cone C or, alternatively,
if we had a description of C by a set of linear inequal-
ities, i.e. a list of m vectors h
(i)
such that a point c is in
C if and only if
h
ðiÞ
c 0 for i ¼ 1; ; m ð1Þ
For example the experimentally observed conversions
in Table 2 has
c ¼ð20:88; 0:97; 0:57; 4:56; 0:01; 0:20; 0:15; 0:91; 5:08; 0:01Þ:
The mathematical techniques used to obtain the edges
of the conversion cone C as well as the h
(i)
from the
projected extremal current matrix P have been des-
cribed elsewhere [16]. Here, we state the results. It
turned out, as shown in Table 3, that of the 37 rows in
P only 28 are actually edges of C.
The h
(i)
yielding the inequalities representation of C,
Eqn (1) are given by the rows of the following matrix
H:
H ¼
PYR ACAC BOB CIT ICI AKG SUC FUM MAL OAA
010 0 00000 0
001 0 00000 0
000 1 00000 0
000 0 10000 0
000 0 01000 0
000 0 00100 0
000 0 00010 0
000 0 00001 0
000 0 00000 1
1 2 2 2 2 2 2 1 1 1
15 24 27 28 28 25 21 19 19 16
0
B
B
B
B
B
B
B
B
B
B
B
B
B
B
B
B
B
B
B
B
B
@
1
C
C
C
C
C
C
C
C
C
C
C
C
C
C
C
C
C
C
C
C
C
A
It is worth noting that the first nine rows of H state
the obvious fact that all metabolites except pyruvate
can only be produced but never consumed by the
network. Only the last two rows of H give nontrivial
constraints on the allowed input ⁄ output behaviour.
Using the matrix H makes it very easy to determine
whether a given 10-dimensional point c lies in the con-
version cone. We just test if Hc ‡ 0. One easily verifies
that the experimental result in Table 2 passes this test.
Hence, the experimental data lie within the conversion
cone, thus demonstrating the consistency of our meta-
bolic model. However, although the experimentally
observed conversion is in the interior of C, it actually
lies quite close to the boundary of the conversion cone.
This can be illustrated by replacing the measured value
of 20.88 lmoles for the consumption of pyruvate in
Table 2 by a variable uptake x while keeping the out-
put metabolites at the measured values, i.e. choosing
Table 2. Experimentally measured metabolites in the extramitoch-
ondrial medium. Mitochondria from rat liver (18 mg mitochondrial
protein) were incubated with pyruvate-2-[
14
C] and concentrations
were measured after incubation at 37 °C for 10 min [10]. The pyru-
vate used was calculated from the pyruvate added to the medium
at the beginning and that found after 10 min of incubation.
Extramitochondrial (used or found) lmol (10 min)
Pyruvate used 20.88
Citrate found 4.56
Isocitrate found < 0.03
2-Oxoglutarate found 0.20
Succinate found 0.15
Fumarate found 0.91
Malate found 5.08
Oxaloacetate found < 0.03
Acetoacetate found 0.97
3-OH-Butyrate found 0.57
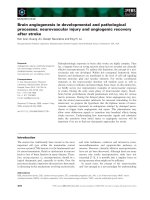
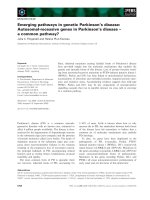
Fig. 3. Comparison of extramitochondrial metabolites in incubated
mitochondria and in the free-flow system. The data in Fig. 2 and
Table 2 were converted into percentage on the basis of the pyru-
vate entering the mitochondria and plotted together in a bar graph.
Pyruvate metabolism in rat liver mitochondria J. W. Stucki and R. Urbanczik
6248 FEBS Journal 272 (2005) 6244–6253 ª 2005 FEBS No claim to original US government works
c ¼ðx; 0:97; 0:57; 4:56; 0:01; 0:20; 0:15; 0:91; 5:08; 0:01Þ:
We may then ask, for which minimal value of x this
choice of c is still within the conversion cone. This
minimal pyruvate uptake is found to be x ¼
19.25 lmoles because for this choice the last inequality
in H holds as an equality whereas the other inequalit-
ies are still strictly satisfied. The minimal value of
19.25 lmoles is near the observed value of
20.88 lmoles and therefore shows that the mitochon-
dria are using pyruvate close to optimally (93%) in
producing the metabolites measured in the experiment.
The remaining 1.63 lmoles of pyruvate are used to
dissipate energy, probably to regulate the degree of
coupling of oxidative phosphorylation (see below).
As already mentioned, the inequality given by the
last row h
(11)
of H is the first one to be violated when
decreasing x from 20.88 lmoles. Now, the equation
h
(11)
c ¼ 0 defines a subset of the 10-dimensional con-
version cone C, viz. a nine-dimensional facet of the
Table 3. The P matrix with its edges defining the conversion cone C. The P matrix is obtained from columns 1 and 22–30 from the current
matrix as explained in the text. This matrix was then further processed as described previously [16] to find the edges of the conversion cone
C generated by its rows. The 28 rows, which are edges, are marked with a + in the right column. For example, 2 PYR fi FUM is not an
edge because a multiple of this conversion is obtained as a linear combination with positive scalar coefficients from 19 PYR fi 15 FUM and
PYR fi 0.
P P reaction form Edge
-160 000000015 16PYRfi 15 OAA +
-1 0 0 0 0 0 0 0 0 0 PYR fi 0+
00 000000 00 0fi 0
00 000000 00 0fi 0
00 000000 00 0fi 0
00 000000 00 0fi 0
-5 0 1 0 0 0 0 0 0 3 5 PYR fi BOB + 3 OAA +
-2 0 1 0 0 0 0 0 0 0 2 PYR fi BOB +
-8 1 0 0 0 0 0 0 0 6 8 PYR fi ACAC + 6 OAA +
-2 1 0 0 0 0 0 0 0 0 2 PYR fi ACAC +
-4 0 0 1 0 0 0 0 0 2 4 PYR fi CIT + 2 OAA +
-2 0 0 1 0 0 0 0 0 0 2 PYR fi CIT +
-4 0 0 0 1 0 0 0 0 2 4 PYR fi ICI + 2 OAA +
-2 0 0 0 1 0 0 0 0 0 2 PYR fi ICI +
-7 0 0 0 0 1 0 0 0 5 7 PYR fi AKG + 5 OAA +
-2 0 0 0 0 1 0 0 0 0 2 PYR fi AKG +
-110 00001009 11PYRfi 9 OAA + SUC +
-2 0 0 0 0 0 1 0 0 0 2 PYR fi SUC +
-130 000001011 13PYRfi FUM + 11 OAA
-2 0 0 0 0 0 0 1 0 0 2 PYR fi FUM
-130 000000111 13PYRfi MAL + 11 OAA
-2 0 0 0 0 0 0 0 1 0 2 PYR fi MAL
-19 0 0 0 0 0 0 0 15 0 19 PYR fi 15 MAL +
-110 40000030 11PYRfi 4 BOB + 3 MAL +
-7 2 0 0 0 0 0 0 3 0 7 PYR fi 2 ACAC + 3 MAL +
-5 0 0 2 0 0 0 0 1 0 5 PYR fi 2 CIT + MAL +
-5 0 0 0 2 0 0 0 1 0 5 PYR fi 2 ICI + MAL +
-130 00040050 13PYRfi 4 AKG + 5 MAL +
-170 00004090 17PYRfi 9 MAL + 4 SUC +
-19 0 0 0 0 0 0 4 11 0 19 PYR fi 4 FUM + 11 MAL
-19 0 0 0 0 0 0 15 0 0 19 PYR fi 15 FUM +
-110 40000300 11PYRfi 4 BOB + 3 FUM +
-7 2 0 0 0 0 0 3 0 0 7 PYR fi 2 ACAC + 3 FUM +
-5 0 0 2 0 0 0 1 0 0 5 PYR fi 2 CIT + FUM +
-5 0 0 0 2 0 0 1 0 0 5 PYR fi FUM + 2 ICI +
-130 00040500 13PYRfi 4 AKG + 5 FUM +
-170 00004900 17PYRfi 9 FUM + 4 SUC +
PYR ACAC BOB CIT ICI AKG SUC FUM MAL OAA
J. W. Stucki and R. Urbanczik Pyruvate metabolism in rat liver mitochondria
FEBS Journal 272 (2005) 6244–6253 ª 2005 FEBS No claim to original US government works 6249
conversion cone. This situation is shown schematically
in Fig. 4.
Because this facet is the one closest to the experimen-
tal results we shall further pinpoint the location of the
observed conversion by computing its angles to the 21
edges of the facet. The angles a were calculated accord-
ing to the standard formula from vector algebra
ab¼jja jj jj b jj cos a ð2Þ
where a are vectors from the P matrix belonging to the
facet and b is the vector of the experimental data. In
Table 4 we list the angles thus obtained and we also
show the angles between the free flow conversions and
the 21 edges. A perusal of the angles of the free flow
system show that they are more or less uniformly
spread between 22 and 33 degrees and that none is
close to an edge. This means, that there is no reaction
really dominating in this system, and all occur with
more or less the same probability. By contrast, in incu-
bated mitochondria one conversion is 10 degrees closer
to one edge and the farthest edge is 46 degrees away.
This means that the transformation number 1, two
citrates and one malate formed from five pyruvates,
dominates all other reactions, because it is closest to
the experiment. This is also in accordance with the
data shown in Table 2 in which malate and citrate are
the main products. This does not mean, however, that
no other conversions contribute to these metabolites,
as is evident from Table 4 in which these products
occur in different conversions.
Predicting internal flows from
extramitochondrial measurements
Given that the experimental findings for the extra-
mitochondrial flows are consistent with our model, it
is interesting to ask in how many ways the model can
reproduce these findings. To this end, we modified the
reaction system in Table 1, removing the 10 exchange
Table 4. Angles between edges and conversions in the facet for
the free flow system as well as for the incubated mitochondria.
The calculation of the angles (in degrees) is described in the text.
No. Angle Conversion
Experiment
1 10.4 5 PYR fi 2 CIT + MAL
2 18.4 5 PYR fi 2CIT+FUM
3 19.6 7 PYR fi 2 ACAC + 3 MAL
4 21.1 13 PYR fi 4 AKG + 5 MAL
5 21.7 11 PYR fi 4 BOB + 3 MAL
6 21.9 17 PYR fi 9 MAL + 4 SUC
7 24.8 5 PYR fi 2 ICI + MAL
8 27.5 19 PYR fi 15 MAL
9 28.1 11 PYR fi 4 BOB + 3 FUM
10 29.1 5 PYR fi FUM + 2 ICI
11 29.2 4 PYR fi CIT + 2 OAA
12 29.5 7 PYR fi 2 ACAC + 3 FUM
13 29.8 13 PYR fi 4 AKG + 5 FUM
14 32.8 17 PYR fi 9 FUM + 4 SUC
15 34.1 4 PYR fi ICI + 2 OAA
16 36.3 5 PYR fi BOB + 3 OAA
17 39.6 19 PYR fi 15 FUM
18 39.8 7 PYR fi AKG + 5 OAA
19 40.6 8 PYR fi ACAC + 6 OAA
20 42.9 11 PYR fi 9 OAA + SUC
21 46.2 16 PYR fi 15 OAA
Free Flow
1 22.1 4 PYR fi CIT + 2 OAA
2 22.1 4 PYR fi ICI + 2 OAA
3 23.4 5 PYR fi BOB + 3 OAA
4 23.5 13 PYR fi 4 AKG + 5 MAL
5 23.8 11 PYR fi 4 BOB + 3 MAL
6 24.3 7 PYR fi 2 ACAC + 3 MAL
7 24.7 13 PYR fi 4 AKG + 5 FUM
8 24.7 11 PYR fi 4 BOB + 3 FUM
9 25.3 17 PYR fi 9 MAL + 4 SUC
10 25.5 7 PYR fi 2 ACAC + 3 FUM
11 25.6 5 PYR fi 2 CIT + MAL
12 25.6 5 PYR fi 2 ICI + MAL
13 26.2 5 PYR fi 2CIT+FUM
14 26.2 5 PYR fi FUM + 2 ICI
15 26.3 7 PYR fi AKG + 5 OAA
16 26.7 17 PYR fi 9 FUM + 4 SUC
17 27.5 8 PYR fi ACAC + 6 OAA
18 29.2 11 PYR fi 9 OAA + SUC
19 31.8 19 PYR fi 15 MAL
20 32.7 16 PYR fi 15 OAA
21 33.5 19 PYR fi 15 FUM
Fig. 4. Schematic sketch of the conversion cone C in three dimen-
sions. The vector lying squarely in the interior of the cone is analog-
ous to the conversion given by the free-flow system. The second
vector that is close to the boundary of the cone lying nearly on the
front left facet corresponds to the experimental result. In contrast
to this three-dimensional sketch in reality the nine-dimensional
facet is delimited by 21 of the 28 edges of the conversion cone.
Pyruvate metabolism in rat liver mitochondria J. W. Stucki and R. Urbanczik
6250 FEBS Journal 272 (2005) 6244–6253 ª 2005 FEBS No claim to original US government works
reactions for the external metabolites and replacing
them with the single pseudoreaction
0:97 ACAC þ 0:2 AKG þ 0:57 BOB þ 4:56 CIT
þ 0:91 FUM þ 0:01 ICI þ 5:08 MAL þ 0:01 OAA
þ 0:15 SUC ! 20:88 PYR
Note, that this pseudoreaction is the experimentally
observed conversion (Table 2) with the roles of input
and output interchanged. A study of this modified
network reveals that it has only five extremal currents.
The first four are the futile cycles observed in the ori-
ginal model and only the fifth extremal current has a
nonzero flow through the above pseudoreaction. But
because all other extremal currents of the modified
model are futile cycles that, based on thermodynamic
considerations, cannot run in a steady state, the fifth
extremal current is the only way by which the model
can explain the behaviour observed in the experiment.
It is surprising that only one extremal current dictates
the behaviour of the system. The flows for some reac-
tions were measured previously [10], and the measured
values are compared with the prediction from our
model in Fig. 5. This shows that the extremal current
reliably describes the major flows.
Furthermore, in the extremal current reaction 21 the
‘ATPase’ dissipates 158.7 nmoles ATPÆmin
)1
Æmg mito-
chondrial protein
)1
(not shown in Fig. 5). As men-
tioned above, the utilization of 19.25 lmoles of
pyruvate exactly fulfils inequality h
(11)
, i.e. the point c
lies precisely on the facet. Taking this limiting value of
pyruvate utilization instead of the measured one sur-
prisingly shows that the ‘ATPase’ vanishes completely,
and no ATP is then dissipated. So at this limiting
point there can no longer be any flow through the
complete Krebs cycle. Hence, in the experiment the
excess 1.63 lmoles are destroyed by the Krebs cycle.
One might, therefore, speculate about the physiological
role of these 1.63 lmoles of pyruvate leading to the
observed dissipation of ATP.
In a previous study [8], we investigated the optimal
degrees of coupling q of oxidative phosphorylation
and found that in all cases q must be smaller than 1.
In other words, full coupling (q ¼ 1) was incompatible
with optimal efficiency at finite speed of oxidative
phosphorylation. In these experiments an external load
utilizing ATP was present; this is not the case here.
Furthermore, the efficiency of oxidative phosphoryla-
tion was defined as output power divided by input
power, calculated from the input and output reactions
of the mitochondria treated as a black box. These
ingredients are absent in our experiment, but can we
still say something about the efficiency and the degree
of coupling of oxidative phosphorylation in the present
system?
Such estimation requires some assumptions. First,
we have to assume that oxidative phosphorylation is
working at optimal efficiency, i.e. that conductance
matching is fulfilled [8]. Second, we need to estimate
the efficiency of oxidative phosphorylation as the ratio
of ATP utilized (reaction 7) divided by ATP produced.
The latter quantity can be obtained by adding the
flows through reactions 7 plus 21, because these are
the only ones consuming ATP which first must have
been produced. Taking the limiting value of
19.25 lmoles pyruvate used yields an efficiency of 1
and a degree of coupling q ¼ 1. In other words, oxida-
tive phosphorylation is fully coupled under these
circumstances, which is incompatible with optimal effi-
ciency.
By contrast, doing the same calculation for the
measured pyruvate utilization in the experiment yields
an efficiency of oxidative phosphorylation of 0.30 and
PYR
ACAC BOB
AcCoA
OAA CIT
AKG
SUCFUM
MAL
(63.2)
62.2
(67.2)
68.1
(47.5)
42.9
(19.5)
14.4
(18.5)
13,2
(15.7)
19.2
(3.7)
3.5
(17.6)
12.2
(11.4)
6.5
(19.7)
25.1
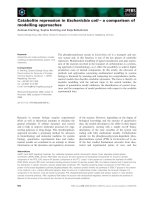
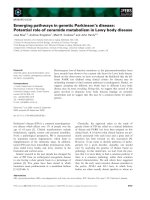
Fig. 5. Predicted and measured flows through some of the reac-
tions. The numbers in brackets are the measured flows
(in nmolÆmin
-1
Æmg protein
-1
) taken from Stucki and Walter [10]. In
addition to these, the predictions of the extremal current analysis
described in the text are given. The extremal current was normal-
ized to obtain the experimentally determined pyruvate uptake. One
of the key junctions in the pathway is given by the flow of oxalo-
acetate either directly to malate or, alternatively, into the Krebs
cycle via citrate. The predicted flow from oxaloacetate to citrate
deviates from the measured value by 10%. In absolute terms this
relative error corresponds to some 5 units, and this absolute differ-
ence must stay essentially the same throughout the Krebs cycle
because the outflows are predetermined. But this constant abso-
lute error leads to increasingly large relative errors in the down-
stream part of the Krebs cycle since the magnitude of the flows in
the cycle decreases due to the outflows of the intermediates.
J. W. Stucki and R. Urbanczik Pyruvate metabolism in rat liver mitochondria
FEBS Journal 272 (2005) 6244–6253 ª 2005 FEBS No claim to original US government works 6251
a degree of coupling of q ¼ 0.849. This degree of
coupling is between the values of optimal power out-
put and optimal flow of ATP production in oxidative
phosphorylation [8]. An independent check with the
data in Stucki and Walter [10] (Table 3), yields an effi-
ciency of 0.293 with a value of q ¼ 0.838. These results
show that the theoretical predictions and the data
taken from the experiment yield very similar values.
This indicates that 1.63 lmoles of pyruvate are used
for the regulation of the degree of coupling, provided
that the assumptions mentioned above are indeed
valid. Note, that the ‘ATPase’ is not a clearly defined
chemical reactions because it contains slips and leaks
of oxidative phosphorylation as well as the breakdown
of intra- and extramitochondrial ATP by unknown
ATPases, Thus we are not able to identify a single pro-
cess that would be responsible for the regulation of the
degree of coupling.
Concluding remarks
The main results of this study are: first, the transfor-
mation of five pyruvates into two citrates plus one
malate is the dominating reaction of the system; and
second, the conversion of pyruvate into its products is
nearly optimal with 93% efficiency. Hence, only 7%
of pyruvate is used for the dissipation of ATP, prob-
ably to regulate the degree of coupling of oxidative
phosphorylation.
Predicting the dominating reactions in a network
is difficult. This study has shown that a free-flow
diagram, although yielding the correct factors for a
steady state, can say nothing about which reactions
are important and which are not, thus there is (yet)
no simple recipe of reducing an extremal currents
matrix to its essential parts. It is the impression of
the authors that there exist only two reasonable pro-
cedures possible at present to solve this question:
(a) imposing or assuming external constraints or
(b) the measurement of metabolite turnover in vitro,
or better still in vivo, under different metabolic
conditions.
To illustrate this difficulty, we consider the study by
Stelling et al. [4] as an example. Successful splitting of
a large metabolic network into its independent currents
or elementary modes usually yields too much informa-
tion. Thus Klamt and Stelling found 507 632 element-
ary flux modes in a stylised partial model of E. coli
[17] and one might indeed ask how to proceed further.
From a practical point of view, it is convenient to con-
centrate on the functional aspects only, as done here,
and restrict analysis to the input ⁄ output relationship.
Note that by constructing the conversion cone one
loses no information because all other, less interesting,
details are contained in the current matrix.
Assuming external constraints makes sense for
autonomous organisms such as E. coli or S. cerevisiae.
One might then ask under what conditions there is
maximal growth [4–7] or maximal production of eth-
anol, for example. This approach, however, fails com-
pletely for organelles such as mitochondria, which are
an integral part of a cell in an organ such as the liver.
As already mentioned, such biochemical entities are
tightly integrated in a constantly changing cellular
environment. In other words, the major role of these
organelles is to act as servants rather than as inde-
pendent, autonomic entities. Mitochondria not only
have to produce ATP but they play also an essential
part in anaplerotic functions. Under certain circum-
stances, in starved rats for example, it is reasonable
that they can take part in glucose production by pro-
ducing malate. Malate contains not only the carbon
moieties for glucose synthesis, but it also shuttles the
reducing equivalents into the cytosol where it is needed
for glucose synthesis [3].
In concluding, it is instructive to compare our
approach for estimating intramitochondrial flows from
experimental observations with the full dynamic mod-
elling of the reaction system employed previously [10].
Whereas the latter approach yields somewhat more
accurate results, it is not only much more involved as
it requires more computer time for the simulations,
but it also needs a more detailed knowledge of the
reaction kinetics. By contrast, our approach is straight-
forward and quick, needing only a minimum of bench
work, notably without the use of radioactive tracers.
Acknowledgements
The Swiss National Science Foundation has supported
this study. It is a pleasure to thank Dr Clemens Wag-
ner for helpful comments.
References
1 Berg JM, Tyack BL & Stryer L (2002) Biochemistry.
W.H. Freeman, New York.
2 Lehninger AL (1965) The Mitochondrion: Molecular
Basis of Structure and Function. W.A. Benjamin, New
York.
3 Hers HG & Hue L (1983) Gluconeogenesis and related
aspects of glycolysis. Annu Rev Biochem 52, 617–653.
4 Stelling J, Klamt S, Bettenbrock K, Schuster S & Gilles
ED (2002) Metabolic network structure determines key
aspects of functionality and regulation. Nature 420,
190–193.
Pyruvate metabolism in rat liver mitochondria J. W. Stucki and R. Urbanczik
6252 FEBS Journal 272 (2005) 6244–6253 ª 2005 FEBS No claim to original US government works
5 Edwards JS & Palsson BO (2000) The Escherichia coli
MG1655 in silico metabolic genotype: its definition,
characteristics, and capabilities. Proc Natl Acad Sci
USA 97, 5528–5533.
6 Ibarra R, Edwards JS & Palsson BO (2002) Escherichia
coli K-12 undergoes adaptive evolution to achieve
in silico predicted optimal growth. Nature 420, 186–189.
7 Almaas E, Kovacs B, Vicsek T, Oltvai ZN & Barabasi
AL (2004) Global organization of metabolic fluxes in
the bacterium Escherichia coli. Nature 427, 839–843.
8 Stucki JW (1980) The optimal efficiency and the econo-
mic degrees of coupling of oxidative phosphorylation.
Eur J Biochem 109, 269–283.
9 Soboll S & Stucki JW (1985) Regulation of the degree
of coupling of oxidative phosphorylation in intact rat
liver. Biochim Biophys Acta 807, 245–254.
10 Stucki JW & Walter P (1972) Pyruvate metabolism in
mitochondria from rat liver. Measured and computer-
simulated fluxes. Eur J Biochem 30, 60–72.
11 Stucki JW (2004) Chromokinetics of metabolic path-
ways. Eur J Biochem 271, 2745–2754.
12 Clarke BL (1980) Stability of complex reaction net-
works. In Advances in Chemistry and Physics 43 (Prigo-
gine I & Rice SA, eds), pp. 1–215. Wiley, New York.
13 Urbanczik R & Wagner C (2005) An improved algo-
rithm for stoichiometric network analysis: theory and
applications. Bioinformatics 21, 1203–1210.
14 Schuster S, Fell DA & Dandekar T (2000) A general
definition of metabolic pathways useful for systemic
organization and analysis of complex metabolic path-
ways. Nature Biotech 18, 326–332.
15 Stucki JW (1978) Stability analysis of biochemical sys-
tems – A practical guide. Prog Biophys Mol Biol 33,
99–187.
16 Urbanczik R & Wagner C (2005) Functional stoichio-
metric analysis of metabolic networks. Bioinformatics
21, 4176–4180.
17 Klamt S & Stelling J (2002) Combinatorial complexity
of pathway analysis in metabolic networks. Mol Biol
Reports 29, 233–236.
J. W. Stucki and R. Urbanczik Pyruvate metabolism in rat liver mitochondria
FEBS Journal 272 (2005) 6244–6253 ª 2005 FEBS No claim to original US government works 6253