- Trang chủ >>
- Khoa Học Tự Nhiên >>
- Vật lý
Optical spectroscopy of silicon nanowires
Bạn đang xem bản rút gọn của tài liệu. Xem và tải ngay bản đầy đủ của tài liệu tại đây (261.28 KB, 4 trang )
Optical spectroscopy of silicon nanowires
Jifa Qi
a,
*
, John M. White
a
, Angela M. Belcher
a
, Yasuaki Masumoto
b
a
Department of Chemistry and Biochemistry, University of Texas, Welch 4.212, Austin, TX 78712, USA
b
Institute of Physics, University of Tsukuba, Tsukuba, Ibaraki 305, Japan
Received 16 December 2002; in final form 13 March 2003
Abstract
Silicon nanowires (SiNWs) were prepared by laser ablation at high temperature and studied by electron microscopy
and optical spectroscopy. As-synthesized SiNWs are found orderly aligned on the silica substrates, exhibiting uniform
shape with a silicon crystalline core and an amorphous silicon oxide sheath. Asymmetrically broadened Raman spectral
peaks downshifted from 520 cm
À1
were observed, which related to the confinement effects of optical phonon by
nanowire boundaries. The SiNWs showed strong photoluminescence (PL) bands peaked at 455 and 525 nm, which
quenches rapidly with an increase in temperature and may arise from the defects surrounding the silicon nanowire
crystalline core.
Ó 2003 Elsevier Science B.V. All rights reserved.
Si nanowires (SiNWs) are expected to exhibit
potentially useful electrical, optical, mechanical,
and chemical properties due to their small di-
mensions, unique shapes, and high surface-to-
volume ratio. The recent progress in large-scale
production of uniform and thin SiNWs has at-
tracted investigation interests of the quantum
confinement properties and potential applications
of SiNWs [1–6]. Several researchers have reported
photoluminescence (PL) from the SiNWs of as-
grown and oxidized samples at room temperature
[5,6]. They ascribed the observed red, green and
blue PL peaks at 816, 470 and 420 nm to the
quantum confinement effects and the recombina-
tion emissions from the defect centers, respec-
tively. Since the studies of PL behavior at low
temperature, and the temperature dependence are
important to understand the mechanism of the
luminescence, we will report in this Letter the
optical spectroscopic properties of the SiNWs
synthesized by laser ablation at high temperature,
including the Raman scattering behavior and the
temperature dependence of PL.
The synthesis of the SiNWs was carried out by
laser ablation of a mixed target of silicon powder
(99.999 wt%) and nanosized iron powder (99.9
wt%). Typical molar ratio for Si to Fe was 0.95–
0.05. A quartz tube was mounted inside a high-
temperature 50 cm tube furnace. The target was
placed in the center of the quartz tube, which was
evacuated by a mechanical rotary pump to a
pressure of 1 Pa. High-purity argon was then
Chemical Physics Letters 372 (2003) 763–766
www.elsevier.com/locate/cplett
*
Corresponding author. Present address: Department of
Material Science and Engineering, Massachusetts Institute of
Technology, 77 Massachusetts Ave., #16-244, Cambridge, MA
02139, USA. Fax: +6173243300.
E-mail address: (J. Qi).
0009-2614/03/$ - see front matter Ó 2003 Elsevier Science B.V. All rights reserved.
doi:10.1016/S0009-2614(03)00504-9
passed through the quartz tube at a flow rate of
50–100 standard cubic centimeters per second
(sccm). A pulsed XeCl excimer laser (308 nm, pulse
repetition 10 Hz, energy 170 mJ; Lambda Physik
product) was used to ablate the target for 3 h while
the furnace temperature was kept at 1200 °C. The
product was collected from the silica tube wall. A
Hitachi H9000 and a JEOL 2010 transmission
electron microscopes (TEM) working at 200 kV
were used to characterize the products.
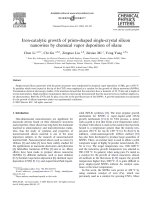
Fig. 1 shows the typical electron microscopic
image of the morphology of the SiNWs. It was
observed that the product exemplified high purity
with a uniform diameter 20 nm and consisted of
most of the SiNWs aligning on the substrate. Fig.
2 shows a high resolution TEM (HRTEM) image
of a single SiNW with a diameter of about 18 nm.
The (1 1 1) lattice fringes with the interplanar
spacing of 0.31 nm and the corresponding selected
area electron diffraction (SAED) patterns show the
SiNW consisted of a crystalline Si structure. Ad-
ditionally, there is a thin amorphous silicon oxide
layer (about 3 nm) sheathing the crystalline core of
the SiNW. The sheath of SiO
2
is determined by the
X-ray photon emission spectral measurements.
The optical properties of SiNWs depend on
their nanosized crystallites and the surrounding
oxide layers. Raman scattering spectra of SiNWs
were recorded on a Jasco NRS-1800 Raman
spectrometer in the back-scattering configuration,
using a 514.5 nm line of Ar
þ
laser at normal in-
cidence. The Raman scattered light was dispersed
by a triple-monochromator and recorded by a li-
quid nitrogen-cooled CCD detector. To avoid the
laser-induced thermal effects, the exciting laser
power was kept below 0.1 mW on the sample.
Fig. 3 shows the Raman scattering spectra of the
SiNWs and crystal silicon. A very sharp and
Fig. 1. A typical SEM image of the morphology of aligned
silicon nanowires of uniform diameter distribution on a silica
substrate.
Fig. 2. A HRTEM image of a single SiNW. Two-dimensional
(1 1 1) lattice fringes can be seen, and a thin amorphous oxide
layer surrounds the crystalline core. The inset shows the cor-
responding SAED pattern.
Fig. 3. Raman spectra at room temperature of a single crys-
talline silicon (thick solid line), SiNWs (dotted line) and the
theoretical fitting results (thin solid line). The power output of
laser at samples is about 70 W/cm
2
.
764 J. Qi et al. / Chemical Physics Letters 372 (2003) 763–766
intense Raman line at 520 cm
À1
with the full width
at half maximum (FWHM) of 4:7cm
À1
was wit-
nessed in the Raman spectrum of crystal Si. This
peak corresponds to the degenerate zone-center
optical phonon mode of crystal Si. All SiNW
samples exhibit similar Raman spectral peaks red-
shifted from 520 cm
À1
and a small shoulder at
495 cm
À1
. The main peak near 520 cm
À1
corre-
sponds to the first-order optical phonon of crys-
talline Si. The small broad peak at 495 cm
À1
was
attributed to the amorphous silicon that covers
SiNWs or distributed on the silica substrate, which
has a Raman structure between 400 and 550 cm
À1
peaked at 480 cm
À1
[7]. Asymmetrically broadened
and frequency downshifted line shapes are usually
observed in nanocrystalline and related to phonon
confinement effects by nanocrystallite boundaries,
hence the average crystallite size was estimated
according to the strong phonon confinement model
[8]. The Raman intensity profile can be written as
IðxÞ¼
Z
1
0
expðÀqD=2pÞ
2
dq
3
ðx À xðqÞÞ
2
þðC
0
=2Þ
2
; ð1Þ
where xðqÞ is the phonon dispersion function, q is
the normalized phonon momentum, C
0
is the
natural phonon linewidth of crystalline silicon,
and D is the size of crystal. Eq. (1) was used to fit
the Raman spectra. The continuous line in Fig. 3
shows the best-fit result, and the average crystal
size of nanowires D ¼ 11:3 nm was obtained, as
shown in Fig. 3. The good agreement in spectral
features between experimental and calculated Ra-
man spectra indicates that the identification of the
Raman peak of SiNW is correct. However, the
diameters determined by Raman scattering mea-
surements were smaller than that obtained from
SEM and TEM observation. The reasons for this
disparity are considered below. First, only the
crystallite contributes to the main Raman scat-
tering peaks, our nanowires are capped by the
amorphous oxide layer and amorphous silicon,
their contributions to the Raman spectra were not
calculated. Second, the existence of defects and
stresses in SiNWs can have a profound influence
on the Raman spectra of SiNWs.
The PL measurements have been performed by
an experimental setup consisting of the excitation
source of a He–Cd laser (325 nm) and a 27.5 cm
monochromator equipped with a liquid nitrogen
cooled CCD detector. In order to investigate the
PL as a function of temperature, samples were
placed in a temperature-variable cryostat. The PL
spectra were measured at temperatures ranging
from 10 to 300 K. Fig. 4 shows the PL spectra of
SiNWs at different temperatures. Two strong
emission bands in the green and blue regions re-
vealed peaking at 455 and 525 nm at low temper-
ature, respectively. The band that peaked at 455
nm is close to the observation results on the silica
nanowires [5] that was ascribed to originate from
the oxygen vacancies, while the band peaked at
525 nm is close to the results reported for as-grown
silicon nanowires [6]. According to theoretical
prediction, visible light emission due to size con-
finement can occur only when the mean size of the
Si crystalline is less than that of free exciton of
silicon. Therefore, these two peaks are not con-
sidered to be due to the quantum confinement ef-
fect. Instead, Yu et al.Õs explanation that the green
and blue PL emissions come from the radiative
recombination from the defect centers in the over-
coated silicon oxide layer and the interface be-
tween crystalline core and amorphous sheath
layer, such as oxygen vacancies [9], seems to agree
with this observation.
The inset curve in Fig. 4 shows the integrated
PL intensity of SiNWs as a function of tempera-
Fig. 4. PL spectra of SiNWs at different temperatures. Inset is a
temperature dependence of integrated PL intensity versus
temperature. The solid line shows the fit results.
J. Qi et al. / Chemical Physics Letters 372 (2003) 763–766 765
ture. The PL intensities decrease rapidly with an
increase of temperature. The thermal quenching of
the luminescence is considered to originate from
the thermal ionization of electrons or holes trap-
ped on the defect centers in the sheath or interface
layer. On the basis of two thermally activated non-
radiative recombination model, the temperature
dependence of the luminescence intensity can be
simply written by [10]
IðT Þ¼
I
0
1 þ C
A
expðÀE
A
=kT ÞþC
B
expðÀE
B
=kT Þ
;
ð2Þ
E
A
and E
B
are thermal activation energies of cen-
ters A and B, respectively, while C
A
and C
B
are
temperature-independent factors. The fit result by
using Eq. (2) presented by the solid line in the inset
of Fig. 4 shows a good coincidence with the ex-
periment results. The best-fit parameters are
E
A
¼ 20 meV and E
B
¼ 104 meV, respectively. The
E
A
value is very close to the binding energy of
excitons in silicon. The related PL thermal
quenching process can be considered to be a de-
crease of luminescent carriers due to the thermally
induced exciton ionization in the SiNW. E
B
may be
related to the deep trap states. The related PL
thermal quenching process can be considered in
terms of excited carriers that are trapped by the
defect levels and relaxed to the ground state
through a non-radiative process causing the de-
crease of luminescence with an increase in tem-
perature. Thus, the excitation process of the
observed luminescent centers in a SiNW is con-
sidered as light-created excited carriers in the
SiNW and the carriers are trapped at the defect
centers and relaxed to the ground state by radia-
tive and non-radiative processes.
In conclusion, SiNWs were synthesized by laser
ablation at high temperature. The typical SiNW
exhibits a uniform shape of silicon crystallite
sheathed by an amorphous silicon oxide layer. A
downshifted and broadened Raman spectral peak
was observed, which is related to the confinement
effects of optical phonons by the nanowire
boundaries. SiNWs emit green and blue light un-
der ultraviolet photoexcitation. The green and
blue bands are related to the radiative recombi-
nation of the defect centers in the outer oxide layer
of the SiNWs. The luminescence quenches rapidly
with an increase of temperature.
Acknowledgements
The authors would like to thank the Research
Center for Advanced Carbon Materials, AIST, for
use of the micro-Raman spectrometer instrument.
References
[1] M. Morales, C.M. Lieber, Science 279 (1998) 208.
[2] D.P. Yu, C.S. Lee, I. Bello, X.S. Sun, Y.H. Tang, G.W.
Zhou, Z.G. Bai, Z. Zhang, S.Q. Feng, Solid State
Commun. 105 (1998) 403.
[3] Y.F. Zhang, Y.H. Zhang, N. Wang, D.P. Yu, C.S. Lee,
I. Bello, S.T. Lee, Appl. Phys. Lett. 72 (1998) 1835.
[4] J. Qi, Y. Masumoto, Mater. Res. Bull. 36 (2001) 1407.
[5] D.P. Yu, Q.L. Hang, Y. Ding, H.Z. Zhang, Z.G. Bai, J.J.
Wang, Y.H. Zou, W. Qian, G.C. Xiong, S.Q. Feng, Appl.
Phys. Lett. 73 (1998) 3076.
[6] Z.G. Bai, D.P. Yu, J.J. Wang, Y.H. Zou, W. Qian, J.S. Fu,
S.Q. Feng, J. Xu, L.P. You, Mater. Sci. Eng. B 72 (2000)
117.
[7] Z. Iqbal, S. Vep
rrek, J. Phys. C 15 (1982) 377.
[8] I.H. Campbell, P.M. Fauchet, Solid State Commun. 58
(1986) 739.
[9] H. Nishikawa, T. Shiroyama, R. Nakamura, Y. Ohki, K.
Nagasawa, Y. Hama, Phys. Rev. B 45 (1992) 586.
[10] G. Davies, Phys. Rep. 176 (1989) 83.
766 J. Qi et al. / Chemical Physics Letters 372 (2003) 763–766