- Trang chủ >>
- Khoa Học Tự Nhiên >>
- Vật lý
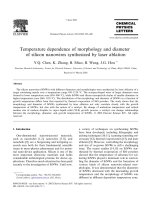
Temperature dependence of the quality of silicon nanowires produced over a titania supported gold catalyt
Bạn đang xem bản rút gọn của tài liệu. Xem và tải ngay bản đầy đủ của tài liệu tại đây (361.94 KB, 7 trang )
Temperature dependence of the quality of silicon
nanowires produced over a titania-supported gold catalyst
Nataphan Sakulchaicharoen, Daniel E. Resasco
*
School of Chemical Engineering and Materials Science, University of Oklahoma, 100 East Boyd St., Norman OK 73019, USA
Received 11 May 2003; in final form 8 July 2003
Published online: 30 July 2003
Abstract
Silicon nanowires (SiNW) have been prepared at different temperatures by chemical vapor deposition of silane over
a titania-supported Au catalyst. It was found that the SiNW produced at 500 °C have a well-crystallized silicon core
with a very thin amorphous silicon dioxide outer layer. At temperatures lower or higher than 500 °C, both yield and
quality greatly decrease. Different controlling rate-limiting steps are proposed to explain the difference in quantity and
quality of the products obtained as a function of temperature.
Ó 2003 Elsevier B.V. All rights reserved.
1. Introduction
Silicon nanowires (SiNWs) have been widely
studied because of their unique growth behavior,
their electrical and mechanical properties proper-
ties, as well as their potential applications in
nanoelectronic devices and circuits [1–3]. Several
synthesis methods have been reported in the liter-
ature including laser ablation [1,4,5], chemical
vapor deposition [3,6–13], and thermal evapora-
tion [14–17]. Among these synthesis methods, the
most widely used has been chemical vapor depo-
sition (CVD), whose production mechanism has
been explained in terms of a vapor–liquid–solid
(VLS) growth model. In this mechanism, the role
of the metal catalyst is to form a liquid alloy
droplet of relatively low solidification temperature
[6]. Gold has been generally used in this process
because the Au–Si alloy has a low eutectic tem-
perature in which a silicon-rich eutectic alloyed is
formed. Therefore, the process can take place at
temperatures lower than those by laser ablation or
thermal evaporation. Besides gold, other metals
such nickel and iron have been used as catalysts in
the CVD method. For instance Zhang et al. [3]
used a thin Ni film to obtained silicon nanowires.
In that particular case, the optimum reaction
temperature was 900 °C which is close to the eu-
tectic temperature of the Si/Ni system (966 °C). In
the case of iron, Liu et al. [11] used a porous Fe/
SiO
2
catalyst prepared by a sol–gel process and
reported that very straight silicon nanowires could
be produced at 500 °C. The silicon sources that are
usually used for the CVD process are silane (SiH
4
)
Chemical Physics Letters 377 (2003) 377–383
www.elsevier.com/locate/cplett
*
Corresponding author. Fax: +1-405-325-5813.
E-mail address: (D.E. Resasco).
0009-2614/$ - see front matter Ó 2003 Elsevier B.V. All rights reserved.
doi:10.1016/S0009-2614(03)01187-4
and silicon tetrachloride (SiCl
4
). Westwater et al.
[7,8] have reported that the use of silane as Si
source to prepare silicon nanowires via CVD yields
much thinner nanowires than the ones produced
from SiCl
4
[3,6]. Furthermore, silane is easily de-
composed at lower temperature than SiCl
4
so the
synthesis reaction can be carried out at relatively
low temperatures [3,7,8].
For a long time, gold has been considered a
catalytically inactive metal. However, recent
studies [18,19] have shown that its reactivity can be
drastically altered when it is in the form of very
small clusters and supported on a suitable sub-
strate. Highly dispersed Au supported on titania,
alumina, or other supports exhibits a very high
activity for several reactions. One of the supports
used that have resulted in the greatest activity
enhancement as been titania, TiO
2
[20–22]. In the
production of Si nanowires, we may expect that
the decomposition of the silane precursor can be
accelerated by the presence of a catalytic surface.
Therefore, it is important to investigate the pro-
duction of Si nanowires on a catalyst such as Au/
TiO
2
, which has shown enhanced catalytic activity.
Most CVD nanowire growth procedures re-
ported in the literature have focused on flat sub-
strates, over which catalytic particles have been
deposited. The present contribution reports the
growth of silicon nanowires by silane CVD on Au-
containing porous TiO
2
powders of high-surface
area. In this report, the catalyst was prepared by
the incipient wetness impregnation technique,
which is perhaps the simplest method for catalysts
preparation. The growth temperature has been
varied from 300 to 600 °C in order to find the
optimum conditions for SiNWs growth. The
product was characterized by TEM and SEM
electron microscopy combined with Raman and
X-ray photoelectron spectroscopies (XPS). The
fresh catalyst and product synthesized at 600 °C
were also characterized by EXAFS.
2. Experimental
Silicon nanowires were prepared by chemical
vapor deposition of silane on a 1 wt% Au/TiO
2
catalyst, synthesized by incipient wetness impreg-
nation of AuCl
3
onto calcined TiO
2
(surface area
50 m
2
/g). After impregnation, the catalyst was
dried at 120 °C and then reduced in hydrogen flow
at 200 °C for 2 h. The catalyst was then placed into
a quartz reaction cell, preheated at 200 °Cin
vacuum (pressure lower than 10
À3
Torr) for 1 h
and then further heated to the reaction tempera-
ture. When the temperature was stabilized, the
silane was fed into the reaction cell and kept for
30 min. The approximate pressure inside the
reactor was about 400 Torr.
Before the silane decomposition reaction, the
color of the catalyst was a light purple. After the
reaction, the sample treated at 500 °C displayed a
yellowish green. By contrast, those reacted at 300,
400, and 600 ° C were dark blue, almost black.
The products were examined by scanning elec-
tron microscopy on a SEM, JEOL JSM-880 and by
transmission electron microscopy on a TEM,
JEOL JEM-2000FX. Raman spectra of the Si de-
posits were obtained using a Jovin Yvon-Horiba
LabRam 800 equipped with a CCD detector with a
laser excitation source of 632 nm (He–Ne laser).
X-ray photoelectron spectroscopy (XPS) was con-
ducted on a Physical Electronics PHI 5800 ESCA
system equipped with monochromatic Al Ka
X-ray source to quantify the surface composition
and the oxidation state of the silicon product. The
binding energies were corrected by reference to the
C(1s) line at 284.5 eV. The fitting of the XPS
spectra and the quantification of the surface atomic
ratios were obtained with Gauss–Lorentz peaks,
using the MultiPak software from Physical Elec-
tronics. X-ray absorption characterization of fresh
and spent catalysts was conducted at the National
Synchrotron Light Source at Brookhaven National
Laboratory, using beam line X-18B equipped with
a Si (1 1 1) crystal monochromator. The X-ray ring
at the NSLS has an energy of 2.5 GeV and ring
current of 80–220 mA. The EXAFS experiments
were conducted in a stainless steel sample cell at
liquid nitrogen temperature.
3. Results and discussion
Within the range of reaction temperatures in-
vestigated, the sample obtained at 500 °C pro-
378 N. Sakulchaicharoen, D.E. Resasco / Chemical Physics Letters 377 (2003) 377–383
duced the highest density of Si nanowires with the
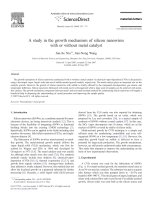
best structure. The SEM observations shown in
Fig. 1 illustrate the type of Si structures obtained
in this sample. It can be observed that large
quantities of SiNWs are formed over the Au/TiO
2
catalyst at 500 °C. The SEM micrographs also
show that these nanowires have a very high aspect
ratio, with lengths ranging from 10 to 40 lmand
diameters in the range 8–35 nm. The TEM analysis
of this sample further demonstrated the high uni-
formity of the nanowires along their axis. As seen
in Fig. 2, almost the full body of the nanowire is
well-crystallized silicon while a very thin amor-
phous layer (thinner than about 3 nm) covers the
surface. In the inset, the electron diffraction pat-
tern is included. This perfect pattern indicates that
the nanowire is essentially a Si single crystal. As
shown below, a small amount of silicon oxide was
detected by XPS. This oxide may be the thin
amorphous layer that cover the surface of the
nanowires.
To compare the structure of the Si deposits
produced at different temperatures, we analyzed
the various products by SEM. As illustrated in
Fig. 3, striking differences are observed as a func-
tion of the reaction temperature. In contrast with
the high density of well-structured nanowires ob-
tained at 500 ° C, very low densities were observed
at either lower (400 °C) or higher temperatures
(600 °C). No SiNW were observed after reaction at
300 °C.
To obtain a more quantitative comparison
of the density of SiNW left on the catalyst sur-
face after reaction at different temperatures, the
Fig. 1. SEM micrograph of silicon nanowires produced at 500 °C over a titania supported gold catalyst.
N. Sakulchaicharoen, D.E. Resasco / Chemical Physics Letters 377 (2003) 377–383 379
samples were analyzed by XPS. The XPS intensity
ratio of Si (2p) to Ti (2p
3=2
+2p
1=2
) can be taken as
a relative measure of the Si nanowire density. The
results shown in Fig. 4 are in perfect agreement
with the SEM observations. The maximum Si/Ti
ratio was obtained on the sample prepared at 500
°C, with much lower values for those prepared at
either lower or higher temperatures. At the same
time, to evaluate the degree of Si oxidation on the
four samples after exposure to air at ambient
temperature, the ratio of metallic Si to oxidized Si
was obtained from the XPS spectra. This ratio was
calculated by fitting the Si signal using two dif-
ferent Gaussian components, one corresponding
to Si
0
(E
B
¼ 99 eV) and the other one to Si
þ4
(E
B
¼ 103 eV). Again, in agreement with the TEM
observations, the sample produced at 500 °C
showed a much lower degree of oxidation than the
other samples. The high Si/Si
þ4
ratio on the sample
obtained at this temperature reveals that the
SiNWs are composed mostly of silicon with a
small contribution from silicon oxide. At 300, 400,
and 600 °C the Si/Si
þ4
ratio greatly decreases. It
may be expected that, under these non-optimal
conditions, more amorphous Si deposits are
formed, which are therefore more prone to oxi-
dation. It is also interesting to notice that the Si/
Si
þ4
ratio for the product obtained at 600 °Cis
slightly higher than those obtained below 500 ° C.
Raman spectroscopy was employed to further
characterize the different products obtained in this
study. Fig. 5 shows the Raman spectra for the
samples obtained at the four different tempera-
tures. Since both, the bare catalyst and the product
may generate Raman bands, the spectra of a ref-
erence silicon wafer and that of the fresh catalyst
are included in the figure. The spectrum for the
fresh catalyst reveals the presence of broad bands
at 400, 516, and 639 cm
À1
, while the silicon wafer
shows a sharp and symmetric peak at 520.5 cm
À1
.
Therefore, the band at 518 cm
À1
observed on the
product obtained at 500 °C can be ascribed to Si
deposits. The observed downshift is indeed signif-
icant, reproducible, and has been previously ob-
served. A downshift respect to the Si wafer has
been consistently observed and attributed to the
quantum confinement of the SiNW structure
[11,12,15,23,24].
It is very interesting to note that the band at
518 cm
À1
was only observed on the product gen-
erated at 500 °C. The materials produced under
other reaction temperatures (300, 400, and 600 °C)
had the Si band located at 516 cm
À1
. In agreement
with the observations from the other techniques,
the material obtained at 300 °C gave a very weak
Si signal, and overlapped with the spectra of the
fresh catalyst, indicating a low yield of metallic Si.
Another interesting variation in the Raman was
observed when the power of the laser energy was
varied, while keeping the excitation wavelength
constant. It was found that the Raman band
(Fig. 5b) obtained using a high laser power
(3.0 mW) was more asymmetric and broader than
that obtained with a lower laser power (0.3 mW).
When the laser power was increased, the position
of the 518 cm
À1
band was shifted to 513 cm
À1
. This
phenomenon has been previously reported and it
has been ascribed to nanowire heating by the laser
Fig. 2. TEM micrograph of silicon nanowires produced at
500 °C over a titania supported gold catalyst.
380 N. Sakulchaicharoen, D.E. Resasco / Chemical Physics Letters 377 (2003) 377–383
beam. The change in the symmetry of the peak has
been explained in terms of a Fano interference
between scattering from the k ¼ 0 optic phonon
and laser-induced electronic continuum electron
scattering in the conduction band [24]. Therefore,
both band shift by heating and the asymmetry of
the band are fingerprints of Si nanowires.
To explain the strong dependence of the Si
nanowire yield and reaction temperature reported
in this work, one needs to consider the plausible
growth mechanism. Since the Au–Si system has a
eutectic point at relatively low temperatures and Si
concentrations. The eutectic of a Si–Au mixture is
determined by the composition of X% SI Y% Au
and temperature of 363 °C. It is expected that at
Fig. 3. SEM images of different silicon containing products obtained at four different reactions temperatures: (a) 300 °C, (b) 400 °C,
(c) 500 °C, and (d) 600 °C.
Fig. 4. Si/Ti surface atomic ratio (diamonds) and Si
0
to Si
þ4
surface atomic ratio (squares) as calculated from XPS analysis
of the Si 2p and Ti 2p lines.
N. Sakulchaicharoen, D.E. Resasco / Chemical Physics Letters 377 (2003) 377–383 381
least a fraction of the supported gold will be in the
molten state under most of the reaction conditions
employed in this work. Therefore, the so-called
VLS model could be evoked again to describe the
SiNW growth process. According to the VLS
model the growth of crystalline Si nanowire should
take place in a sequence of steps that includes
the catalytic decomposition of the SiH
4
over Au,
followed by dissolution of Si into the molten sili-
con–gold solution and precipitation at the other
end of the droplet in the form of crystalline Si.
Depending on the reaction conditions any of these
steps could be the rate-limiting. Since chemical
reactions typically require a high energy of acti-
vation, one may expect a sharp (i.e., exponential)
variation with temperature for the rate of silane
decomposition. Conversely, the rate of diffusion is
typically a less pronounced variation with tem-
perature (i.e., square root). At low temperatures,
the rate of decomposition may become very low
and consequently limiting step of the overall
growth rate. Under those conditions, the rate of
SiNW growth would be low, but as the tempera-
ture increases, the growth would quickly increase
until the rate of decomposition and diffusion be-
come comparable. At even higher temperatures,
the rate of decomposition becomes much higher
than the rate of diffusion. As a result, Si may ac-
cumulate in high concentrations at the Au surface,
causing the encapsulation of the particle with little
growth of SiNW. At the same time, when the
temperatures are exceedingly high, sintering of
the Au nanoclusters may occur, which would also
limit the nanowire growth and promote encapsu-
lation. EXAFS was used to characterize the cata-
lyst, both as a fresh catalysts and after reaction at
600 °C. It was observed that the magnitude of the
Fourier Transform for the Au–Au bonds, corre-
sponding to the spent sample was 15% higher than
that of the fresh catalyst, indicating that the spent
catalyst has Au particles larger than those in the
fresh catalyst, which shows that some sintering of
the Au clusters occurs under reaction at high
temperature.
4. Conclusions
The production of silicon nanowires via chem-
ical vapor deposition of silane over gold supported
on TiO
2
catalyst has been investigated at varying
temperatures. It was found that the optimum re-
action temperature is 500 °C. Silicon nanowires
produced at this temperature have a well-crystal-
lized silicon core with a very thin amorphous sili-
con dioxide outer layer. The length of the
nanowires is in the range of 10–40 lm. At lower
temperatures, nanowires are produced in lower
yields and with lower quality than those obtained
at the optimum temperature (500 °C). Similarly, at
temperatures higher than the optimum, lower
yields and quality were obtained. The appearance
of an optimum temperature is due to a change in
rate limiting step in the growth process.
Fig. 5. Upper panel: Raman spectra of the silicon nanowires
produced at four different temperatures. Raman spectra of sil-
icon wafer and of the fresh Au/TiO
2
catalyst are also included
for comparison. Lower panel: Raman spectra of silicon nano-
wires obtained at 500 °C using two different 633 nm laser
powers: 3.0 mW (solid line) and 0.3 mW (thick solid line).
382 N. Sakulchaicharoen, D.E. Resasco / Chemical Physics Letters 377 (2003) 377–383
Acknowledgements
This research was conducted with financial
support from the Department of Energy, Office of
Basic Energy Sciences (Grant No. DE-FG03-
02ER15345). We also acknowledge Dr. Zhongrui
Li and Dr. Guoda Lian for helping in the analysis
of EXAFS and TEM, respectively.
References
[1] A.M. Morales, C.M. Lieber, Science 279 (1998) 208.
[2] A.P. Alivisatos, Science 271 (1996) 933.
[3] Y. Zhang, Q. Zhang, N. Wang, Y. Yan, H. Zhou, J. Zhu,
J. Cryst. Growth 226 (2001) 185.
[4] N. Wang, Y.H. Tang, Y.F. Zhang, C.S. Lee, S.T. Lee,
Phys. Rev. B 58 (1998) R16024.
[5] Y.F. Zhang, Y.H. Tang, N. Wang, C.S. Lee, I. Bello, S.T.
Lee, J. Cryst. Growth 197 (1999) 136.
[6] R.S. Wagner, W.C. Ellis, Appl. Phys. Lett. 4 (1964) 89.
[7] J. Westwater, D.P. Gosain, S. Tomiya, S. Usui, J. Vac. Sci.
Technol. B 15 (1997) 554.
[8] J. Weatwater, D.P. Gosain, S. Usui, Phys. Stat. Sol. 165
(1998) 37.
[9] N. Ozaki, Y. Ohno, S. Takeda, Appl. Phys. Lett. 73 (1998)
3700.
[10] Y. Cui, L.J. Lauhon, M.S. Gudiksen, J. Wang, C.M.
Lieber, Appl. Phys. Lett. 78 (2001) 2214.
[11] Z.Q. Liu, S.S. Xie, W.Y. Zhou, L.F. Sun, Y.B. Li, D.S.
Tang, X.P. Zou, C.Y. Wang, G. Wang, J. Cryst. Growth
224 (2001) 230.
[12] J. Niu, J. Sha, X. Ma, J. Xu, D. Yang, Chem. Phys. Lett.
367 (2003) 528.
[13] Z.Q. Liu, W.Y. Zhou, L.F. Sun, D.S. Tang, X.P. Zou, Y.B.
Li, C.Y. Wang, G. Wang, S.S. Xie, Chem. Phys. Lett. 341
(2001) 523.
[14] H.Y. Peng, Z.W. Pan, L. Xu, X.H. Fan, N. Wang, C.S.
Lee, S.T. Lee, Adv. Mater. 13 (2001) 317.
[15] D.P. Yu, Z.G. Bai, Y. Ding, Q.L. Hang, H.Z. Zhang, J.J.
Wang, Y.H. Zou, W. Qian, G.G. Xiong, H.T. Zhou, S.Q.
Feng, Appl. Phys. Lett. 72 (1998) 3458.
[16] X.H. Fan, L. Xu, C.P. Li, Y.F. Zheng, C.S. Lee, S.T. Lee,
Chem. Phys. Lett. 334 (2001) 229.
[17] C.P. Li, X.H. Sun, N.B. Wong, C.S. Lee, S.T. Lee, B.K.
Teo, Chem. Phys. Lett. 365 (2002) 22.
[18] M. Haruta, Catal. Today 36 (1997) 153.
[19] G.C. Bond, D.T. Thompson, Catal. Rev. Sci. Eng. 41
(1999) 319.
[20] C. Mohr, H. Hofmeister, P. Claus, J. Catal. 213 (2003) 86.
[21] X-F. Lai, D.W. Goodman, J. Mol. Catal. A 162 (2000) 33.
[22] T. Akita, M. Okumura, K. Tanaka, M. Haruta, J. Catal.
212 (2002) 119.
[23] J. Qi, J.M. White, A.M. Belcher, Y. Masumoto, Chem.
Phys. Lett. 372 (2003) 763.
[24] R. Gupta, Q. Xiong, C.K. Adu, U.J. Kim, P.C. Eklund,
Nano Lett. 3 (2003) 627.
N. Sakulchaicharoen, D.E. Resasco / Chemical Physics Letters 377 (2003) 377–383 383