- Trang chủ >>
- Khoa Học Tự Nhiên >>
- Vật lý
Interplay between phonon confinement effect and anharmonicity in silicon nanowires
Bạn đang xem bản rút gọn của tài liệu. Xem và tải ngay bản đầy đủ của tài liệu tại đây (308.74 KB, 3 trang )
Physica E 38 (2007) 109–111
Interplay between phonon confinement effect and anharmonicity in
silicon nanowires
M.J. Konstantinovic
´
a,b,Ã
a
SCK CEN, Studiecentrum voor Kernenergie/Centre d’Etude de l’Energie Nucle
´
aire, Boeretang 200, B-2400 Mol, Belgium
b
Institute of Physics, P.O. Box 68, 11080 Belgrade, Serbia
Available online 16 December 2006
Abstract
Getting light out of silicon is a difficult task since the bulk silicon has an indirect energy electronic band gap structure. It is expected
that this problem can be circumvented by silicon nanostructuring, since the quantum confinement effect may cause the increase of the
silicon band gap and shift the photoluminescence into the visible energy range. The increase in resulting structural disorder also causes
the phonon confinement effect, which can be analyzed with a Raman spectroscopy. The large phonon softening and broadening,
observed in silicon nanowires, are compared with calculated spectra obtained by taking into account the anharmonicity, which is
incorporated through the three and four phonon decay processes into Raman scattering cross-section. This analysis clearly shows that
the strong shift and broadening of the Raman peak are dominated by the anharmonic effects originating from the laser heating, while
confinement plays a secondary role.
r 2007 Elsevier B.V. All rights reserved.
PACS: 78.30.Am; 78.20.Àe; 78.66.Db
Keywords: Nanowires; Silicon; Raman
1. Introduction
For the past 10 years, researchers have tried to coax light
out of silicon, with varying degrees of success. The main
problem is that the indirect energy band gap electronic
structure of bulk silicon makes it not suitable for
optoelectronic applications. It is expected that this problem
can be circumvented by silicon nanostructuring, since the
quantum confinement effect may cause the increase in the
silicon band gap and shift the photoluminescence into the
visible energy range. The expectation that reducing
dimensions of silicon structures would turn this material
from indirect into direct band gap system triggered a lot of
research in the field of opt oelectronics. However, despite a
large amount of research, the exact origin of the increased
luminescence and a strong Raman phonon softening,
reported in previous works on Si clusters [1–8], are not
fully unde rstood. Recently, it was shown [12] that
anharmonicity, due to the local heating effect, represents
the main source of phonon softening and broadening,
while the phonon confinement plays a secondary role.
Here, I extend this investigation to the silicon nanowires,
reanalyze the local heating effect that is always present in
these kind of experiments, and compare the results with
those in silicon nanoclusters.
2. Experiment
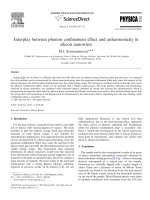
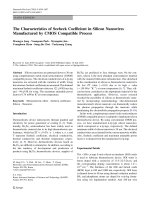
The sample used in this investigation is made of an array
of silicon nanowires (nanopillars, nanorods) obtained by
electrochemical etching process [9]. Fig. 1 shows a scanning
electron micrograph of a typical part of the sample.
Nanowires are vertically aligned with a typical length of
about 10 mm and a diameter of about 50–500 nm. Some
nanorods are found to be detached from the non-reacted
part of the silicon crystal, lying in the horizontal position
on the top of the sample. Micro-Raman spectra were taken
in ambient conditions with excitation from the 514.5 nm
ARTICLE IN PRESS
www.elsevier.com/locate/physe
1386-9477/$ - see front matter r 2007 Elsevier B.V. All rights reserved.
doi:10.1016/j.physe.2006.12.011
Ã
Institute of Physics, P.O. Box 68, 11080 Belgrade, Serbia.
Tel.: +381 11 3162190; fax: +381 11 3160346.
E-mail address:
line of an Ar laser, using powers at the sample surface that
varied from 10 to 500 mW. The Raman spectra were
measured in the backscattering configuration and analyzed
using a DILOR triple spectrometer with liquid-nitrogen-
cooled charge-coupled-device detector.
3. Results and discussion
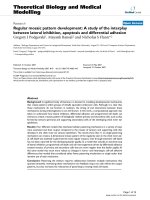
Fig. 2 shows typical Raman spectra taken from silicon
nanowires. A dramatic change in the spectra is observed
for the moderate increase in the laser power. There is a
strong red shift of the first-order phonon mode at
520 cm
À1
, which is accompanied by a substantial broad-
ening, as evident from a series of Stokes and anti-Stokes
Raman spectra taken with laser powers ranging from 10 to
500 mW. The softening and broadening are large, up to 30
and 20 cm
À1
, respectively. It can be also seen in Figs. 2 and
3 that the intensity ratio between the Stokes and anti-
Stokes part of the spectrum decreases as the laser power
increases. This implies that a dramatic change in the local
temperature of the nanowires takes place during the
measurements, as expected in micro-Raman experiments
where the laser light is focused on the micrometer-size area.
Typically, the silicon bulk samples do not exhibit any shifts
and broadening of the first-order phonon mode at
520 cm
À1
for the laser powers in the range used in
experiment. Moreover, the Raman spectra show the
existence of the symmetric phonon line shapes, regardless
of the frequency shifts and the bro adening. This observa-
tion is in clear contradiction with a strong asymmetric line
shape expected in the case of quantum phonon confine-
ment [10].
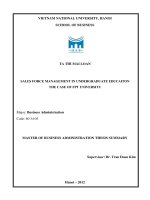
A comparison between calculated and measured Raman
spectra is shown in Fig. 3. The calculated curve is obtained
by taking the Lorentz line shape that includes the
anharmonic effects via three and four phonon decay
processes [11,12]:
oðk; TÞ¼oðkÞþDðTÞ,
DðTÞ¼A 1 þ
2
e
_o=2k
B
T
À 1
þ B 1 þ
3
e
_o=3k
B
T
À 1
þ
3
ðe
_o=3k
B
T
À 1Þ
2
,
oðkÞ¼
ffiffiffiffiffiffiffiffiffiffiffiffiffiffiffiffiffiffiffiffiffiffiffiffiffiffiffiffiffiffiffiffiffiffiffiffiffiffiffiffiffiffi
ð1:7 þ cosðpk=2ÞÞ10
5
q
,
where o(k) is the silicon phonon dispersion at 300 K. The
phonon line width is given by
GðTÞ¼C 1 þ
2
e
_o=2k
B
T
À 1
þ D 1 þ
3
e
_o=3k
B
T
À 1
þ
3
ðe
_o=3k
B
T
À 1Þ
2
,
where A, B, C and D are anharmonic constants. The
temperature difference between spectra 1 and 2 presented
ARTICLE IN PRESS
Fig. 1. Scanning electron microscopy picture of the Si-nanowires.
-540 -520 -500 -480 -460 460 480 500 520 540
Raman shift (cm)
-1
Laser power
Intensity (arb.units)
anti-Stokes
Stokes
Fig. 2. The Stokes and anti-Stokes Raman spectra of silicon nanowires
measured with different laser line power densities.
anti-Stokes
Fig. 3. The Stokes and anti-Stokes Raman spectra of silicon nanowires
measured at two different laser powers. The full lines are calculated
spectra.
M.J. Konstantinovic
´
/ Physica E 38 (2007) 109–111110
in Fig. 3 is estimated from the Stokes and anti-Stokes
intensity ratio to be around 600 K.
The agreement between calculation and experimental
data is very good, showing that the shift and broadening
arise mainly due to local laser heating effect. The expected
peak asymmetry, due to phonon confinement effect, is not
observed.
Similar results are obtained in the case of silicon
nanoclusters [12]. The small peak asymmetry observed in
the case of silicon nanoclusters at the low-frequency side of
the peak, is in the spectra of Fig. 3 represented by a low-
intensity hump. The fact that this feature is suppressed in
nanowires in comparison to nanoclusters suggests that it
might originate from the Raman scattering of amorphous
silicon. This can be understood as being the consequence of
the difference between the preparation techniques. The
silicon nanoclusters were produced by the laser vaporiza-
tion techn ique, which resulted in the formation of
nanoclusters on the top of the amorphous film. On the
other hand, the nanowires are produced by starting from
the silicon crystalline material (eching of the crystalline
bulk sample) so the amorphous signal is expected to be
much smaller.
The Raman spectra of silicon nanowires point to the
main problem related to the optical characterization of
nanostructures: the hea t dissipation during the experiment.
It is, however, expected that the heat dissipation depends
on the actual size of the wire. Moreover, the size
irregularity of the wire sample might enhance the
contribution of the anharmonic decay as well. In this type
of experiments, one usually measures the averaged signal
from various nano-sized structures, consistent with certain
temperature distribution for different wires. Because of
that, the question of individual wire contribution cannot be
addressed since the laser spot size is much larger than the
size of a single wire.
4. Conclusion
This work shows that strong anharmonic effects exist in
the silicon sample consisting of an array of nanowires. It is
found that the shift and broadening of the first-order
Raman peak are dominated by the local heating effect,
while the confinement plays a secondary role.
References
[1] L.T. Canham, Appl. Phys. Lett. 57 (1990) 1046.
[2] L.T. Canham, Phys. Stat. Sol. B 190 (1995) 9.
[3] M.V. Wolkin, et al., Phys. Rev. Lett. 82 (1999) 197.
[4] H. Richter, Z.P. Wang, L. Ley, Solid State Commun. 39 (1981) 625.
[5] Z. Iqbal, et al., Appl. Phys. Lett. 36 (1980) 163.
[6] Z. Sui, et al., Appl. Phys. Lett. 60 (1992) 2086.
[7] Y. Kanemitsu, et al., Phys. Rev. B 48 (1993) 2827.
[8] P. Mishra, K.P. Jain, Phys. Rev. B 62 (14) (2000) 790.
[9] S. Bersiere, et al., in preparation.
[10] R. Shuker, R.W. Gammon, Phys. Rev. Lett. 25 (1970) 222.
[11] M. Balkanski, R.F. Wallis, E. Haro, Phys. Rev. B 28 (1983) 1928.
[12] M.J. Konstantinovic, et al., Phys. Rev. B 66 (2002) 161311(R).
ARTICLE IN PRESS
M.J. Konstantinovic
´
/ Physica E 38 (2007) 109–111 111