- Trang chủ >>
- Khoa Học Tự Nhiên >>
- Vật lý
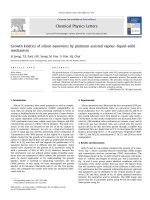
Investigation of capacitive humidity sensing behavior of silicon nanowires
Bạn đang xem bản rút gọn của tài liệu. Xem và tải ngay bản đầy đủ của tài liệu tại đây (654.15 KB, 5 trang )
Investigation of capacitive humidity sensing behavior of silicon nanowires
Huilin Li, Jian Zhang
Ã
, BaiRui Tao, LiJuan Wan, WenLi Gong
Department of Electronic Engineering, State Key Laboratory of Transducer Technology, East China Normal University, 500 Dongchuan Road, Shanghai 200241, China
article info
Article history:
Received 14 July 2008
Received in revised form
21 October 2008
Accepted 28 October 2008
Available online 18 November 2008
PACS:
71.15.Pd
71.20.Mq
73.21.Hb
73.63.Rt
Keywords:
Silicon nanowires
Humidity sensor
Relative humidity
Capacitance–frequency conversion
abstract
In this paper, the fabrication and the sensing characteristics of the humidity sensors based on the
electroless chemical deposition-etched silicon nanowires had been studied. The humidity sensors were
constructed by the selectively electrochemically etched silicon nanowires. The sensing mechanism is
based on the capacitance variations due to the adsorption/desorption of water vapor of silicon
nanowires. The frequency–capacitance conversion circuit had been set up to convert the capacitance
variation into the frequency shift. Labview system had been employed to monitor and record the
frequency. The study indicated that the humidity sensors had the simple structure and the high
performance such as the high sensitivity, the wide humidity detection range, the good stability and
repeatability.
& 2008 Elsevier B.V. All rights reserved.
1. Introduction
Recently, silicon nanowires (SiNWs) had attracted more and
more attention due to their potential applications in nanosensors
and nanoelectronics [1–5]. The studies had indicated that the
SiNWs had some favored qualities such as the big surface-to-
volume areas and the superior electrical properties which can be
modulated [6–8]. For example, SiNWs are a good candidate
sensing materials for gas sensors [9]. Besides the advantages
mentioned above, the fabrication process of SiNWs is also
compatible with an ordinary silicon production process [10].So
the integration of the SiNWs-based sensors and the integrated
circuits are possible. All these will greatly improve the sensor
performance. Although SiNWs are the potential materials for
sensing application, the research about the SiNWs-based humid-
ity sensor, to our knowledge, is seldom found. It has been
demonstrated that water adsorption increases the conductance
and the capacitance of porous silicon (PS) [11–15]. This is the basic
sensing mechanism for PS humidity sensors. A change in dielectric
constant, dipole moment and possible chemisorption or physi-
sorption on the surface of PS had been proposed to explain the
response [16]. Therefore, we postulated that the SiNWs should
exhibit the good humidity sensing behavior just as PS.
In this paper, the humidity sensing characteristics of SiNWs
prepared by the electrochemically etched method were studied.
And a novel capacitive humidity sensor based on the SiNWs was
fabricated. The sensing properties of SiNWs were studied.
2. Experiment
2.1. Preparation of silicon nanowire
The silicon nanowire was fabricated according to Ref. [17] using
a chemical etching procedure. The detailed process is as follow:
1.19 g AgNO
3
was dissolved in 100 ml distilled water under the
ultrasonic agitation. Then, 100 ml HF (20%) was added at room
temperature. The mixed solution was used as the etchant for
SiNWs preparation. The chemically cleaned silicon wafers were put
into the etchant. The etching time was kept $60 min in this study.
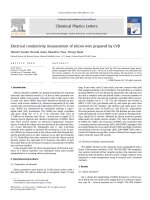
Fig. 1(a) is the top-view SEM picture of silicon nanowires as-
received and (b) is the cross-section SEM image. It is observed that
the silicon nanowires have been prepared on the substrate. They
are aligned perpendicularly to the bulk silicon substrate and their
average length is about 80
m
m. And the length of SiNWs can be
adjusted by controlling the proper etching time.
2.2. Sensor configuration
The humidity sensors were prepared from the silicon nano-
wires. Fig. 2 is the schematic diagram of the sensor. The humidity
sensors were constructed by glued two copper leading wires into
ARTICLE IN P RESS
Contents lists available at ScienceDirect
journal homepage: www.elsevier.com/locate/physe
Physica E
1386-9477/$ - see front matter & 2008 Elsevier B.V. All rights reserved.
doi:10.1016/j.physe.2008.10.016
Ã
Corresponding author.
E-mail address: (J. Zhang).
Physica E 41 (2009) 600–604
the surface of SiNWs structure. For all sensors, the distance
between two leading wires was kept at $3 mm.
Fig. 3 is the equivalent circuit model of the humidity sensor
constructed. In principle, the sensor can be simplified into the
parallel connection of a resistor R
b
, and lots capacitors C
xy
(1oxom and 1oyon). The reisistor R
b
represents the influence
of the silicon substrate. The substrate resistance is a constant
because it is hardly affected by outer moisture. And the capacitors
C
xy
represent the capacitances between two adjacent charged
individual nanowires. The total capacitance C
H
can be equivalent
to the sum of lots of capacitors (with capacitance C
xy
) in serial and
parallel connection:
Cn ¼ Cn1kCn2k Cnm (1)
C
H
¼ C1 þ C2 þ þ Cn (2)
If the capacitance between any two nanowires, C
xy
, is simplified
as a parallel plate capacitor, the capacitance can be expressed as
C
xy
¼
e
0
e
r
(A/d), where
e
0
is the vacuum dielectric constant,
e
r
the
relative dielectric constant between the nanowires, d the distance
between two nanowires, A the aligned area between two
nanowires, respectively. In our study, d and A are fixed. The water
vapor adsorbption onto the SiNWs can cause the variation of
e
r
and lead to the change of the capacitance since the relative
dielectric constant of water ($60) is larger than that of the air
($1).
2.3. System for humidity sensing detection
Fig. 4 shows the schematic diagram of the humidity detection
system. The system consisted of three parts: the data recording
system, the standard humidity generation and the 555 capaci-
tance–frequency conversion circuit. The LabView virtual instru-
ments DAQ PCI6221 (PCI6221, NI, USA) were used to collect the
output frequency of the 555 IC multivibrator circuit in real-time.
The controlled humidity environments were achieved using the
saturated aqueous solutions in a closed glass vessel at an ambient
temperature of 25 1C [18]. The 555 capacitance–frequency
conversion circuit can change the capacitance variations of the
sensors into the frequency shifts.
In the testing process, the humidity capacitive sensor was
incorporated into the 555 time-based circuit and acted as a
capacitor component. The capacitance variation of humidity
sensors due to water adsorption can be transformed to the
frequency shift. The fÀC
H
transformation equation is as follows:
F
o
¼
1:43
RC
H
ðHzÞ (3)
where C
H
is equivalent capacitance of the sensor, R the total
equivalent resistance and f the output frequency, respectively.
3. Results and discussion
The developed humidity sensors were tested in the home-
made system as previously mentioned. The performances of
sensors were characterized.
3.1. Humidity measurement
In this study, four humidity sensors based on SiNWs prepared
under different condition, denoted as samples 1–4, were tested.
For samples 1–3, the etching time for the SiNWs was 60, 50, and
45 min, implying the different dimension of SiNWs resulted,
respectively. After etching process, these three samples were
annealed at 100 1C for several times in order to form the native
oxide layer. For comparison, sample 4 was prepared under the
etching time of 60 min without further annealing process.
Fig. 5 is the frequency response curves of samples 1–4 with the
corresponding relative humidity level. The initial frequency (at
humidity of 11.3%RH) values are not different for four samples,
implying that the initial capacitance values of these sensors are
different. We can see that the output frequency values of the
sensors tended to decrease when the humidity level increased
from 11.3% to 98%. Nonlinear responses can be found for all
sensors. The sensitivity of the sensor can be denoted as the slope
for the response curves. We can find that the sample 1, with the
longer etching time, exhibited the bigger slope, i.e., the higher
sensitivity, À133.29 Hz/RH while for the unannealing sample 4,
the sensitivity was low, À71.15 Hz/RH. The negative sensitivity
ARTICLE IN P RESS
Fig. 1. SEM pictures of silicon nanowires (a) top-view image and (b) cross-section
image.
Fig. 2. Principle model of humidity sensor developed.
H. Li et al. / Physica E 41 (2009) 600 –604 601
values indicated that the output frequency decreased with the
increasing humidity. The results indicated that the annealing
process is benefic to enhance the sensor sensitivity. This can be
explained by the fact that the annealing process under high
temperature is beneficial to form the native silicon oxide layer and
the oxidized SiNWs surface tends to be more hydrophilic.
The capacitance values of the sensors under different humidity
levels also can be calculated from Eq. (3). Fig. 6 is the relationship
between the calculated capacitance values of samples 1–3 at
different relative humidity. For samples 1–3, since the etching
time, t, is different (t
1
4t
2
4t
3
), the length of SiNWs resulted, L,is
also different (L
1
4L
2
4L
3
). From Fig. 6, we can see the capacitance
values increase with the humidity level increasing. And sample 1
had the biggest capacitance change in these three samples. The
longer SiNWs will lead to the larger capacitance and the increased
sensitivity. With the length of the SiNWs increasing, the nonlinear
degree of the response curve tends to increase. From the
equivalent capacitance equation C
xy
¼
e
0
e
r
(A/d), the longer nano-
wires will lead to the increased electrode area, and thus the
increased capacitance values.
ARTICLE IN P RESS
Fig. 4. Schematic diagram of testing platform of humidity characteristic for silicon nanowires sensor.
10
0
2000
4000
6000
8000
10000
12000
Frequency (Hz)
Relative humidity (RH%)
Sample 1
Sample 2
Sample 3
Before annealing
20 30 40 50 60 70 80 90 100
Fig. 5. The relationship between the frequency shift and the corresponding
relative humidity.
Fig. 3. Equivalent capacitance model of silicon nanowires sensor.
0
0
5
10
15
20
25
30
35
40
Capacitance (pF10
3
)
Relative humidity (RH%)
Sample 1
Sample 2
Sample 3
20 40 60 80 100
Fig. 6. The relationship between the calculated capacitance variations and the
corresponding relative humidity.
H. Li et al. / Physica E 41 (2009) 600–604602
3.2. Reproducibility
Fig. 7 shows the frequency behavior of sample 1 as a function
of time for different relative humidity. This sample works under a
humidity cycle of high-to-low and low-to-high step. From the
figure, we can see that the ascending curves are quite similar with
the descending ones. It is indicated that the sensor has good
frequency reproducibility or low humidity hysteresis. And we can
also see that the sensor absorption time is less than 180 s and the
desorption time is less than 100 s.
In this study, the sample 2 was used to cycling test between RH
11.3% and 85%. The consequence shows as Fig. 8. The test result
indicates that the average frequency floating at RH ¼ 85% and
11.3% is only 70.5% and 71.1%, respectively. A slight floating
frequency can be seen when the relative humidity comes back to
the same value. So the silicon nanowires humidity sensors can
work repeatedly.
3.3. Stability
In this study, the silicon nanowires humidity sensor was
measured in different relative humidity circumstance. Fig. 9
shows the long-time frequency stability at four different kinds of
RH level. They are 11.3%, 43%, 75% and 85%RH, respectively. The
frequency was measured every 5 min for 3 h and the frequency
data were recorded by the computer. Slight variation in frequency
float is observed over the time range. In all measurements, the
variations of frequency float are less than 160 ppm. It is indicated
that the sensors have a good stability characteristics under the
same RH level.
3.4. Discussion
On the silica surface, there are three different groups: siloxane
bridges (QSi–O–SiQ), hydroxyl groups (–OH) and unsaturated
Si atoms. The siloxane bridges are somewhat hydrophobic, while
hydroxyl groups (–OH) and unsaturated Si atoms are absolutely
hydrophilic. At low temperature, water vapor is absorbed on the
silica surface by physisorption; at high temperature, it becomes
chemisorbed by reacting with the siloxanes. Since the hydro-
phobicity of silica surface increases with the decreasing amount of
hydroxyl groups, the hydrothermal stability of silica can be
improved by increasing the sintering temperature or by modifying
with some organic or inorganic groups to substitute the hydroxyl
groups. However, the organic groups on the silica surface
themselves are not very stable at elevated temperatures.
The variations of the capacitance were related to the amount of
water vapor adsorbed. If we assumed that the capacitance
variation,
D
C, is proportional to the water vapor adsorbed,
D
m.
The capacitance variations also can be regarded approximately as
the amount of water vapor adsorbed (
D
Cp
D
m). The relative
humidity is in fact the relative pressure of water vapor compared
to the saturated pressure. The relationship between the capaci-
tance variations,
D
C, and the humidity, RH are shown in Fig. 10.
Fig. 10 can also be regarded as the isotherm curves for the sensors
simultaneously. Further, according to the adsorption theory, the
relationships between the capacitance and the humidity level
were linearly fitted using Freundlich adsorption model,
ln(
D
C) ¼ 1/n(RH)+ln K. Here, N is a constant which relate to water
vapor (absorbent) and SiNWs (adsorbate). And K is a parameter
which reflects to the adsorption capability of SiNWs. The bigger K
indicates that the nanowires can adsorb water vapor more easily.
Fig. 11 is the linear fitting curves for samples 1–3 following the
Freundlich adsorption model. The parameters for fitting curves in
detail are summarized in Table 1. From this table, for all sensor
ARTICLE IN P RESS
0
0
2000
4000
6000
8000
10000
12000
75%
(relative humidity)
85%
57%
43%
11.3%
Frequency (Hz)
Time (sec)
2000 4000 6000 8000
Fig. 7. Time-dependent frequency responses for the sensor under one cycle (with
humidity level descending from 85% to 11.3%, then ascending to 85%).
0
2000
4000
6000
8000
10000
12000
14000
RH%(85%)
Frequency (Hz)
Time (Sec)
Sample 2
RH%(11.3%)
500 1000 1500 2000 2500
Fig. 8. Reproducibility curve of silicon nanowires humidity sensor.
0
0
1
2
3
4
5
6
7
Frequency (KHz)
Time / min
RH(11.3%)
RH(43%)
RH(75%)
RH(85%)
Sample 3
20 40 60 80 100 120 140 160 180
Fig. 9. The long-time frequency stability testing at four different humidity
circumstances.
H. Li et al. / Physica E 41 (2009) 600 –604 603
samples, the correlation coefficient r is near to 1 which
demonstrates that the Freundlich adsorption isotherms are
suitable for our sensor adsorption. K values are much bigger
than 1, indicating that the nanowires have a superior adsorption
capability to the water vapor. For samples 1–3, the K values
satisfied K
1
4K
2
4K
3
, implying that the longest SiNWs for sample
1 have the largest adsorption capability. This also had been
verified by the highest sensitivity values of sample 1. In addition,
the correlation coefficient r, satisfying r
1
or
2
or
3
, which indicates
that the sample 3, with the shortest SiNWs, is most suitable for
the Freundlich adsorption isotherm description, which has the
best linearity.
According to the fitting results, it was demonstrated that the
samples adsorbing water vapor can be described by the
Freundlich isotherm. So, it is concluded that the sensor humidity
response can be attributed to both chemisorption and physisorp-
tion.
4. Conclusions
We have prepared silicon nanowires array using chemical
etching. These nanowires arrange regularly and have high-specific
surface area. The SiNWs have been used as a simple low-cost
humidity sensor. Some properties like accuracy, reproducibility
and stability of the sensor had been discussed in this paper. It is
demonstrated that SiNWs is a useful humidity-sensitive nanos-
tructured material. Because SiNWs can be fabricated easily as well
as can be compatible with the latest silicon technology, silicon
nanowires humidity sensors have great potential in actual
applications.
Acknowledgements
The project is supported by National Natural Science Founda-
tion of China (60672002), Shanghai Pujiang Project (06PJ14037)
and Shanghai Leading Academic Discipline Project, Project
Number: B411.
References
[1] C.L. Dai, M.C. Liu, F.S. Chen, C.C. Wu, M.W. Chang, Sensors Actuators B 123
(2007) 896.
[2] T.H. Fang, C.I. Weng, J.G. Chang, Nanotechnology 11 (2000) 181.
[3] Z. Li, S.G. Zhu, K. Gan, Q.H. Zhang, Z.Y. Zeng, Y.H. Zhou, H.Y. Liu, W. Xiong, X.L.
Li, G.Y. Li, J. Nanosci. Nanotechnol. 5 (2005) 1199.
[4] H. Nishikawa, T. Shiroyama, R. Nakamura, Y. Ohiki, K. Nagasawa, Y. Hama,
Phys. Rev. B 45 (1992) 586.
[5] M.M. Thackeray, Prog. Solid State Chem. 25 (1997) 1.
[6] M. Skupinski, et al., Nucl. Instrum. Methods Phys. Res. B 240 (2005) 681.
[7] A. Egatz-Go
0
mez, et al., Appl. Surf. Sci. 254 (2007) 330.
[8] X H. Wang, Y F. Ding, J. Zhang, et al., Sensors Actuators B 115 (2006) 421.
[9] Y. Cui, Q. Wei, H. Park, C.M. Lieber, Science 293 (2001) 1289.
[10] J. Salonen, J. Tuura, et al., Sensors Actuators B 114 (2006) 423.
[11] A.I. Diaz Cano, et al., Microelectron. J. 39 (508) (2008) 507.
[12] J. Zhang, C C. Dai, X D. Su, S.J. O’Shea, Sensors Actuators B 84 (2002) 123.
[13] Ming-Liang Zhang, Kui-Qing Peng, Xia Fan, et al., J. Phys. Chem. C 112 (2008)
4444.
[14] G. Di Francia, A. Castaldo, E. Massera, et al., Sensors Actuators B 111–112
(2005) 135.
[15] Y.Y. Xu, X.J. Li, et al., Sensors Actuators B 105 (2005) 219.
[16] A. Foucaran, B. Sorli, et al., Sensors Actuators 79 (2000) 189.
[17] LiJuan Wan, WenLi Gong, Kewei Jiang, et al., Appl. Surf. Sci. 254 (2008) 4899.
[18] Xiaofeng Zhou, Tao Jiang, Jian Zhang, et al., Sensors Actuators B 123 (2007)
299.
ARTICLE IN P RESS
0
0
5
10
15
20
25
30
35
40
Sample 1
Sample 2
Sample 3
Relative humidity (RH%)
20 40 60 80 100
Δ C (pF10
3
)
Fig. 10. Capacitance isothermal–adsorption curves of sensors at 25 1C.
-1.6
1
2
3
4
5
6
7
8
9
10
11
ln (RH)
Sample 1
Sample 2
Sample 3
ln (ΔC)
-1.4 -1.2 -1.0 -0.8 -0.6 -0.4 -0.2 0.0
Fig. 11. Linearly fitting curve for the Freundlich adsorption.
Table 1
Results for isothermal adsorption equation for samples 1–3.
ln(
DC) ¼ 1/n(RH)+ln K
nKr
Sample 1
ln(
DC) ¼ 5.0938ln(RH)+10.53172
0.1963 37485 0.9932
Sample 2
ln(DC) ¼ 4.7909ln(RH)+9.49948
0.2087 13352 0.994
Sample 3
ln(
DC) ¼ 4.6385ln(RH)+8.54525
0.2156 5142 0.9984
H. Li et al. / Physica E 41 (2009) 600–604604