Spectroscopic and Microscopic Investigation of Gold NanoparticleFormation: Ligand and Temperature Effects on Rate and Particle Size
Bạn đang xem bản rút gọn của tài liệu. Xem và tải ngay bản đầy đủ của tài liệu tại đây (1.39 MB, 12 trang )
ARTICLE
pubs.acs.org/JACS
Spectroscopic and Microscopic Investigation of Gold Nanoparticle
Formation: Ligand and Temperature Effects on Rate and Particle Size
Rajesh Sardar† and Jennifer S. Shumaker-Parry*
Department of Chemistry, University of Utah, 315 South 1400 East, RM 2020, Salt Lake City, Utah 84112, United States
S
b Supporting Information
ABSTRACT: We report a spectroscopic and microscopic
investigation of the synthesis of gold nanoparticles (AuNPs)
with average sizes of less than 5 nm. The slow reduction and
AuNP formation processes that occur by using 9-borabicyclo[3.3.1]nonane (9-BBN) as a reducing agent enabled a timedependent investigation based on standard UVÀvis spectroscopy and transmission electron microscopy (TEM) analyses. This is in contrast to other borohydride-based syntheses of thiolate
monolayer protected AuNPs which form particles very rapidly. We investigated the formation of 1-octadecanethiol (ODT)
protected AuNPs with average diameters of 1.5À4.3 nm. By studying the progression of nanoparticle formation over time, we find
that the nucleation rate and the growth time, which are interlinked with the amount of ODT and the temperature, influence the size
and the size dispersion of the AuNPs. High-resolution TEM (HRTEM) analyses also suggest that the nanoparticles are highly single
crystalline throughout the synthesis and appear to be formed by a diffusion-controlled Ostwald-ripening growth mechanism.
’ INTRODUCTION
Applications in electronic and optical detection systems,1,2
device development,3À5 therapeutics,6 and catalysis7,8 have made
gold nanoparticles (AuNPs) the focus of much nanoscience
research. The optical, electronic, and catalytic properties of metal
nanoparticles are correlated with the physical characteristics of
the particles, such as size9À13 and shape14À23 as well as the local
dielectric environment.24À27 In addition to the optical and
electronic properties, the chemical properties of AuNPs are
strongly related to the core size of the particles, and as the size
of the particles decreases, the fraction of the atoms present on
the vertex and edge sites increases in comparison to the terrace
sites.28 For example, the atoms in different sites on the nanoparticle surface substantially influence surface behavior including
ligand place exchange reactions29À31 as well as the electronic
properties, such as the double-layer capacitance32À41 and the
anion-induced adsorption.42À44 Because of the strong interrelationship, precise control of metal nanoparticle structural properties, such as size, surface chemistry, and even crystalline
character, is a key goal for fundamental studies to better understand and control the optical, electronic, chemical, and electrochemical properties of AuNPs. Despite all of the synthetic work
to produce metal nanoparticles, the extent of control of structural
properties when particles are prepared in solution-based synthesis continues to be a challenge.45À51
The Brust two-phase synthesis and its various modifications
are the most common approaches used to generate AuNPs with
average diameters of 1À4 nm using NaBH4 as a reducing agent.52À61
In these synthetic methods strong stabilizing agents, such as alkyl
or arylthiols, have been most commonly used to control the size
of the nanoparticles. In these cases, the reduction usually reaches
completion within a few hundred milliseconds after addition of
r 2011 American Chemical Society
the strong reducing agent NaBH4 that typically is used. Other
than NaBH4, few other borohydride-based reducing agents have
been used to synthesize stable, monodisperse AuNPs with
diameters of <5.0 nm.62,63 A key aspect of producing nanoparticles with a high degree of control of structural characteristics,
such as particle size, size dispersion, shape, and crystallinity, is
characterizing the nanoparticle formation process, including the
role of changes in reaction parameters. Recently, mass spectrometry was used to investigate the growth of thiolate-protected
AuNPs at various stages of particle formation.64 Using mass
spectrometry requires vigorous cleaning of the sample for every
step of the analyses to remove unwanted or side products in
order to achieve adequate resolution for data interpretation
making this approach challenging. Another approach is to use
real-time, in situ transmission electron microscopy (TEM)
analysis with nanometer scale resolution, although this is quite
challenging due to the fast rate of most nanoparticle formation
processes. As an example, Alivisatos and co-workers used TEM
to monitor the nucleation and the growth of platinum nanoparticles (PtNPs) in situ using a liquid cell.65 In this case, the
electron beam actually initiated the reduction reaction and was
then used for imaging of the nanoparticle formation. The PtNP
formation was quite rapid, making it difficult to obtain detailed
information about the early nucleation and growth processes.
However, the in situ TEM monitoring made it possible to at least
observe the later growth stages and identify different growth
mechanisms. Recognizing the challenges associated with these
approaches, a much more ideal situation would be that more
simple spectroscopic and microscopic methods could be used to
Received: September 10, 2010
Published: May 06, 2011
8179
dx.doi.org/10.1021/ja107934h | J. Am. Chem. Soc. 2011, 133, 8179–8190
Journal of the American Chemical Society
study the nanoparticle formation processes in a time-dependent
manner. However, this typically is not feasible due to the fast rate
of particle formation, especially for the most common synthetic
methods used to produce metal particles with diameters of
<5 nm.
We recently showed that the organo-borane reducing agent
9-borabicyclo[3.3.1]nonane (9-BBN) can be used for the synthesis of monodisperse metal nanoparticles with diameters of
<5 nm. The mild reducing character of 9-BBN enabled the
synthesis of AuNPs functionalized with a wide range of ωfunctionalized (HSC11X, X = ÀCOOH, ÀOH, ÀNH2, and ÀN3)
alkylthiols and phosphine ligands. We further demonstrated the versatility of 9-BBN as a reducing agent by the
preparation of palladium, platinum, and silver nanoparticles.66,67
Another consequence of using 9-BBN is that the nanoparticle
formation process is rather slow compared to other borohydridebased syntheses. This is in contrast to the Brust two-phase
process which uses NaBH4 as a reducing agent and involves
the very rapid formation of AuNPs. This is due to the enormous
amount of hydride formed by the NaBH4 during the reaction.
The metal ions undergo very fast reduction in the presence of a
high concentration of hydride, and the entire nanoparticle
formation process takes only a few hundred milliseconds.68,69
In contrast, 9-BBN-based synthesis of metal nanoparticles can
take up to ∼160 min depending on the reaction conditions.
Here we take advantage of the slow AuNP formation process
induced by 9-BBN to study the growth process in a time-resolved
manner using standard spectroscopic and microscopic techniques. We investigated AuNP formation based on reduction of
Et3PAuCl by 9-BBN using UVÀvis absorption spectroscopy and
TEM analyses. We investigated the role of the stabilizing agent
concentration and the reaction temperature on the nucleation
rate and growth time which ultimately control the final size and
the size dispersion of the AuNPs. Time-dependent, high-resolution TEM (HRTEM) analysis provides evidence of a diffusioncontrolled Ostwald-ripening growth mechanism, which leads to
the generation of nanoparticles with a narrow size dispersion. To
the best of our knowledge, this is the first example where the
formation process of thiolated ligand protected AuNPs based on
borohydride synthesis has been studied systematically by combining the simple approaches of UVÀvis absorption spectroscopy and TEM analyses.
’ EXPERIMENTAL SECTION
Chemicals. Chloro(triethylphosphine) gold(I), 1-octadecanethiol
(ODT), trioctylamine (TOA), and 9-BBN (0.5 M in THF) were
purchased from Aldrich. HPLC grade toluene was obtained from Fisher
Scientific. All chemicals and solvents were used as received without any
purification. The glassware used in the synthesis was cleaned with aquaregia (chemical warning: aqua-regia is very corrosive and should be
handled with extreme care) and then rinsed with copious amounts of
nanopure water and dried overnight prior to use. All reactions were
carried out in air.
Spectroscopy and Microscopy Measurements. Absorption
spectra (400À800 nm) were collected using a Perkin-Elmer Lambda 19
UVÀvis/NIR spectrophotometer. TEM micrographs were obtained
using a Tecnai-12 instrument operating at 100 KV. HRTEM images
were collected using a JEOL 2010F-FAS instrument at 200 KV. Before
TEM sample preparation, the sample was centrifuged at 4000 rpm for 10
min to remove any large aggregates present. From the centrifuged
solution, one drop of reaction mixture was deposited on a 150-mesh
ARTICLE
Scheme 1. Synthesis of Alkylthiolate Protected AuNPs
Synthesized Using 9-BBN as the Reducing Agent
Formvar-coated copper grid, and excess solution was removed by
wicking with filter paper to avoid particle aggregation. The grid was
then allowed to dry before being imaged. Particle size analysis was
conducted by analyzing at least 200 particles in the TEM images using
Scion Image Beta 4.02 software. In Scion Image, after setting the known
distance and unit, the ‘analyze particle’ parameter was used to generate a
table of particle diameters. This table was then exported into Microsoft
Excel 2003 for statistical analysis. In a similar way, we calculated the
interparticle spacing by analyzing a minimum of 150 interparticle
spacings. Images with a 40 nm scale bar were used for particle spacing
calculations, and the edge-to-edge distances of adjacent particles were
taken into consideration.
Synthesis of ODT Capped Gold Nanoparticles (AuNPs). In
air at room temperature, 0.017 g (0.05 mmol) of Et3PAuCl was dissolved in
100 mL of toluene. The solution was stirred for 5 min and then 0.17 g (0.5
mmol) of ODT was injected, and stirring was continued for another 30 min.
At this point, 0.2 mL of 0.5 M 9-BBN in THF was added followed by
immediate injection of 0.005 mL (0.01 mmol) of TOA. The color of the
solution gradually changed from light purple to purple, and 65 min after the
addition of 9-BBN, the color was reddish purple. The stirring was stopped,
and the solution was centrifuged to remove any large aggregates. One drop
of the centrifuged solution was deposited on a Formvar-coated copper grid
and analyzed by TEM. Under identical molar amounts of gold salt and
reducing agent, the reduction also was carried out in the presence of
different amounts of ODT as described above. The toluene was then
removed on a rotary evaporator. The black solid was suspended in 50 mL of
ethanol and sonicated for 30 min. The solid was centrifuged out at 7000 rpm
for 10 min. The sonication and centrifugation steps were performed three
additional times. The solid was then dissolved in CH2Cl2, the solvent was
removed using a rotary evaporator, and the solid was left under high vacuum
for 2 h. The black solid was finally dissolved in CD2Cl2 and analyzed by 1H
NMR (see Supporting Information, Figure 1). The 1H NMR data revealed
no traces of unreacted ODT or 9-BBN. The presence of Et3P from
Et3PAuCl also was not observed in the sample.
Synthesis of AuNPs at Different Temperatures. In the
synthetic procedure, 0.017 g (0.05 mmol) of Et3PAuCl was dissolved
in 100 mL of toluene in air at room temperature. After the solution was
stirred for 5 min, 0.17 mL (0.5 mmol) of ODT was injected, and stirring
was continued for another 30 min. The solution was then adjusted to the
stable temperature chosen for that particular synthesis. Next, 0.2 mL of
0.5 M 9-BBN in THF and 0.005 mL (0.01 mmol) of TOA were added to
the reaction mixture. The AuNPs were synthesized at various solution
temperatures from 25 to 70 °C. The reaction progress was monitored by
UVÀvis absorption spectroscopy, and as soon as a stable absorption
λmax was observed, the solution was removed from heat and allowed to
cool to room temperature.
’ RESULTS AND DISCUSSION
Synthesis and Characterization of Thiolate-Stabilized
AuNPs. At room temperature, 0.017 g (0.05 mmol) of Et3PAuCl
8180
dx.doi.org/10.1021/ja107934h |J. Am. Chem. Soc. 2011, 133, 8179–8190
Journal of the American Chemical Society
Figure 1. UVÀvis absorption spectra of AuNPs at different time points
of the synthesis after addition of 9-BBN.
Figure 2. TEM image of AuNPs synthesized at room temperature using
9-BBN.
was dissolved in 100 mL of toluene in air, producing a colorless
homogeneous solution. The solution was stirred for 5 min, and
then 0.17 mL (0.5 mmol) of ODT was injected, and stirring was
continued for another 30 min. At this point, 0.2 mL of 0.5 M
9-BBN in THF was added. Over time, the reaction mixture
remained colorless even after 24 h of stirring. The solution
displayed a featureless UVÀvis absorption spectrum, and no
nanoparticles were observed using TEM analysis, indicating the
reduction reaction did not take place under these conditions.
To make the reduction reaction proceed, under similar reaction conditions and identical molar ratios of gold salt, thiol, and
9-BBN, a catalytic amount, 0.005 mL (0.01 mmol), of TOA was
immediately injected after addition of 9-BBN (see Scheme 1).
Within five minutes after addition of 9-BBN, the colorless
solution gradually became light purple and then purple, and at
the end of the reaction it was a reddish-purple color. The reddishpurple color of the solution is attributed to the localized surface
plasmon resonance (LSPR) of AuNPs with a diameter greater
than 2 nm present in the solution.9 In the 9-BBN based production of gold nanoparticles, the tertiary amine TOA plays an
ARTICLE
important role because it is expected to polarize the BÀH bond
of 9-BBN and facilitate hydride liberation,66 which eventually
reduces the gold ions to gold atoms in the process of metal
nanoparticle formation.
The progress of the reduction process was monitored by
UVÀvis absorption spectroscopy at different time intervals, see
Figure 1. Approximately 2 min after addition of 9-BBN, the color
of the solution was faint purple and displayed a featureless
UVÀvis spectrum. At 10 min, the purple-colored solution
exhibited a LSPR peak (λmax) at 513 nm. The LSPR peak red
shifted and increased in amplitude for an additional 20 min, and
at that point, the λmax was 529 nm. At 35 min, the amplitude of
the LSPR peak decreased, although the λmax position remained
unchanged. Beyond 35 min, after the decrease in amplitude, we
observed a blue shift of the LSPR band compared to the LSPR
λmax at the 30-min time point. At later times, the LSPR peak
continued to blue shift, and we also observed an increase in the
peak amplitude. At 65 min, the solution exhibited a stable LSPR
λmax at 520 nm, and no further change in peak amplitude was
observed. The observed LSPR changes are discussed in more
detail below.
After a stable LSPR λmax was observed at 65 min, the solution
from the reaction was collected for TEM analysis. Figure 2
presents a representative TEM image of the product. The
synthesis produces AuNPs which are nearly monodisperse in
size with an average diameter of 3.3 ( 0.3 nm. In addition, the
particles formed an ordered two-dimensional (2-D) array (see
Figure 2). We observed that the 2-D arrangement of AuNPs did
not extend across an extensive area of the TEM grid and that
there were some void spaces in the assembly. This observation
correlates with reports that when AuNPs are coated with longchain alkylthiols, the formation of extended 2-D assemblies is
rather poor70 and could be attributed to an inhomogeneous
coating of the thiols on the surfaces of the nanoparticles. Also,
capillary forces would be expected to play an important role in
the nanoparticle assembly, but the drying process was not
controlled in the sample preparation. In fact, the large void
spaces are likely due to the evaporation of the solvent after
deposition of the sample solution on the TEM grid. Better
control of solvent evaporation, as well as adhesion forces, may
lead to more long-range order. Despite the lack of long-range
order, the AuNP assembly appears to have quite uniform shortrange order. We analyzed the short-range periodic arrangement
of the nanoparticles and found a 2.2 ( 0.2 nm gap between
adjacent particles. The predicted interparticle spacing (2l) based
on assuming the particles are coated with a close-packed ligand
shell was calculated using the previously reported formula, l =
0.25 ỵ 0.127n, where n corresponds to the number of methylene
(ÀCH2) units in the carbon chain, and the value 0.25 was taken
into consideration for the terminal methyl group and carbonÀsulfur bond.71 Based on this formula, we estimate an
ODT chain length of 2.4 nm and an expected interparticle
spacing (edge-to-edge) of 4.8 nm, which is twice the length of
a single, extended ODT molecule. The experimental interparticle
distance is 2.6 nm shorter than the calculated spacing. The
shorter observed interparticle distance could be due to the ODT
hydrocarbon chains attached to the AuNP surface not being fully
extended or perhaps the ODT molecules from adjacent nanoparticles are interdigitated.72 Either situation would result in an
observed particle separation that is less than the theoretically
calculated distance. Another contribution to the differences may
be that the TEM analysis was performed on a 2-D plane of a
8181
dx.doi.org/10.1021/ja107934h |J. Am. Chem. Soc. 2011, 133, 8179–8190
Journal of the American Chemical Society
ARTICLE
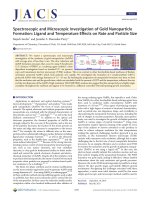
Figure 3. (A) Size and size standard deviation of AuNPs based on TEM analysis. TEM images of particles at time points during synthesis of (B) 2, (C) 5,
(D) 10, (E) 30, and (F) 45 min after adding 9-BBN.
three-dimensional (3-D) structure, and as a result information
about the variation of height may be lost, leading to shorter
observed interparticle distances compared to the true distances
and the predicted values.73
The reduction and AuNP formation process based on 9-BBN
is slow, as observed by the time-dependent UVÀvis absorption
spectroscopy analysis (Figure 1). We took advantage of the slow
nature of this process to use time-dependent TEM analysis to
correlate the size and the size dispersion of the AuNPS with the
LSPR behavior. Figure 3A shows the trends in the particle size
and the size dispersion over the course of the reduction as
observed by TEM analysis. Table 1 presents a summary of data
from time-dependent UVÀvis spectroscopy and TEM analyses.
During the course of the reduction process, we observed an initial
red shift of the LSPR λmax from 513 nm at 10 min after addition
of 9-BBN to 529 nm at 30 min, see Figure 1. In addition to
spectroscopic analysis, the size of the AuNPs was analyzed by
TEM during this time period (Figure 3). During the initial stage
of the reduction, the particles had a large size dispersion of 32%.
At 10 min, the average size was 1.9 ( 0.6 nm. Over time, the
polydispersity decreased slightly to 28% at 30 min, and the
particles had grown to an average size of 3.2 ( 0.9. The increase
in the size of the particles correlates with the red shift of the LSPR
λmax. At 35 min, we observed a decrease in the LSPR peak
amplitude, although the λmax position was unchanged. After this,
the average particle size did not change very much, but the size
dispersion decreased significantly. For example, after 45 min of
the reaction, the particles were only slightly larger than they had
been at 30 min with an average size of 3.4 ( 0.4 nm, but the size
dispersion had decreased significantly from 28 to 12%. Afterward, continuous blue shifting of the LSPR peak λmax was
observed. Finally, at the end of the reduction (65 min), the
LSPR peak position was stable at 520 nm, and the average size of
Table 1. Comparison of UVÀVis Absorption Maxima and
Size of AuNPs at Different Time Intervals after Addition of
9-BBNa
time (min)
λmax (nm)
2
featureless
À
À
5
∼500
1.9 (0.6)
32
10
513
2.4 (0.7)
29
30
529
3.2 (0.9)
28
45
65
523
520
3.4 (0.4)
3.3 (0.3)
12
9
particle size (nm)b,c
% relative size dispersion
a
In each case, 200 particles were counted to determine the size and the
size dispersion. b The AuNPs were less than 1.0 nm, and we were unable
to determine the size due to the very low contrast in the TEM image.
c
The number in parentheses indicates the standard deviation. In
the synthesis, 0.05 mmol of Et3PAuCl and 0.5 mmol of ODT were used.
the particles was 3.3 ( 0.3 nm, which means at this end point of
the formation process, the particles were mostly monodisperse
(9% size dispersion).
The changes in the spectral position of the LSPR peak position
during the formation of the nanoparticles could be explained
based on the AuNP size, the size dispersity, and the growth
process as observed in the UVÀvis spectroscopy and the TEM
analyses. During the initial 30 min, red shifting of the LSPR peak
is related to an increase in nanoparticle size from 1.9 to 3.2 nm.
One surprising observation was the LSPR λmax blue shift that
followed. Typically a blue shift would be associated with either
the dissociation of larger nanoparticles to form smaller ones or
the changes in the crystallinity of the nanoparticles.64 However,
in this case TEM analysis showed that the average particle size
increased from 3.2 to 3.3 nm during this stage. As mentioned
above, during the initial 30 min of the AuNP formation process,
8182
dx.doi.org/10.1021/ja107934h |J. Am. Chem. Soc. 2011, 133, 8179–8190
Journal of the American Chemical Society
Scheme 2. Proposed Stages of AuNP Formation
the nanoparticles were quite polydisperse (32% relative size
dispersion), and at the end of the synthesis the dispersity
decreased to 9%. The observed LSPR λmax blue shifting during
the last ∼30 min of the AuNP formation process could be due to
a decrease of polydispersity from ∼28 to ∼9%. During this time
period, the average size of the nanoparticles was nearly constant
at ∼3.3 nm, and no changes in the position of the LSPR peak
would be expected. However, a narrowing of the LSPR peak as a
result of reduced dispersity may lead to an apparent shift due to a
change in peak shape. However, we also do not observe
significant narrowing of the LSPR peak width. Interestingly Polte
et al.69 reported a LSPR peak blue shift from 540 to 523 nm over
the course of gold nanoparticle formation. Scattering studies
showed a simultaneous decrease in the total number of particles
during the initial stages of the reduction. Then, during later stages
of particle growth, the blue-shifting of the LSPR peak continued,
even when the particle size increased and the particle density
leveled off. There was no experimental evidence of the origin of
the blue-shifting of the LSPR peak. In general, particle growth
should lead to a red shift of the LSPR peak. In both of these cases,
the blue shift may be due to changes in the nanoparticle crystal
structure and the surface ligands. Although HRTEM analysis
presented later in this article indicates that the particles are single
crystalline throughout the reduction process, more systematic
and detailed studies of the changes in crystalline structure would
need to be done to completely understand this contribution to
the LSPR properties. These studies are in progress.
Even without a full understanding of the LSPR behavior, the
trends in the nanoparticle size and the size dispersion may be
used to characterize the general stages of the gold nanoparticle
formation process. By combining the time-dependent spectroscopic and microscopic analyses of the AuNPs, we can begin to
elucidate the stages of the AuNP formation process as well as the
influence of different reaction parameters on the size and the size
dispersion of the AuNPs. The important roles of reduction,
nucleation, and growth processes in the formation of metal
nanoparticles are well-established.74 Scheme 2 summarizes the
proposed stages of the AuNP formation process based on the
time-dependent LSPR data and the TEM analysis. We can
distinguish three different stages which take place during the
synthesis of the AuNPs using 9-BBN as a reducing agent: (i) a
reduction and nucleation step, followed by (ii) simultaneous
reduction, nucleation, and slow growth processes, and (iii) a final
stage which is predominantly growth of the nanoparticles. At the
beginning of the reaction, just after addition of 9-BBN, very small
nanosized particles (nuclei) are generated and are the largest
population in the TEM image in Figure 3B. Over time, the nuclei
grow larger in size via homogeneous nucleation along with
formation of more nuclei. The mixture of small particles
(nuclei) and larger particles in the TEM images in Figure 3C
and D provides evidence for the beginning of a simultaneous
ARTICLE
nucleation/growth stage which begins 5À10 min after addition
of 9-BBN. At that point, the parallel nucleation and growth
processes continue until 30 min after 9-BBN addition, as
observed in the TEM analysis (see Figure 3E). This is shown
by the mixture of ultrasmall nanoparticles along with a population of larger particles of fairly uniform size in the TEM images in
Figure 3D and E during the early time periods (10À30 min) of
the formation process. The mixture of sizes also is represented by
the high standard deviations in particle size observed for those
time periods in Table 1. The presence of ultrasmall particles
(<1.0 nm) during the first 30 min of the formation process indicates that there must be a constant supply of such particles
which serve as nuclei and implies an active nucleation process
during that time period. The formation of the larger AuNPs
observed in the TEM images for each time point would be
possible only if the small size particles experienced a simultaneous growth process that was due to molecular addition, rather
than particle aggregation. Further evidence for this growth
mechanism is shown by experiments described later in this
article. During the 20-min time period of simultaneous growth
and nucleation, the rate of nucleation was faster compared to the
particle growth rate. This is shown by the larger population of
small-sized nanoparticles (nuclei) in the TEM images of the
product from this time period. The presence of the large number
of nuclei also leads to an increase in the number of larger
nanoparticles in solution leading to the rapid increase in LSPR
λmax amplitude as observed in the UVÀvis spectra (Figure 1).
The large size dispersion during the initial particle formation also
indicates that the initial stage is governed by rapid nucleation,
which typically produces more polydisperse nanoparticles.69
Over time the concentration of larger particles in the solution
decreased as observed by the decrease in the LSPR peak
amplitude, while the average particle size increased. This indicates that the growth process played a greater role at later stages,
as would be expected, reducing the particle size dispersity.
Particle growth plays an important role as the reduction process
using 9-BBN proceeds more slowly than the traditional sodium
citrate or borohydride methods. As a result, the nuclei which are
formed in the initial stage of the reduction process undergo a
slower growth step. The final stage of the reduction process was
dominated by nanoparticle growth shown by the generation of
nearly monodisperse particles. The TEM analysis (Figure 3C
and D) supports the observed LSPR behavior where the concentration of ultrasmall particles is much higher than the larger
particles observed at each time point. At 30 min after addition of
9-BBN, the nucleation process was complete, and after that
nanoparticle formation was dominated by growth, which produced the monodisperse AuNPs. Our observations correlate with
those presented by Peng et al. which also showed that during the
nanoparticle growth process, small size clusters grow faster than
the larger ones, narrowing down the size distribution over the
time course of nanoparticle formation.75 More detailed discussions of the nanoparticle growth process are in the following
section.
In order to determine the nature of the growth process, we
analyzed the samples at various stages during the reduction
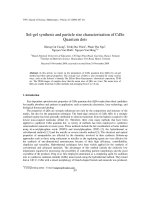
reaction using HRTEM. Figure 4 shows the HRTEM images
of AuNPs produced by 9-BBN reduction at different stages of
particle formation. The nanoparticles appear to be predominantly single crystalline (∼99%) in structure at various stages of
the reduction process (see Supporting Information Figures 2À7
for additional HRTEM images). The crystallinity of the
8183
dx.doi.org/10.1021/ja107934h |J. Am. Chem. Soc. 2011, 133, 8179–8190
Journal of the American Chemical Society
ARTICLE
Figure 4. HRTEM images of particles at time points during synthesis of: (A) 2, (B) 5, (C) 30, and (D) 65 min after adding 9-BBN. Insert in BÀD shows
single nanoparticle image with a scale bar of 2 nm. The images clearly show single crystalline lattice planes.
nanoparticles suggests that the growth of the particles follows a
classical diffusion controlled Ostwald-ripening mechanism.76 In a
recent report by Buhro and co-workers, two different growth
mechanisms for formation of thiol-protected AuNPs were described: (i) aggregative and (ii) Ostwald ripening.77 An aggregative growth mechanism produces primarily polycrystalline
AuNPs. On the other hand, single crystalline AuNPs are expected
if the growth process follows an Ostwald-ripening mechanism,
which appears to be the case for the 9-BBN-based AuNP
synthesis according to the HRTEM analysis.
The important role of diffusion-limited growth in the synthesis
of monodisperse nanoparticles with less than 10% size dispersion
is well established.75 During a diffusion-limited growth process,
molecular addition is facilitated where active nuclei adsorb on the
surfaces of larger particles. This growth mechanism generally
occurs for chemical reactions where the supply of growth species
is slow. In addition, the supply of capping ligand also is essential.
The surface-bound capping ligands form a diffusion barrier,
which hinders adsorption and further growth of the nanoclusters.
In this present investigation, the AuNPs grew from very polydisperse (32%) particles with an average size of 1.9 ( 0.6 nm to
monodisperse (9%) particles with an average size of 3.3 (
0.3 nm. The UVÀvis spectroscopy analysis showed initial red
shifts followed by blue shifts of the LSPR λmax of the AuNPs. The
red shifts are due to the increase of particle size from 1.9 to 3.2. In
the remaining 30 min of the reduction process, a very small
particle size increase (∼0.1 nm) was observed, but the dispersity
decreased much more significantly from 28 to 9% with a final
AuNP size of 3.3 nm. Alivisatos and co-workers observed a
similar change in size dispersion, from highly polydisperse to
nearly monodisperse particles, over the time course of PtNP
formation using in situ HRTEM analysis.65 Their results indicated that at the beginning of the reduction process a large
number of nanocrystals were formed which undergo parallel
nucleation and growth processes. The size distribution of particles was large at the beginning, followed by a bimodal distribution
during the nucleation/growth stage. At the end of the formation
process, the size distribution was narrow, and monodisperse
nanoparticles were observed. These observations may be explained by a classical diffusion-controlled growth mechanism,
and this is discussed more below. As discussed above, the
observations made for the gold nanoparticle formation process
based on 9-BBN as a reducing agent are similar to their findings.
Effects of Stabilizing Agent Concentration. We investigated
the influence of the concentration of the stabilizing agent (ODT)
on the reaction rate and the size of the AuNPs. In these studies,
8184
dx.doi.org/10.1021/ja107934h |J. Am. Chem. Soc. 2011, 133, 8179–8190
Journal of the American Chemical Society
ARTICLE
we varied the Au(I) to thiol mole ratio by changing the amount of
ODT while keeping the reaction temperature and amounts of
Et3PAuCl and 9-BBN constant. We observed that when lower
amounts of thiol were used, the AuNPs formed faster compared
to when higher amounts of thiols were included in the reaction
mixture. For example, in the presence of 0.12 mmol of ODT, the
reaction took 30 min to reach a stable absorption maximum
(LSPR λmax peak amplitude), and the time to reach completion
increased to 165 min when 2.50 mmol of ODT was used for
nanoparticle synthesis, see Table 2. The final size of the AuNPs
produced depends on the amount of ODT used. We observed
that larger AuNPs were formed when higher amounts of ODT
were used, and smaller AuNPs were produced in the presence of
Table 2. Comparison of Reaction Time, LSPR λmax, and Size
of Gold Nanoparticles Synthesized Using Different Amounts
of ODTa
[ODT] (mmol) time for stable λmax (min) λmax (nm) particle size (nm)b
0.12
516
2.6 (0.5)
45
518
3.3 (0.4)
0.50
65
520
3.3 (0.3)
1.00
90
520
3.8 (0.7)
2.50
a
30
0.25
165
526
4.3 (0.9)
In each case, at least 200 particles were counted to determine the size
and the size dispersion. The syntheses were carried out using 0.017 g
(0.05 mmol) of Et3PAuCl, 0.2 mL of 0.5 M 9-BBN in THF, and catalytic
amount 0.005 mL (0.01 mmol) of TOA. b The number in parentheses
indicates the standard deviation. The syntheses of AuNPs in the
presence of various amounts of thiols were carried out at room
temperature.
lower amounts of ODT, which is shown by the TEM images in
Figure 5A and D and the data in Table 2. In the case of NaBH4based two-phase syntheses, literature reports have indicated that
the amount of stabilizing agent, in most cases thiol ligands
present in the reaction mixture, significantly influences the size
of the synthesized AuNPs.53 In related work, Murray and coworkers have reported that different sizes of AuNPs stabilized by
hexanethiolate ligands also can be synthesized by changing the
Au(III)-to-thiol mole ratios.78 In their reports, 2.2, 2.0, and
1.6 nm AuNPs were synthesized at room temperature when
the corresponding gold-to-ligand mole ratios were 1:1, 1:2, and
1:3, respectively.78 However, we observed the opposite behavior
as 2.6, 3.3, 3.8, and 4.3 nm AuNPs were formed when Au(I)-tothiol mole ratios were 1:2.4, 1:5, 1:20, and 1:50, respectively. The
influence of amount of ODT on the particle size is due to
complex formation with 9-BBN which reduces the amount of
hydride available to participate in the reduction process, leading
to the production of smaller nanoparticles in the presence of
larger amounts of ODT. This is discussed in more detail later in
this article.
Interestingly, we have observed that the LSPR properties of
the synthesized AuNPs also were influenced by the amount of
ODT present in the reaction mixture. Previously Whetten and
co-workers reported that the optical absorption properties9 of
thiol protected gold clusters are highly sensitive to the size of the
metallic core of the cluster assembly. Also, as the size of the
AuNPs increases, the LSPR λmax is expected to shift to longer
wavelengths. We investigated the LSPR properties of the AuNPs
synthesized using 9-BBN in the presence of various amounts of
ODT. The observed LSPR properties of the particles showed a
dependence on the amount of ODT. Table 2 presents a summary
Figure 5. TEM images of AuNPs synthesized in the presence of different amounts of ODT: (A) 0.12, (B) 0.25, (c) 1.00 and (D) 2.50 mmol.
8185
dx.doi.org/10.1021/ja107934h |J. Am. Chem. Soc. 2011, 133, 8179–8190
Journal of the American Chemical Society
ARTICLE
Scheme 3. Reaction Pathway between Alkylthiols and 9-BBN
of the spectroscopic and the microscopic characterization including the time it took for the LSPR peak to reach a stable
amplitude, the corresponding λmax (wavelength) values, and the
size of the AuNPs synthesized using different amounts of ODT.
Representative TEM images of AuNPs synthesized in the presence of different amounts of ODT are shown in Figure 5.
Depending on the amount of thiol present in the solution, the
λmax varied from 516 to 526 nm when all other reaction
conditions were the same. The amplitude of the LSPR peak
was lowest in the case of lower amounts (0.12 mmol) of ODT,
where the observed LSPR λmax was 516 nm. The LSPR peak red
shifted to 526 nm when 2.25 mmol of ODT was used for
nanoparticle synthesis. The corresponding TEM analysis showed
much smaller (diameter of 2.6 nm, Figure 5A) AuNPs were
produced in the presence of a lower amount (0.12 mmol) of
ODT compared to the larger (4.3 nm, Figure 5D) AuNPs formed
when 2.50 mmol of ODT was used. The TEM analysis correlates
with the UVÀvis analysis, where 2.6 and 4.3 nm AuNPs
displayed LSPR absorption peaks at 516 and 526 nm, respectively. As expected, the LSPR peak red shifted as the size of the
AuNPs increased. In addition, with an increase in Au(I)-to-thiol
ratio, the particles are more polydisperse in nature, and this is
discussed below.
We have shown that, for a given molar amount of metal salt
and reducing agent, the time to reach a stable absorption
maximum in the LSPR peak was dependent on the amount of
capping ligand, ODT, present in the reaction mixture. The slow
formation of AuNPs in the presence of higher concentrations of
ODT has provided us the opportunity to investigate the reducing
character of 9-BBN, including the role of complex formation with
alkylthiolates and the potential impact on hydride formation.
Previously, Brown and co-workers have shown that thiol-terminated primary or secondary alkyl hydrocarbons form complexes
with hydroborating agents and rapidly liberate hydrogen gas.79,80
In the case of 9-BBN, the reaction is shown in Scheme 3.
Due to this complex formation, the reaction mixture eventually will lack hydrides which reduce metal ions to atoms in the
AuNP synthesis. In our system, we have observed that in the
presence of a lower amount (0.12À0.5 mmol) of ODT, the
particle formation is faster and completed within 30À65 min
after addition of 9-BBN. With an increase in the molar amount of
thiol in the reaction mixture, the rate of AuNPs was observed to
be slower. For example, in the presence of 2.5 mmol of 9-BBN,
the reduction took ∼165 min to reach a stable λmax. The high
ODT concentration is expected to reduce the hydride concentration in the solution and liberate hydrogen gas. Nanoparticle
formation rate will be reduced due to the lack of hydride. The
experimental evidence from UVÀvis spectroscopy analysis suggests that the complex formation between 9-BBN and excess
thiols significantly influences steps (i) and (ii) in Scheme 2.
Temperature Effects on Reaction Rate and Particle Size.
We investigated the effect of temperature on the size, size
dispersity, and LSPR properties of the AuNPs. The AuNPs were
Figure 6. (A) UVÀvis absorption spectra of AuNPs synthesized at
different reaction temperatures and (B) the rates of nanoparticle
formation from spectroscopy analysis at different time intervals at
various solution temperatures.
synthesized at solution temperatures ranging from 25 to 70 °C
according to the synthetic procedure described in the Experimental Section. The reaction progress was monitored by UVÀvis
spectroscopy, and as soon as the reaction mixture displayed a
stable LSPR λmax, the solution was removed from heat and
allowed to cool to room temperature. We observed that the
formation of AuNPs using 9-BBN is strongly temperature
dependent. As the solution temperature increased, the generation of AuNPs was faster, as observed by the λmax reaching a
stable value more rapidly, with the particle formation time
decreasing from 65 min at 25 °C to 5 min at 70 °C. Figure 6A
presents the UVÀvis absorption spectra of AuNPs synthesized at
different reaction temperatures. As we see from the spectra, the
LSPR λmax blue shifted as the reaction temperature increased.
Based on this blue shift, we would expect the average particle size
at higher temperature to be smaller. In order to compare the
LSPR properties of the AuNPs with particle size, we performed
TEM analysis. Figure 7 presents representative TEM images of
nanoparticles synthesized at different temperatures. The TEM
analysis shows nanoparticles are almost monodisperse with
average diameters of 3.3À1.5 nm for the temperatures used.
The sizes at 25 and 40 °C are in the range of 3 nm and decrease to
2 nm when the reduction took place at 50 or 60 °C. On the other
hand, when the reduction was performed at 70 °C, the particles
8186
dx.doi.org/10.1021/ja107934h |J. Am. Chem. Soc. 2011, 133, 8179–8190
Journal of the American Chemical Society
ARTICLE
Figure 7. TEM images of AuNPs synthesized at solution temperatures of (A) 50, (B) 60, and (C) 70 °C. (D) Particle size dependence on solution
temperature.
are nearly monodisperse in nature (<10% dispersity) with
average diameter of 1.5 nm. The decrease in the average size of
particles prepared at higher temperature correlates with the
observed shifting of the LSPR λmax to shorter wavelengths.9
Analysis shows batches of particles with average sizes of 3.2 and
1.5 nm displayed LSPR λmax values of 520 and 512 nm, respectively (see Table 1). In addition to the blue shifts of the LSPR
peak position, we also observed a decrease in LSPR peak
amplitude as the solution temperature increased. The 1.5 and
3.2 nm ODT protected nanoparticles show the lowest and
highest values of peak amplitude, respectively. This observation
is in agreement with Whetten and co-workers9 and Hussain
et al.81 who also have reported that when AuNPs were coated
with thiolate ligands, the amplitude of the absorption maxima
decreased as the nanoparticle size decreased. This is due to the
ligand influence on the electronic properties of the particles in
addition to the size dependence of the scattering and absorption
cross sections for the particles. In this present investigation, we
believe this could be the reason for the decrease of the LSPR peak
amplitude where the nanoparticle size decreased from 3.2 to
1.5 nm as the solution temperature increased from 25° to 70 °C.
As we discussed above, the solution temperature substantially
influenced the generation of AuNPs. The formation of the
nanoparticles was faster as observed by the λmax reaching a stable
value more quickly as we increased the reaction temperature. We
used UVÀvis absorption spectroscopy to investigate the kinetics
of nanoparticle formation at different time intervals, as shown by
the spectra in Figure 6B. Based on the UVÀvis spectroscopy
analysis, we found that both the nucleation and the growth
processes are significantly influenced by the reduction of temperature, and three different trends in the kinetic behavior related
to particle formation are observed: (i) When the reactions were
performed at 25° and 40 °C, the trends of the absorption spectra
related to the AuNPs produced are comparable, where a steady
increase in the LSPR peak amplitude was observed until the 30and 20-minute time points, respectively. In both cases, the
amplitude of LSPR peak then decreased for ∼5 min and again
slowly increased until reaching stable maxima after 65 and 60 min
for the 25 and 40 °C reactions, respectively. The evaluation of
LSPR λmax peak wavelength shifts for synthesis at 25 °C was
described earlier in the article. We also observed similar trends in
the LSPR peak position when the synthesis was performed at
40 °C. At this temperature, the LSPR λmax peaks red shifted until
∼20 min after addition of 9-BBN and then blue shifted until the
LSPR peak stabilized. More detailed high-resolution structural
analysis of the AuNPs is underway to identify the origin of the
blue shifting the LSPR peak. (ii) For syntheses carried out at 50
and 60 °C, the amplitude of the LSPR peak increased more
quickly and reached the maximum value within 2 min. The
amplitudes of the LSPR λmax peaks then decreased for another
∼10 min until stable absorption maxima were observed after
approximately 15 and 8 min, respectively, after addition of
8187
dx.doi.org/10.1021/ja107934h |J. Am. Chem. Soc. 2011, 133, 8179–8190
Journal of the American Chemical Society
ARTICLE
Table 3. Summary of UVÀVis Spectroscopy and TEM
Characterization of AuNPs Synthesized at Different Solution
Temperaturesa,b
temp (°C)
time for stable λmax (min)
λmax (nm)
particle size (nm)c
25
65
520
3.3 (0.3)
40
45
520
3.1 (0.3)
50
15
518
2.0 (0.3)
60
8
512
1.7 (0.2)
70
5
512
1.5 (0.2)
a
In each case, at least 200 particles were analyzed to determine the size
and the size dispersion. b The syntheses were carried out using 0.017 g
(0.05 mmol) of Et3PAuCl, 0.17 mL (0.5 mmol) of ODT, 0.2 mL of 0.5
M 9-BBN in THF, and a catalytic amount of 0.005 mL (0.01 mmol)
of TOA. c The number in parentheses indicates the standard deviation.
9-BBN. In those cases, only LSPR λmax blue shifts were observed.
(iii) When the reduction was performed at 70 °C, the formation
of nanoparticles was very fast, and in this case, one minute after
addition of 9-BBN addition, the LSPR λmax peak amplitude
decreased by 0.02 au and then stabilized within 5 min after
addition of reducing agent.
The time-dependent kinetics data (Figure 6B) and TEM
results (Figures 4 and 7) clearly suggest that the nucleation
and the growth processes contribute differently to the AuNP
formation process as the reaction temperature is varied: (i) When
the reduction was performed at 25 and 40 °C, the formation of
AuNPs followed the process discussed in more detail above and
illustrated by Scheme 2. In this case, the particle formation
process consists of a reduction-nucleation stage, a simultaneous
reduction, nucleation, and growth stage, and a final growth stage.
(ii) More rapid nucleation plays an important role when the
reduction reactions were performed at either 50 or 60 °C.
Figure 6B suggests that after addition of 9-BBN to the reaction
mixture, an immediate reduction of Au(I) ions took place, and
the solution contained a high concentration of active nuclei. Due
to presence of a large number of active nuclei, one would expect a
short nucleation time period, and we assume in this case that this
step was completed within 5 min after addition of reducing agent,
and then the system went through a complete growth process for
another 5À10 min. During the growth, dissolution of smaller
particles and addition of the material on the surface of larger
nanoparticles likely take place. In this period, consequently the
numbers (concentration) of nanoparticles in the solution decreased, which affected the optical behavior of the particles and
led to a decrease in the LSPR peak amplitude. (iii) At the higher
temperature, 70 °C, the reduction, nucleation, and growth
processes occurred simultaneously and very quickly as observed
by the LSPR peak amplitude reaching a stable maximum value at
∼6 min after addition of 9-BBN. The formation of AuNPs at
70 °C using 9-BBN is more similar to the Brust two-phase
synthetic approach where reduction, nucleation, and growth
processes take place within milliseconds to a few seconds time
frame after the addition of a reducing agent (i.e., NaBH4 in the
case of the Brust method).68,69 Real-time monitoring of nanoparticles formation process via light scattering techniques would
provide better information regarding the differences in growth
mechanisms at different reduction temperatures.
In addition to differences in the size and the size dispersion of
AuNPs produced at different temperatures, we observed that the
ordered assembly of the particles on the TEM grid is strongly
reaction temperature dependent. The AuNPs synthesized at
25 and 40 °C displayed a close-packed 2-D assembly with
regular interparticle spacing of ∼2.2 nm, and the detailed
observations are explained earlier in this article. On the other
hand, with an increase of the solution temperature to 50 °C, the
2-D assembly was less ordered as shown in the TEM image in
Figure 7. At higher temperatures, i.e., 60 or 70 °C, the particles
were randomly dispersed on the TEM grid, and no short-range
order was observed, see Figure 7B and C. The dependence of the
ordered assembly on reaction temperature may be linked to the
packing of the alkylthiolates on the AuNPs. When the nanoparticles were synthesized at 60 or 70 °C, the alkyl chains may have
been more disordered due to the higher temperature favoring
less-organized packing compared to more-ordered packing when
the particles form over a longer time period at lower temperatures. Also at higher temperatures, place exchange could take
place between the surface-bound thiolated ligands and the free
thiols present in the solution.28À30,53 This process could also
disturb the ligand packing on the surface of the particle. Overall, a
more disordered ligand arrangement on the surfaces of the
AuNPs could significantly influence the packing and short-range
order of the nanoparticles. Lennox and co-workers have extensively studied the nature of alkyl chains of C18ÀSH thiols packing
when the molecules are bound to the gold nanoparticle
surface.68,69 They observed that at temperatures of 25 °C or
higher, the thiolated alkyl chains mostly exist in an extended alltrans ordered conformation.82 The spectroscopic characterization shows that with an increase of temperature, the highly
ordered alkyl chains became more disordered in nature. In
addition, there were significant numbers of mobile ligands
present at higher temperature.83,84 In the case of 9-BBN induced
AuNPs synthesis at elevated temperature, e.g. 60 or 70 °C, the
contribution of disordered alkyl chains, continuous place exchange reactions, and migration of thiolated ligands would lead
to less particle organization.
Correlation of Particle Size and Size Dispersion with Rate
of Nucleation and Growth Time. We have discussed the
nanoparticle formation process dependence on concentration
of stabilizing ligand (ODT) present and solution temperature. In
this section, we discuss the correlation of these reaction parameters with the size and the size dispersion of the AuNPs. We
relate the particle size with the stages of the nanoparticle growth
including the rate of nucleation and the growth time, which may
be correlated with the nanoparticle size and size dispersion. In
the case of 9-BBN induced synthesis of AuNPs at room
temperature in the presence of different amounts of ODT, the
reduction takes longer in the presence of higher amount of thiols
and vice versa. This was observed by the differences in reaction
time required to reach a stable LSPR absorption maximum. A
shorter time was observed for a lower amount of ODT, and it
took a longer time when a greater amount of ODT was used. The
higher amount of thiols reduced the rate of active nuclei. This is
likely caused by a reduction in the hydride present in the reaction
mixture as explained above. As a result both the nucleation and
the growth processes also were slower. As expected, the slow
nucleation process leads to generation of more polydisperse
particles, which is what we observed for AuNPs formed in the
presence of 2.5 mmol of ODT. Moreover, the larger average size
of the nanoparticles prepared in the presence of a higher amount
of ODT could be due to a slower particle growth process, which
correlates with the observation that the size of the AuNPs is
proportional to the growth time. The sizes of the nanoparticles
8188
dx.doi.org/10.1021/ja107934h |J. Am. Chem. Soc. 2011, 133, 8179–8190
Journal of the American Chemical Society
were 2.6 ( 0.5 and 4.3 ( 0.9 nm for 0.12 and 2.5 mmol of ODT,
respectively, see Table 2. Previously, it also was reported that for
homogeneous nucleation the size dispersity of nanoparticles
depends on the nucleation rate.75 In the case of fast nucleation,
the system generates monodisperse particles. In addition, based
on a classical diffusion-controlled Ostwald-ripening growth mechanism, the size of the nanoparticles is expected to be proportional to the growth time.65,76 However, in the presence of high
concentrations of ODT (2.5 mmol), the AuNP formation was
slower (165 min) and resulted in polydisperse AuNPs due to the
slow nucleation and growth processes.
The temperature effects on particle size and size dispersion
also can be interpreted based on the rate of nucleation and
growth processes. At lower temperatures of 25 and 40 °C, the
times for the formation of stable absorption maxima were 65 and
45 min, respectively. These lower temperatures and longer
reaction times produced nanoparticles with an average size of
∼3 nm. However, the size of the nanoparticles was reduced to 2.0
and 1.7 nm when the reduction reactions were performed at 50
and 60 °C, respectively. At these higher temperatures, the
reaction proceeded more quickly with stable absorption maxima
observed 8 to 15 min after addition of 9-BBN, depending on the
temperature used. The kinetic data correlate with the final size of
the AuNPs. The rapid formation of active nuclei at higher
temperature (50 and 60 °C) substantially promotes the nucleation and the growth steps resulting in formation of smaller, nearly
monodisperse AuNPs. The very fast nucleation and growth
processes lead to the very small 1.5 nm AuNPs at 70 °C where
a stable absorption maximum was observed ∼5 min after
addition of 9-BBN. The experimental results from both UVÀvis
absorption and TEM analysis show the correlation between the
size and the size dispersion of AuNPs and the stabilizing agent
concentration as well as the solution temperature.
’ CONCLUSION
The slow AuNP formation based on using 9-BBN as a
reducing agent enabled investigations of the relationship between reaction parameters and the size and size dispersion of
AuNPs based on simple UVÀvis spectroscopy and TEM analyses. We demonstrated synthesis of nearly monodisperse
AuNPs in organic solvents. The HRTEM analysis showed the
nanoparticles are mostly single crystalline in nature, which is
likely due to a dominant diffusion-controlled Ostwald-ripening
growth mechanism. The amounts of capping ligand and the
reduction temperature have an important impact on nucleation
and growth processes which directly influence the final sizes of
the nanoparticles. By identifying different stages of AuNP formation, we can begin to try to control the formation process by
manipulating conditions to favor specific stages of reduction,
nucleation, and growth over the time course of the AuNP formation. This investigation demonstrates the use of simple approaches
to gain a more detailed characterization of nanoparticle formation and provides important insight into the stages of the
nucleation and growth during the borohydride-based synthesis
of thiolate-stabilized AuNPs. More detailed studies, including
in situ characterization of AuNP crystallinity, using small-angle
X-ray scattering (SAXS) and selected area electron diffraction
(SAED), should provide additional information impacting fundamental understanding of nanoparticle formation and are
underway. These investigations also should form a good basis for
ARTICLE
tailoring reaction conditions to tune the particle characteristics, such
as size, size dispersion, crystalline structure, and shape.
’ ASSOCIATED CONTENT
S
b
1
H NMR of purified ODT
stabilized AuNPs and additional HRTEM images. This material
is available free of charge via the Internet at .
Supporting Information.
’ AUTHOR INFORMATION
Corresponding Author
Present Addresses
†
Department of Chemistry and Chemical Biology, Indiana
UniversityÀPurdue University Indianapolis, 402 N. Blackford
Street, Indianapolis, IN 46202, United States.
’ ACKNOWLEDGMENT
We would like to thank Dr. Amar Khumbar at UNC-Chapel
Hill for assistance with HRTEM analysis.
’ REFERENCES
(1) Katz, E.; Willner, I. Angew. Chem., Int. Ed. 2004, 43, 6042–6108.
(2) Taton, T. A.; Mirkin, C. A.; Letsinger, R. L. Science 2000,
289, 1757–1760.
(3) He, L.; Musick, M. D.; Nicewarner, S. R.; Salinas, F. G.;
Benkovic, S. J.; Natan, M. J.; Keating, C. D. J. Am. Chem. Soc. 2000,
122, 9071–9077.
(4) Maier, S. A.; Kik, P. G.; Atwater, H. A.; Meltzer, S.; Harel, E.;
Koel, B. E.; Requicha, A. A. G. Nat. Mater. 2003, 2, 229–232.
(5) Novak, J. P.; Brousseau, L. C.; Vance, F. W.; Johnson, R. C.;
Lemon, B. I.; Hupp, J. T.; Feldheim, D. L. J. Am. Chem. Soc. 2000,
122, 12029–12030.
(6) Pissuwan, D.; Valenzuela, S. M.; Cortie, M. B. Trends Biotechnol.
2006, 24, 62–67.
(7) Enache, D. I.; Edwards, J. K.; Landon, P.; Solsona-Espriu, B.;
Carley, A. F.; Herzing, A. A.; Watanabe, M.; Kiely, C. J.; Knight, D. W.;
Hutchings, G. J. Science 2006, 311, 362–365.
(8) Tsunoyama, H.; Sakurai, H.; Negishi, Y.; Tsukuda, T. J. Am.
Chem. Soc. 2005, 127, 9374–9375.
(9) Alvarez, M. M.; Khoury, J. T.; Schaaff, T. G.; Shafigullin, M. N.;
Vezmar, I.; Whetten, R. L. J. Phys. Chem. B 1997, 101, 3706–3712.
(10) Bao, Y.; Zhong, C.; Vu, D. M.; Temirov, J. P.; Dyer, R. B.;
Martinez, J. S. J. Phys. Chem. C 2007, 111, 12194–12198.
(11) Lopez-Acevedo, O.; Tsunoyama, H.; Tsukuda, T.; H€kkinen,
a
H.; Aikens, C. M. J. Am. Chem. Soc. 2010, 132, 8210–8218.
(12) Provorse, M. R.; Aikens, C. M. J. Am. Chem. Soc. 2010,
132, 1302–1310.
(13) Aikens, C. M. J. Phys. Chem. C. 2008, 112, 19797–19800.
(14) Bukasov, R.; Shumaker-Parry, J. S. Nano Lett. 2007,
7, 1113–1118.
(15) Burda, C.; Chen, X.; Narayanan, R.; El-Sayed, M. A. Chem. Rev.
2005, 105, 1025–1102.
(16) El-Sayed, M. A. Acc. Chem. Res. 2001, 34, 257–264.
(17) Habas, S. E.; Lee, H.; Radmilovic, V.; Somorjai, G. A.; Yang, P.
Nat. Mater. 2007, 6, 692–697.
(18) Henzie, J.; Shuford, K. L.; Kwak, E. S.; Schatz, G. C.; Odom,
T. W. J. Phys. Chem. B 2006, 110, 14028–14031.
(19) Jana, N. R.; Gearheart, L.; Murphy, C. J. Langmuir 2001,
17, 6782–6786.
(20) Kim, F.; Song, J. H.; Yang, P. J. Am. Chem. Soc. 2002,
124, 14316–14317.
8189
dx.doi.org/10.1021/ja107934h |J. Am. Chem. Soc. 2011, 133, 8179–8190
Journal of the American Chemical Society
(21) Millstone, J. E.; Park, S.; Shuford, K. L.; Qin, L.; Schatz, G. C.;
Mirkin, C. A. J. Am. Chem. Soc. 2005, 127, 5312–5313.
(22) Sau, T. K.; Murphy, C. J. J. Am. Chem. Soc. 2004,
126, 8648–8649.
(23) Shankar, S. S.; Rai, A.; Ankamwar, B.; Singh, A.; Ahmad, A.;
Sastry, M. Nat. Mater. 2004, 3, 482–488.
(24) Ghosh, S. K.; Kundu, S.; Nath, S.; Pal, T. Appl. Spectrosc. 2005,
59, 844–847.
(25) Kelly, K. L.; Coronado, E.; Zhao, L. L.; Schatz, G. C. J. Phys.
Chem. B 2003, 107, 668–677.
(26) Lazarides, A. A.; Schatz, G. C. J. Phys. Chem. B 2000,
104, 460–467.
(27) Miller, M. M.; Lazarides, A. A. J. Phys. Chem. B 2005,
109, 21556–21565.
(28) Hostetler, M. J.; Zhong, C. J.; Yen, B. K. H.; Anderegg, J.; Gross,
S. M.; Evans, N. D.; Porter, M.; Murray, R. W. J. Am. Chem. Soc. 1998,
120, 9396–9397.
(29) Templeton, A. C.; Wuelfing, W. P.; Murray, R. W. Acc. Chem.
Res. 2000, 33, 27–36.
(30) Wuelfing, W. P.; Gross, S. M.; Miles, D. T.; Murray, R. W. J. Am.
Chem. Soc. 1998, 120, 12696–12697.
(31) Hickman, J. J.; Ofer, D.; Laibinis, P. E.; Whitesides, G. M.;
Wrighton, M. S. Science 1991, 252, 688–691.
(32) Guo, R.; Song, Y.; Wang, G.; Murray, R. W. J. Am. Chem. Soc.
2005, 127, 2752–2757.
(33) Song, Y.; Murray, R. W. J. Am. Chem. Soc. 2002,
124, 7096–7102.
(34) Brennan, J. L.; Branham, M. R.; Hicks, J. F.; Osisek, A. J.;
Donkers, R. L.; Georganopoulou, D. G.; Murray, R. W. Anal. Chem.
2004, 76, 5611–5619.
(35) Deng, F.; Yang, Y.; Hwang, S.; Shon, Y,-S.; Chen, S. Anal. Chem.
2004, 76, 6102–6107.
(36) Yang, Y.; Chen, S. Nano Lett. 2003, 3, 75–79.
(37) Chaki, N. K.; Singh, P.; Dharmadhikari, C. V.; Vijayamohanan,
K. P. Langmuir 2004, 20, 10208–10217.
(38) Hicks, J. F.; Templeton, A. C.; Chen, S.; Sheran, K. M.; Jasti, R.;
Murray, R. W.; Debord, J.; Schaaff, T. G.; Whetten, R. L. Anal. Chem.
1999, 71, 3703–3711.
(39) Kim, Y. G.; Garcia-Martinez, J. C.; Crooks, R. M. Langmuir
2005, 21, 5485–5491.
(40) Quinn, B. M.; Liljeroth, P.; Ruiz, V.; Laaksonen, T.; Kontturi, K.
J. Am. Chem. Soc. 2003, 125, 6644–6645.
(41) Chen, S.; Ingram, R. S.; Hostetler, M. J.; Pietron, J. J.; Murray,
R. W.; Schaaff, T. G.; Khoury, J. T.; Alvarez, M. M.; Whetten, R. L.
Science 1998, 280, 2098–2101.
(42) Stiles, R. L.; Balasubramanian, R.; Feldberg, S. W.; Murray,
R. W. J. Am. Chem. Soc. 2008, 130, 1856–1865.
(43) Sardar, R.; Beasley, C. A.; Murray, R. W. Anal. Chem. 2009,
81, 6960–6965.
(44) Sardar, R.; Beasley, C. A.; Murray, R. W. J. Am. Chem. Soc. 2010,
132, 2058–2063.
(45) Heaven, M. W.; Dass, A.; S. White, P. S.; Holt, K. M.; Murray,
R. W. J. Am. Chem. Soc. 2008, 130, 3754–3755.
(46) Zhu, M.; Aikens, C. M.; Frederick J. Hollander, F. J.; Schatz,
G. C.; Jin, R. J. Am. Chem. Soc. 2008, 130, 5883–5885.
(47) Qian, H.; Eckenhoff, W.; Zhu, Y.; Pintauer, T.; Jin, R. J. Am.
Chem. Soc. 2010, 132, 8280–8281.
(48) Jadzinsky, P. D.; Calero, G.; Ackerson, C. J.; Bushnell, D. A.;
Kornberg, R. D. Science 2007, 318, 430–433.
(49) Whetten, R. L.; Price, R. C. Science 2007, 318, 407–408.
(50) Akola, A.; Walter, M.; Whetten, R. L.; H€kkinen, H.;
a
Gr€nbeck., H. J. Am. Chem. Soc. 2008, 130, 3756–3757.
o
(51) Lopez-Acevedo, O.; Akola, J.; Whetten, R. L.; Gr€nbeck, H.;
o
H€kkinen, H. J. Phys. Chem. C 2009, 113, 5035–5038.
a
(52) Brust, M.; W., M.; Bethell, D.; Schiffrin, D. J.; Whyman, R. J.
J. Chem. Soc., Chem. Commun. 1994, 801–802.
(53) Hostetler, M. J.; Wingate, J. E.; Zhong, C. J.; Harris, J. E.;
Vachet, R. W.; Clark, M. R.; Londono, J. D.; Green, S. J.; Stokes, J. J.;
ARTICLE
Wignall, G. D.; Glish, G. L.; Porter, M. D.; Evans, N. D.; Murray, R. W.
Langmuir 1998, 14, 17–30.
(54) Terrill, R. H.; Postlethwaite, T. A.; Chen, C.-H.; Poon, C.-D.;
Terzis, A.; Chen, A.; Hutchison, J. E.; Clark, M. R.; Wignall, G.; J. Am.
Chem. Soc. 1995, 117, 12537–12548.
(55) Weare, W. W.; Reed, S. M.; Warner, M. G.; Hutchison, J. E.
J. Am. Chem. Soc. 2000, 122, 12890–12891.
(56) Qian, H.; Zhu, Y.; Jin, R. ACS Nano 2009, 3, 3795.
(57) Qian, H.; Zhu, Y.; Anderson, U. N.; Jin, R. J. Phys. Chem. A
2009, 113, 4281–4284.
(58) Zhu, M.; Lanni, M.; Garg, N.; Bier, M. E.; Jin, R. J. Am. Chem.
Soc. 2008, 130, 1138–1139.
(59) Dass, A. J. Am. Chem. Soc. 2009, 131, 11666–11667.
(60) Reilly, S. M.; Krick, T.; Dass, A. J. Phys. Chem. C 2010,
114, 741–745.
(61) Goulet, P. G. J; R. Bruce Lennox, R. B. J. Am. Chem. Soc. 2010,
132, 9582–9584.
(62) Jana, N. R.; Peng, X. J. Am. Chem. Soc. 2003, 125, 14280–14281.
(63) Zheng, N.; Fan, J.; Stucky, G. D. J. Am. Chem. Soc. 2006,
128, 6550–6551.
(64) Dharmaratna, A. C.; Krick, T.; Dass, A. J. Am. Chem. Soc. 2009,
131, 13604–13605.
(65) Zheng, H.; Smith, R. K.; Jun, Y,-W.; Kisielowski, C.; Dahmen,
U.; Alivisatos, A. P. Science 2009, 324, 1309–1312.
(66) Sardar, R.; Shumaker-Parry, J., S. Chem. Mater. 2009, 21,
1167–1169.
(67) Shem, P. M.; Sardar, R.; Shumaker-Parry, J., S. Langmuir 2009,
25, 13279–13283.
(68) Polte, J.; Erler, R.; Thu, A. F.; Thunemann, A. F.; Sokolov, S.;
Ahner, T. T.; Rademann. Emmerling, F.; Kraehnert, R. ACS Nano 2010,
4, 1076–1082.
(69) Polte, J.; Ahner, T. T.; Delissen, F.; Sokolov, S.; Emmerling,
F.; Thunemann, A. F.; Kraehnert, R. J. Am. Chem. Soc. 2010, 132,
1096–1301.
(70) Chen, C. F.; Tzeng, S. D.; Chen, H. Y.; Lin, K. J.; Gwo, S. J. Am.
Chem. Soc. 2008, 130, 824–826.
(71) Bain, C. D.; Troughton, E. B.; Tao, Y. T.; Evall, J.; Whitesides,
G. M.; Nuzzo, R. G. J. Am. Chem. Soc. 1989, 111, 321–335.
(72) Wang, Z. L.; Harfenist, S. A.; Whetten, R. L.; Bentley, J.; Evans,
N. D. J. Phys. Chem. B 1998, 102, 3068–3072.
(73) Woehrle, G. H.; Warner, M. G.; Hutchison, J. E. Langmuir
2004, 20, 5982–5988.
(74) Sardar, R.; Funston, A. M.; Mulvaney, P.; Murray, R. W.
Langmuir 2009, 25, 13840–13851.
(75) Peng, X. G.; Wickham, J.; Alivisatos, P. A. J. Am. Chem. Soc.
1998, 120, 5343–5344.
(76) Murray, C. B.; Kagan, C. B.; Bawendi, M. G. Annu. Rev. Mater.
Sci. 2000, 30, 545–610.
(77) Shields, S. P.; Richards, V. N.; Buhro, W. E. Chem. Mater. 2010,
22, 3212–3225.
(78) Wolfe, R. L.; Murray, R. W. Anal. Chem. 2006, 78, 1167–1173.
(79) Brown, H. C.; Kulkarni, S. U. Inorg. Chem. 1977,
16, 3090–3094.
(80) Brown, H. C.; Kim, S. C.; Krishnamurthy, S. J. Org. Chem. 1980,
45, 1–12.
(81) Hussain, I.; Graham, S.; Wang, Z.; Tan, B.; Sherrington, D. C.;
Rannard, S. P.; Cooper, A. I.; Brust, M. J. Am. Chem. Soc. 2005,
127, 16398–16399.
(82) Lummen, N. K., T. Nanotechnology 2005, 16, 2870–2877.
(83) Badia, A.; Singh, S.; Demers, L.; Cuccia, L.; Brown, R.; Lennox,
R. B. Chem.—Eur. J. 1996, 2, 359–363.
(84) Badia, A.; Cuccia, L.; Demers, L.; Morin, F.; Lennox, R. B. J. Am.
Chem. Soc. 1997, 119, 2682–2692.
8190
dx.doi.org/10.1021/ja107934h |J. Am. Chem. Soc. 2011, 133, 8179–8190