- Trang chủ >>
- Khoa Học Tự Nhiên >>
- Vật lý
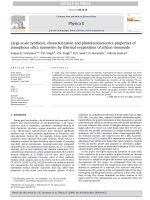
Photoluminescence and growth mechanism of amorphous silica nanowires by vapor phase transport
Bạn đang xem bản rút gọn của tài liệu. Xem và tải ngay bản đầy đủ của tài liệu tại đây (399.85 KB, 6 trang )
Physica E 31 (2006) 218–223
Photoluminescence and growth mechanism of amorphous silica
nanowires by vapor phase transport
Y. Yang
a
, B.K. Tay
a
, X.W. Sun
a,Ã
, H.M. Fan
b
, Z.X. Shen
c
a
School of Electrical and Electronic Engineering, Nanyang Technological University, Nanyang Avenue, Singapore 639798, Singapore
b
Department of Physics, National University of Singapore, Blk S12, 2 Science Drive 3, Singapore 117542, Singapore
c
School of Physical and Mathematical Sciences, Nanyang Technological University, Block 5, 1 Nanyang Walk, Singapore 637616, Singapore
Received 23 November 2005; received in revised form 13 December 2005; accepted 20 December 2005
Available online 21 February 2006
Abstract
Amorphous silica [SiO
x
ð1oxo2Þ] nanowires were fabricated on silicon substrate in an acidic environment by heating the mixture of
ZnCl
2
, and VO
2
powders at 1100 1C. The length of SiO
x
nanowires ranges from micrometers to centimeters, with uniform diameters of
10–500 nm depending on substrate temperature. Room-temperature photoluminescence spectra of the SiO
x
nanowires showed two
strong luminescence peaks in the red and green region, respectively. The photoluminescence was suggested to originate from nonbridging
oxygen hole center (red band), and hydrogen-related species in the structure of SiO
x
(green band). The study on chemical reactions and
growth of the SiO
x
nanowires revealed the formation process of silica nanowires in acidic environment was closely related to the
vapor–solid–liquid mechanism.
r 2006 Elsevier B.V. All rights reserved.
PACS: 66.66.Fn; 6.37.Hk; 78.55.Hx
Keywords: Silica nanowires; Photoluminescence; Vapor phase transport
1. Introduction
One-dimensional (1D) structures with nanometer dia-
meters, such as nanotubes and nanowires, are ideal vehicles
for testing and understanding fundamental concepts about
dimensionality and size effect in, for example, optical,
electrical, and mechanical properties. Their applications
range from probing tips in microscopy to interconnect in
nanoelectronics [1].
The synthesis of 1D nanostructures is of fundamental
importance to nanotechnology. Nanowires are particularly
interesting as they offer the opportunity to investigate
electrical and thermal transport processes in size-confined
systems, with the possibility of providing a deep under-
standing of physics at the nano-scale. Silicon and silica
nanostructures have attracted considerable attention
because of their potential applications in light-emitting
devices compatible to CMOS technology. Amorphous
silica nanowires (SiONWs) are promising 1D luminescence
materials. The photoluminescence (PL) band of bulk silica
or silica films has a peak within 1.6–7.0 eV [2–4] from both
experimental measurements and theoretical calculations.
Yu et al. [5] have pointed out the potential applications of
silica nanowires in high-resolution optical heads of
scanning near-field optical microscope or nanointerconnec-
tions in future integrated optical devices. Much research
interest has recently been directed to synthesize these
materials by various approaches, to understand their
growth mechanism and to realize their controlled growth
on planar substrates.
Various approaches, for instance, vapor phase trans port
[6], bio-mimetic strategies [7,8], excimer laser ablation [9],
physical and thermal chemical evaporation [10–16],
carbothermal reduction [17], thermal chemical vapor
deposition [18], thermal oxidation [19] and solution
method [20,21] have been emp loyed to fabricate the
nanostructured silica with different morphologies including
ARTICLE IN PRESS
www.elsevier.com/locate/physe
1386-9477/$ - see front matter r 2006 Elsevier B.V. All rights reserved.
doi:10.1016/j.physe.2005.12.159
Ã
Corresponding author. Tel.: +65 67905369; fax: +65 67920415.
E-mail address: (X.W. Sun).
silica ‘‘nanoflowers’’ [22], radial patterns of carbonated
silica fibers [10], silica nanowire ‘‘braids’’ [6], ‘‘bundles’’
and silica ‘‘nanobrushes’’ [23]. In the vapor transport
process, catalyst such as In
2
O
3
, Al, Ni, Ga and Sn, and
transport gases such as O
2
, and H
2
, are often introduced
into the reaction. In this paper, we shall report a catalyst-
assisted synthesis of amorphous silica nanowires by vapor
phase transport method in an acidic environment without
transport gas.
2. Experiment
Nanostructural SiONWs have been prepared by a simple
vapor-phase transport method using high-temperature
tube furnace, which has been reported in our previous
work [24]. In brief, the mixture of hydrous zinc chloride
(ZnCl
2
Á nH
2
O) and vanadium dioxide (VO
2
) powder was
placed at the end of a slender one-end sealed quartz tube. A
p-type silicon trip with (1 0 0) orientation was also inserted
into the quartz tube at downstream area with lower
temperature (1090–700 1C) as the source of silicon as well
as substrate. Then the small qua rtz tube was placed into a
bigger quartz tube and pushed into the tube furnace. The
furnace was heated from room temperature to 1100 1C and
kept at this temperature for 30 min. When temperature
reached 975 1C, an extra mechanical pump was used
to collect the white fog due to the hydrolyzation and
oxidation of ZnCl
2
, and maintain a pressure of 2–0.3 Pa in
the tube.
The morphology, size, and crystal structure, of the
SiONWs were determined using a cold cathode field
emission scanning electron microscope (SEM) from Jeol
(model JSM-6340F), and a transmission electron micro-
scope (TEM) from Jeol (model JEM-2010F) too. The
chemical composition analysis was carried out using energy
dispersive X-ray spectroscopy (EDX) which was attached
to the SEM. PL measurements were carried out at room
temperature using a Micro-PL system from Renishaw. The
excitation line used was 325 nm and the average power was
10 mW. Laser beam was focused into a spot diameter
below 1 mm on the specimen in the PL measurement.
3. Results and discussion
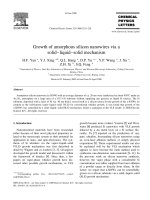
Figs. 1(a) and (b) show the SEM images of the nanowires
with high aspect ratio (length/diameter). Fig. 1(c) shows
the photograph of the sample, with positions (a) and (b)
labeled, the SEM images in Figs. 1(a) and (b) were taken,
respectively. It can be seen from Fig. 1(c) that bulk
quantity of cotton-like nanostructures was formed. The
cotton-like SiONWs were formed on silicon wafer with
temperature ranged from 1050 to 720 1C due to a
temperature gradient. The average diameter of SiO
x
nanowires varied from 10 to o100 nm when the substrate
temperature decreased from 1050 to 1000 1C (region A
which is near the powder source), Fig. 1(a), and it suddenly
increased from o100 to 500 nm when the substrate
temperature decreased from 1000 to 720 1C (region B
which is further away from the source), Fig. 1(b). Fig. 1(a)
is a typical SEM image of product found in region A. It can
be seen that the products synthes ized consist of a large
number of curved SiO
x
nanowires with length of a few tens
of micrometers. Fig. 1(b) shows that the products in region
B generally align in one direction with length up to a few
hundreds of micrometers. The diameters measured are
around 200 nm. Some SiONW nanowires grown in
1000–720 1C region were up to 1 cm in length, which was
observed in SEM by tracking the nanowires in their growth
direction. Similar cotton-like nanowires has been obtained
by Lee et al. [25] grown on TiN/Ni/Si and TiN/Ni/SiO2
substrates.
ARTICLE IN PRESS
Fig. 1. Low magnification SEM images of the amorphous silica nanowires
deposited at two different temperature regions: (a) region A of
1050–1000 1C, 1020 1C (the average diameter is 30–50 nm); (b) region B
of 1000–720 1C, 900 1C (the average diameter is around 200 nm); (c) photo
of a typical sample growing on a silicon trip.
Y. Yang et al. / Physica E 31 (2006) 218–223 219
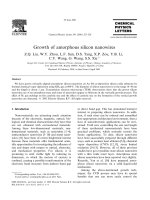
Fig. 2(a) shows a TEM image of the SiO
x
nanowires
obtained near 1000 1C temperature region. The inset is the
corresponding selected-area electron diffraction (SAED)
pattern recorded from the nanowires. The as-deposited
SiONWs is of amorphous phase, indicated by the highly
diffusive SAED ring pattern. We can see that, the
nanowires are remarkably clean and smooth. Fig. 2(b)
shows the high-magnification TEM image of a catalyst tip,
and Figs. 2(c) and (d) are the corresponding SAED and
high-resolution TEM image of the catalyst, respectively.
The catalyst is crystallized and surrounded by amorphous
silica, indicating that the growth process of amorphous
silica nanowires is catalyst-assisted.
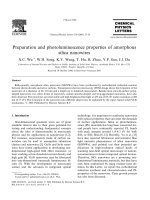
EDX was applied to examine the chemical composition
of the as-grown nanowires. Fig. 3(a) shows the EDX
spectrum of the round tip on top of a nanowire (Fig. 2(b)),
and Fig. 3(b) shows the EDX spectrum from long bundles
of tangled silica nanowires in Fig. 1(b), where the
nanowires are so long that almost no tip was in the area
examined. Analyzing Figs. 3(a) and (b) using the EDX
spectrometer’s own computer program, the chemical
compositions are 48.77 at% of O, 41.87 at% of Si,
8.66 at% of V, 0.74 at% of Zn, and no Cl, for the catalyst
tip in Fig. 2(b), and 60.28 at% of O, 39.40 at% of Si,
0.32 at% of V, and no Zn or Cl, for the long nanowires in
Fig. 1(b). Thus, it is confirmed that, V acted as a catalyst in
the growth of silica nanowires; however, most of Zn (ZnO
x
or ZnCl
2
) with a low-melting point, was probably pumped
out from the tube. It is worth mentioning that, the
composition obtained here serves only as an evidence for
our argument, as in general, there is about 1% error in the
composition analysis from EDX.
Fig. 4 shows the room-temperature PL spectra of the as-
grown SiONW sample obtained under excitation of 325 nm
(3.8 eV) light from He–Cd laser. For the first time, both
distinct PL bands corresponding to red and green light
emissions are observed aroun d 770 nm (1.61 eV) and
550 nm (2.25 eV), respectively. By fitting the curves by
two Gaussian functions, two peak energies E
red
(red
ARTICLE IN PRESS
Fig. 2. (a) TEM image (the inset shows the SAED pattern) of the as-
grown amorphous SiO
x
nanowires in the temperature region of $ 1000 1C;
(b) TEM image of a catalyst tip, and the corresponding (c) SAED and (d)
high-resolution TEM image.
Fig. 3. EDX spectra for (a) the catalyst tip in Fig. 2(b), and (b) tangled
long silica nanowires in Fig. 1(b).
400 500 600 700 800 90
0
0
1000
2000
3000
4000
5000
6000
7000
8000
E
red
E
green
500 nm
100 nm
50 nm
PL intensity (a.u.)
Wavelen
g
th
(
nm
)
Fig. 4. Photoluminescence spectra recorded at room temperature from
SiONWs with the diameters of $50, $100, and $500 nm, respectively.
Y. Yang et al. / Physica E 31 (2006) 218–223220
emission band) and E
green
(green emission band) can be
obtained, although the fitting was quite subjective. The
results are tabulated in Table 1 . The red emission band has
a relatively constant intensity, and a red-shift of about
18 nm, while the green emission band becomes weaker
compared to the red ones, and shows a blue-shift of about
14 nm, as the average diameter of nanowires increases from
$50 to $ 500 nm, corresponding to SEM observations. It is
worth mentioning that, an average diameter of 50 nm is too
thick to show any distinct quantum effect on PL. Thus the
relatively small shift in emission peaks should not be
directly related to size reduction.
There are several nanostructure defects related to the PL
of the SiO
x
system. The red emission band at 1.61 eV is
attributed to bulk non-bridged oxygen hole center
(NBOHC), which is denoted as Si2O
[26,27]. The
NBOHC induced band was observed in the oxygen-rich
silica and in the high –OH content silica. For our oxygen-
deficient but –OH rich sample, it is possible for the
NBOHC ð Si2O
Þ to be induced by the high-energy
photon (3.8 eV) excitation in our PL measurement:
Si2 O2O2Si ! 2ð Si2O
Þ
or
Si2 OH ! Si2O
þ
H:
The red emission band properties observed in our PL
spectra are similar to those of surface-oxidized silicon
nanocrystals, and mesoporous silica [26], without the
exhibition of green emission band.
The green emission band at 2.25 eV can be attributed to
hydrogen-related species in the composites of SiONWs
[28]. Defect concentration in SiONWs is related primarily
to the high surface area and the complex chemistry that
occurs during growth. Thus the PL intensity is highly
related to surface area and inverse proportional to
nanowire diameters as observed in Fig. 4. Considering
the width of the red ($150 nm full-width half-maximum
(FWHM)) and green ($100 nm FWHM) emissions in
Fig. 4, the maximum peak shifts for red (18 nm) and green
(14 nm) emissions for nanowires with different diameters
are rather small (Table 1 and Fig. 4). Obviously, the large
widths of red and green emissions indicate a large range of
energy transitions, and the emission peak should corre-
spond to the dominant transition [29]. At the moment, we
cannot identify a direct link between the shift and the
nanowire diameter. However, we speculate that the peak
shifts for nanowires with different diameter are due to the
fabrication temperature, at which these nanowires grow.
The temperature directly affects the chemical reactions
(reaction rates) during nanowire formation, resulting in
various defects with varied concentration. According to
Liu et al. [30] , the VO
2
has a weak and broad emission
band near 600 nm. However, PL from catalyst can be
ignored since it is not the major component in the area
examined (Fig. 3(b)).
The well accepted vapor–liquid–solid (VLS) mechanism
is responsible for the catalyst-assisted amorphous SiO
x
nanowires growth in our experiment [5,31]. The key factor
in VLS is the formation of liquid droplets due to adding a
liquid forming agent. Due to the existence of a temperature
gradient downstream the quartz tube, liquid droplets were
formed from vapor phase, from the reaction happened in
quartz tube. However, there was no extra silicon source
besides silicon substrate; thus, we suggest that the
formation of SiO
x
is related to the reaction of ZnCl
2
and
silicon. Vadadium or VO
x
evaporated from VO
2
acts as
catalyst for silica nanowire to grow by VLS growth
mechanism. The reactions between VO
2
and oxidants
(i.e., O
2
and Cl
2
) were not considered because the VO
2
was not oxidized to higher oxidation state (V
5+
) indicated
by the color of this oxide on substrate where nanowires
could be found. Further investigation using V
2
O
5
instead
of VO
2
revealed that neither catalyst tip nor silica
nanowires could be found; with the absence of VO
2
, ZnO
nanowires were found growing on Si substrates, which is
consistent with our previous work [32]. Thus, the catalyst
should be related to V
4+
compound.
As we know, ZnCl
2
is highly hygroscopic. The powder
used in our experiment was actually ZnCl
2
Á nH
2
O, which
behaves as a mild Lewis acid, with a pH value of around 4
[33]. It is hydrolyzed to an oxychloride when hydrated
forms are heated. Among the solid reactant, ZnCl
2
has the
lowest melting and boiling points (275 and 756 1C,
respectively) [34]. When the temperature at the source
approached 800 1C or higher, the tube was heavily filled
with white fog. The porous silicon substrate after experi-
ments, suggests that, when the furnace is heated from room
temperature to 1100 1C, Si, O
2
(residue in air), and ZnCl
2
containing moisture may react in a complex way. Experi-
ments without ZnCl
2
did not produce any silica nanowire,
indicating that the ZnCl
2
must be a source of silicon wafer
etchant. In accordance with the SEM, TEM and EDX
data, the main reactions that could produce SiONWs are as
follows:
Hydrolyzation of ZnCl
2
Á nH
2
O [35]
2ZnCl
2
ðlÞþH
2
OðlÞ!Zn
2
OCl
2
ðgÞþ2HClðgÞ.
Oxidation of ZnCl
2
in the melt [36]
ZnCl
2
ðlÞþ1=2O
2
ðgÞ!ZnOClðgÞþ1=2Cl
2
ðgÞ and
ZnCl
2
ðlÞþx=2O
2
ðgÞ!ZnO
x
ðlÞþCl
2
ðgÞ.
ARTICLE IN PRESS
Table 1
Peak emission wavelength of silica nanowires with an average diameter of
50, 100, and 500 nm, respectively, obtained by fitting the curves in Fig. 4
Diameter (nm) Peak wavelength of E
red
(nm)
Peak wavelength of E
green
(nm)
50 755.0 569.0
100 768.0 567.7
500 773.7 555.2
Y. Yang et al. / Physica E 31 (2006) 218–223 221
Adsorption on substrate [37]
Cl;
Cl
2
þ Si ! Si
surf
À xCl þ 1=2H
2
ðgÞ;
HCl:
8
>
<
>
:
Chemical reaction
Si À xCl ! SiCl
xðadsÞ
.
Product desorption
SiCl
xðadsÞ
! SiCl
x
ðgÞ.
Oxidation
SiCl
x
ðgÞþx=2O
2
ðgÞ!SiO
x
ðgÞþx=2Cl
2
,
2ZnðgÞþxO
2
ðgÞ!2ZnO
x
ðgÞ.
Hence, the white fog may contain SiO
x
,Cl
2
, HC l, ZnO
x
,
ZnCl
2
, and zinc oxychloride, with little amount of VO
2
.
Since vapor pressure of VO
2
is low even at high
temperature, and the melting point of VO
2
is 1967 1C
[33],VO
2
is most likely alloyed with Si or SiO
x
to form
liquid drops at higher temperature. The bond enthalpies in
gaseous diatomic species of Si–O bond, Zn–O bond, and
Zn–Cl bond are 799.6713.4, 15974, and 228.9719.7 kJ/
mol [38], respectively; and the lattice energy in a thermo-
chemical cycle of SiO
2
, ZnO, and ZnCl
2
are calculated to
be 13125, 3971, and 2734 kJ/mol [39], respectively; while
SiCl
4
in vapor pha se at high temperature is known to be
unstable. It is much easier to break the Si–Cl and Zn–Cl
bonds than the Si–O and Zn–O bonds; i.e. it is more easily
to form SiO
2
than the rest compounds during reactions.
From our experiments, pumping was necessary for synth-
esis of SiONWs with co ntrolled amount of zinc and
chloride residue. By keep pumping the furnace tube, small
liquids of ZnO
x
and zinc oxychloride vapor could be
sucked out with the high substrate temperature ranging
from 1050 to 720 1C. Meanwhile, gases containing Cl
2
,
and HCl could be sucked out as well to avoid excessive
etching of substrate. It is worth mentioning that, although
both ZnO
x
and SiCl
x
are in vapor phase, SiCl
x
is an
intermediate phase of a series of chemical reactions, and it
oxidized quickly into SiO
x
with much lower vapor
pressure. However, ZnO
x
is one of the final products of
the chemical reactions and has a much higher vapor
pressure. So ZnO
x
can be mostly sucked out by the pump.
4. Conclusion
In conclusion, amorphous silica nanowires have been
successfully fabricated from the mixture of ZnCl
2
, and VO
2
on silicon substrate by controlling the conditions of the
vapor-phase transport. Ultra-long cotton-like nanowires
with average diameters of $ 50 nm show both strong PL of
red and green light originated from surface NBOHC defect
and nonstoichiometric structure. The morphology of SiO
x
is dependent on synthesis temperature.
Acknowledgement
Financial support from Research Grant Manpower
Fund (RGM 21/04) of Nanyang Technological University,
Singapore is gratefully acknowledged.
References
[1] A.P. Alivisatos, Science 271 (1996) 933.
[2] L.S. Liao, X.M. Bao, X.Q. Zheng, N.S. Li, N.B. Min, Appl. Phys.
Lett. 68 (1996) 850.
[3] H. Nishikawa, T. Shiroyama, R. Nakamura, Y. Ohki, Phys. Rev. B
45 (1992) 586.
[4] L. Skuja, J. Non-Cryst. Solids 239 (1998) 16.
[5] D.P. Yu, Q.L. Hang, Y. Ding, H.Z. Zhang, Z.G. Bai, J.J. Wang,
Y.H. Zou, W. Qian, G.C. Xiong, S.Q. Feng, Appl. Phys. Lett. 73
(1998) 3076.
[6] C.X. Xu, X.W. Sun, M.B. Yu, Y.Z. Xiong, Z.L. Dong, J.S. Chen,
Appl. Phys. Lett. 85 (2004) 5364.
[7] S.A. Davis, S.L. Burkett, N.H. Mendelson, S. Mann, Nature 385
(1997) 420.
[8] Q.S. Huo, D.Y. Zhao, J.L. Feng, K. Weston, S.K. Buratto, G.D.
Stucky, S. Schacht, F. Schuth, Adv. Mater. 9 (1997) 974.
[9] Y.Q. Zhu, W.B. Hu, W.K. Hsu, M. Terrones, N. Grobert, T. Karali,
H. Terrones, J.P. Hare, P.D. Townsend, H.W. Kroto, D.R.M.
Walton, Adv. Mater. 11 (1999) 844.
[10] Z.J. Zhang, G. Ramanath, P.M. Ajayan, D. Goldberg, Y. Bando,
Adv. Mater. 13 (2001) 197.
[11] B. Zheng, Y.Y. Wu, P.D. Yang, J. Liu, Adv. Mater. 14 (2002) 122.
[12] S. Sun, G. Meng, M. Zhang, Y. Hao, X. Zhang, L. Zhang, J. Phys.
Chem. B 107 (2003) 13029.
[13] Y.W. Wang, C.H. Liang, G.W. Meng, X.S. Peng, L.D. Zhang,
J. Mater. Chem. 12 (2002) 651.
[14] K.S. Wenger, D. Cornu, F. Chassagneux, T. Epicier, P. Miele,
J. Mater. Chem. 13 (2003) 3058.
[15] K.H. Lee, H.S. Yang, K.H. Baik, J. Bang, R.R. Vanfleet,
W. Sigmund, Chem. Phys. Lett. 383 (2004) 380.
[16] P.X. Gao, Z.L. Wang, J. Phys. Chem. B 106 (2002) 12653.
[17] X.C. Wu, W.H. Song, K.Y. Wang, T. Hu, B. Zhao, Y.P. Sun,
J.J. Du, Chem. Phys. Lett. 336 (2001) 53.
[18] Z.Q. Liu, W.Y. Zhou, L.F. Sun, D.S. Tang, X.P. Zou, Y.B. Li,
C.Y. Wang, G. Wang, S.S. Xie, Chem. Phys. Lett. 341 (2001) 523.
[19] J.Q. Hu, Y. Jiang, X.M. Meng, C.S. Lee, S.T. Lee, Chem. Phys. Lett.
367 (2003) 339.
[20] M. Zhang, Y. Bando, K. Wada, K. Kurashima, J. Mater. Sci. Lett. 18
(1999) 1911.
[21] C.L. Shao, H. Kim, J. Gong, D. Lee, Nanotechnology 12 (2002) 635.
[22] Y.Q. Zhu, W.K. Hsu, M. Terrones, N. Grobert, H. Terrones, J.P.
Hare, H.W. Kroto, D.R.M. Walton, J. Mater. Chem. 8 (1998) 1859.
[23] Z.L. Wang, R.P.P. Gao, J.L. Gole, J.D. Stout, Adv. Mater. 12 (2000)
1938.
[24] B.J. Chen, X.W. Sun, C.X. Xu, B.K. Tay, Physica E 21 (2004) 103.
[25] K.H. Lee, C. Lofton, K. Kim, W.S. Seo, Y. Lee, M.H. Lee,
W. Sigmund, Solid State Commun. 131 (2004) 687.
[26] Y.D. Glinka, S.H. Lin, L.P. Hwang, Y.T. Chen, Appl. Phys. Lett. 77
(2000) 3968.
[27] Y.D. Glinka, S.H. Lin, Y.T. Chen, Phys. Rev. B 62 (2000) 4733.
[28] Y.D. Glinka, S.H. Lin, Y.T. Chen, Appl. Phys. Lett. 75 (1999) 778.
[29] A.S. Zyubin, Y.D. Glinka, A.M. Mebel, S.H. Lin, L.P. Hwang,
Y.T. Chen, J. Chem. Phys. 116 (2002) 281.
[30] H. Liu, O. Vasquez, V.R. Santiago, L. Diaz, F.E. Fernandez,
J. Luminescence 108 (2004) 233.
[31] A.M. Morales, C.M. Lieber, Science 279 (1998) 208.
[32] C.X. Xu, X.W. Sun, Z.L. Dong, M.B. Yu, T.D. My, X.H. Zhang,
Nanotechnology 15 (2004) 839.
ARTICLE IN PRESS
Y. Yang et al. / Physica E 31 (2006) 218–223222
[33] A. Arbor, Handbook of Chemistry and Physics, 71st ed., CRC Press,
MI, 1990.
[34] N.N. Greenwood, A. Earnshaw, Chemistry of the Elements, second
ed., Butterworth, UK, 1997.
[35] S. Grunaner, Z. Anorg, Allg. Chem. 39 (1904) 389.
[36] S.H. Son, F. Tsukihashi, ISIJ Int. 43 (2003) 1356.
[37] D.L. Flamm, Pure Appl. Chem. 62 (1990) 1709.
[38] D.R. Lide, Handbook of Chemistry and Physics, 81st ed., CRC Press,
Boca Raton, FL, USA, 2000.
[39] D.R. Lide, Handbook of Chemistry and Physics, 79th ed., CRC
Press, Boca Raton, FL, USA, 1998.
ARTICLE IN PRESS
Y. Yang et al. / Physica E 31 (2006) 218–223 223