- Trang chủ >>
- Khoa Học Tự Nhiên >>
- Vật lý
Photoluminescence of silicon nanowires obtained by epitaxial chemical vapor deposition
Bạn đang xem bản rút gọn của tài liệu. Xem và tải ngay bản đầy đủ của tài liệu tại đây (564.46 KB, 3 trang )
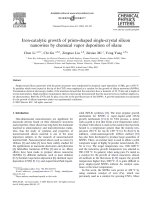
Photoluminescence of silicon nanowires obtained by epitaxial
chemical vapor deposition
O. Demichel
a,
Ã
, F. Oehler
a
, V. Calvo
a
,P.Noe
´
a
, N. Pauc
a
, P. Gentile
a
, P. Ferret
b
, T. Baron
c
, N. Magnea
a
a
CEA-Grenoble, INAC/SP2M/SiNaPS, 17 rue des Martyrs, 38054 Grenoble Cedex 9, France
b
CEA-Grenoble, LETI/DOPT/SIONA, 17 rue des Martyrs, 38054 Grenoble Cedex 9, France
c
CNRS-LTM, 17 rue des Martyrs, 38054 Grenoble Cedex 9, France
article info
Available online 28 August 2008
PACS:
71.35.Ee
78.55.Ae
78.67.Àn
Keywords:
Nanowires
Silicon
Photoluminescence
Exciton
Electron-hole-plasma
abstract
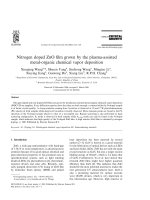
We have carried out photoluminescence measurements of silicon nanowires (SiNWs) obtained by the
chemical vapor deposition method with a copper-catalyzed vapor–liquid–solid mechanism. The
nanowires have a typical diameter of 200 nm. Spectrum of the as-grown SiNWs exhibits radiative states
below the energy bandgap and a small contribut ion near the silicon gap energy at 1.08 eV. A thermal
oxidation allows to decrease the intensity at low energy and to enhance the intensity of the 1.08 eV
contribution. The behavior of this contribution as a fun ction of the pump power is correlated to a free
carrier recombination. Furthermore, the spatial confinement of the carriers in SiNWs could explain the
difference of shape and recombination energy of this contribution compared to the recombination of
free exciton in the bulk silicon. The electronic system seems to be in an electron–hole plasma (ehp), as it
has already been shown in SOI structures [M. Tajima, et al., J. Appl. Phys. 84 (1998) 2224]. A simulation
of the radiative emission of an ehp is performed and results are discussed.
& 2008 Elsevier B.V. All rights reserved.
1. Introduction
The silicon n anowir es (SinWs) obtained by the chemical va por
deposition (CVD) method [1–4] are r eally promising for electronics
and op to-electro nics thanks to thei r very i nt er esting int egr ation
properties. They are compatible with the s ilicon technology and
could be m ost elegantly grown directly at their final p osition in a
device on a waf er. Howev er, the nanowi r e epitaxial gro wt h requir e s
the use of a metallic catalyst. Gold is the one most used because the
Si–Au eutectic temperature is r elatively low. But, it is w ell known
that gold creates deep-level defect in silicon, which is detrimental to
good device operation. For the moment, the influence of catalyst on
the n anowire properties is n o t well understood and other cataly sts
as TiSi2 [5] or Cu [6] can catalyze the growth. Here, we report on
photoluminescence (PL) measurements of copper -catalyzed SiNWs.
As the nanowire diameters are hundreds of nanometers, there is no
quantum confinement o n electronic c arriers.
2. Experimental
2.1. Sample preparation
The SiNWs are obtained by the CVD method using a vapor–
liquid–solid mechanism. A thin copper layer (typically 5 nm)
is evaporated on a silicon substrate. This layer is then heated at
850 1C under a hydrogen atmosphere to allow the formation of
copper droplets with diameters of 100–300 nm. A silane–
hydrogen–hydrogen chloride mixture flow allows the SiNWs
growth (temperature $800 1C during 40 min). Fig. 1a shows
that the NW diameters are given by the catalyst size. Thus, in
our experimental conditions, we obtained a high density of
80-
m
m-long SiNWs with diameters of 200 nm (Fig 1c). A catalyst
removal followed by a thermal oxidation is performed on
SiNWs (Fig. 1b). To remove the copper droplets, the sample is
deoxidized in a 49% HF solution during 1 min and then dipped for
2 min in an aqua regia bath (HCl(37%):HNO3(70%), 2:1). The
thermal oxidation is performed in a furnace at 960 1C under a
10 mbar O
2
flow during 1 h. The samples cool down to room
temperature in the furnace under a 10 mbar forming gas (H
2
:N
2
,
5:95) flow. The thermal oxide thickness is estimated to be
5–10 nm.
2.2. Photoluminescence
The optical pump of the PL experiment is a pulsed triple
Nd:YAG laser. The pulses are 10 ns long and the repetition rate is
4 kHz and the excitation wavelength is 355 nm. The excitation
beam is focused on a spot of 500
m
m diameter. Thus, the
pump power density can be modulated from 5 kW/cm
2
up to
300 kW/cm
2
during the pulses. Samples are cooled down in a
liquid helium circulation cryostat allowing a temperature control
from 4.2 up to 300 K. The SiNWs’ luminescence is analyzed in the
ARTICLE IN PRESS
Contents lists available at ScienceDirect
journal homepage: www.elsevier.com/locate/physe
Physica E
1386-9477/$ - see front matter & 2008 Elsevier B.V. All rights reserved.
doi:10.1016/j.physe.2008.08.054
Ã
Corresponding author.
E-mail address: (O. Demichel).
Physica E 41 (2009) 963–965
IR range (0.9À1.3 eV) with an InGaAs CCD, where indirect bandgap
luminescence is expected.
3. Results and discussion
Fig. 2 compares the normalized PL spectra for the as-grown
copper catalyzed SiNWs (red dash–dot curve), for the oxidized
SiNWs (black solid curve) and for the crystalline silicon substrate
(blue dash curve). All spectra are obtained at 10 K with a pump
power density of 174 kW/cm
2
. One can clearly differentiate the
substrate response from the PL spectrum of as-grown or oxidized
SiNWs. The density of SiNWs is high enough to avoid substrate
excitation and to ensure that the luminescence is directly coming
from the NWs. The PL of the as-grown sample exhibits a low
energy band whose origin is not well understood at this moment
but could be attributed to dislocations [7]. In contrast, the small
contribution at 1.08 eV could be attributed to the recombination
of free carriers in the conduction and valence bands. However, the
presence of the broad band does not allow us to conclude clearly
on the electronic system which emits at this energy. The spectrum
of oxidized SiNWs (black solid curve) is dominated by this 1.08 eV
contribution. As thermal oxidation is known to passivate the
silicon surface states, low-energy states (below 1.04 eV) can be
attributed to surface states. The thermal oxidation is an essential
step to exhibit a near gap contribution, thanks to its passivating
role. We then study the dependence of the passivated SiNWs
PL as a function of pump power. When pump power increases,
the 1.08 eV contribution progressively dominates the spectrum
(Fig 3a). And the plot (Fig 3b) of the maximum of intensity of this
contribution (squares) as a function of the pump power density
highlights a linear reliance on pump power. These behaviors are in
agreement with a progressive filling of the conduction and
valence bands and the recombination of free carriers in SiNWs.
In contrast, the 0.95 eV intensity (circles) is saturating. Spatial
confinement of carriers could explain the energy shift and the
change in the spectrum shape compared to the bulk silicon (free
excitons). The many-body interactions could explain a broader
lineshape and a smaller recombination energy. The interacting
electron–hole system, also called an electron–hole plasma (ehp)
[14,15], has already been observed in 20 0-nm-thick silicon on
insulator thin films [8–10].
Simulation of the emission spectrum of an ehp by a convolu-
tion product of the density of states of the carriers affected by the
Fermi–Dirac distribution is performed:
Iðh
u
Þ¼
Z
1
À1
r
e
ðÞ
r
h
ð À h
u
Þf
FD
e
ðÞf
FD
h
ð À h
u
Þ d
The densities of states are calculated for a three-dimensional
system. The temperature-dependent expression of the gap energy
ARTICLE IN P RESS
Fig. 1. MEB images of the nanowires obtained by a CVD method. The nanowires are copper catalyzed. (a) As-grown nanowire with its catalyst droplet. Its diameteris
120 nm. (b) Image of a SiNW obtained after the passivation step. (c) Side view of the sample shows the length (close to 80
m
m) and the density of the sample studied here.
Fig. 2. Normalized intensity of the PL measurements of the as-grown (red dash–dot
curve) and passivated (black solid curve) SiNWs. We compare them to the substrate
(blue dash curve) PL. These spectra are obtained under an excitation power density
of 174kW/cm
2
and the temperature of consign of the cryostat is 10 K.
O. Demichel et al. / Physica E 41 (2009) 963–965964
in bulk Si [11] and the Vashishta [12] expression for the gap
renormalization (due to the coulombian electron–hole interac-
tions), which depends essentially on the ehp density, are used. We
assume that coulombian interactions only affect the gap energy
and not the electron/hole effective masses. Thus, the computation
of the ehp emission spectrum depends on electronic temperature
and ehp density. Fig. 4 shows the comparison of the experimental
spectrum obtained at 10 K for a pump power density of
84 kW/cm
2
and the fitted emission spectrum of an ehp with a
temperature of 86 K and a density close to 5 Â10
18
cm
À3
. However,
the theoretical value of the electron–hole liquid at thermodyna-
mical equilibrium in bulk silicon and SOI layer is close to
3 Â10
18
cm
À3
[13]. This latter value corresponds to the incom-
pressible electron–hole phase, the so-called e–h liquid. Results are
different from a SOI layer, but as the excitation is pulsed
the electronic system is not at equilibrium during our experiment.
The computation did not take into account the dynamics of the
system, and gives mean values of the density and the temperature
(/nS$5.10
18
cm
À3
, /TS$86 K) of the system. In any case, the
shape of the simulation is in good agreement with experimental
spectrum and that could confirm the presence of a plasma phase.
But at this step of the study we cannot conclude on the phase
diagram. To evaluate the density and temperature at equilibrium
either a continuous PL experiment or a time-resolved PL
experiment must be made.
4. Conclusions
We have shown evidence of a band to band electron–hole
recombination in the SiNWs obtained by a CVD method. The
passivation of the SiNW surfaces is essential to reduce the deep
trap density and allow the observation of the radiative recombi-
nation of a free electron–hole system. This system differs from the
bulk silicon, and we attribute the 1.08 eV contribution to the
recombination of an electron–hole plasma.
Acknowledgement
This work is supported by the French PREEANS ANR project.
References
[1] D.P. Yu, et al., Appl. Phys. Lett. 73 (1998) 3076.
[2] Z.G. Bai, et al., Mater. Sci. Eng. B 72 (2000) 117.
[3] T. Bryllert, et al., IEEE Electron Device Lett. 27 (2006) 323.
[4] V. Schmidt, et al., Small 2 (2006) 85.
[5] A.R. Guichard, et al., Nano Lett. 6 (9) (2006) 2140.
[6] J. Arbiol, Nanotechnology 18 (30) (2007) 305606.
[7] G. Jia, et al., Semiconductors 41 (4) (2007) 391.
[8] M. Tajima, et al., J. Appl. Phys. 84 (1998) 2224.
[9] N. Pauc, et al., Phys. Rev. B 72 (2005) 205324.
[10] N. Pauc, et al., Phys. Rev. Lett. 92 (20 04) 23682.
[11] Robert Hull (Ed.), Properties of Crystalline Silicon, Inspec publication.
[12] P. Vashishta, et al., Phys. Rev. B 10 (25) (1982) 6492.
[13] T.M. Rice, et al., Solid State Physics, vol. 32, Academic Press, New York, 1977.
[14] Ya. Pokrovskii, Phys. Stat. Sol. A 11 (1972) 385.
[15] L.V. Keldysh, in: Proceedings of the Ninth International Conference on Physics of
Semiconductors, Moscow, Academy of Sciences of USSR, Nauka, 1968, p. 1307.
ARTICLE IN PRESS
Fig. 3. (a) Pump power dependency of the PL spectra of the passivated SiNWs
obtained for a cryostat temperature of 10 K. The ehp contribution is clearly
exhibited. (b) Intensity at 0.95 eV (red circles) and at 1.08 eV (black squares). The
graph shows clearly the linear dependency of the maximum intensity of the ehp
contribution versus the pump power density. In contrast, the trap states are clearly
saturating with the pump power. These behaviors are in agreement with two
different electronic systems. The first one is a band-to-band recombination, and
the other one is a trap-assisted electron–hole recombination.
Fig. 4. Comparison of the experimental spectrum (green dash curve) with
simulated emission of an ehp (red solid curve). The experimental curve is the
luminescence of passivated SiNWs obtained at 10 K and for a pump power of
84 kW/cm
2
. The fitted curve corresponds to an electronic temperature close to
86 K, an ehp density close to 5 Â 10
18
cm
À3
.
O. Demichel et al. / Physica E 41 (2009) 963–965 965