- Trang chủ >>
- Khoa Học Tự Nhiên >>
- Vật lý
Visible photoluminescence from silicon ion implanted sio2 ï¬lm and its multip
Bạn đang xem bản rút gọn của tài liệu. Xem và tải ngay bản đầy đủ của tài liệu tại đây (111.88 KB, 6 trang )
Visible photoluminescence from silicon-ion-implanted SiO
2
film and its multiple mechanisms
H. Z. Song and X. M. Bao
National Laboratory of Solid State Microstructures and Department of Physics, Nanjing University, Nanjing 210093,
People’s Republic of China
͑Received 1 October 1996͒
Strong photoluminescence from silicon-ion-implanted thermal SiO
2
film was investigated under various
conditions. The photoluminescence spectrum of as-implanted samples or samples annealed in N
2
at a tempera-
ture below 1000 °C consists of three bands centered at about 470, 550, and 630 nm. Annealing at a temperature
above 1000 °C for a long enough time brings about one photoluminescence band peaking at about 730 nm. The
peak wavelengths of these four bands are all independent of annealing or excitation conditions. As the anneal-
ing temperature is increased, 470-, 550-, and 630-nm bands are initially intensified and then weakened with the
intensity maxima at 600, 300, and 200 °C, respectively; as the annealing time increases from 1 min, they are
monotonously weakened. The 730-nm band is always strengthened whether with increasing annealing time or
temperature within our experimental range. In addition, these four bands show different excitation behaviors.
The discussion section argues that the 470-, 550-, and 630-nm bands result from different point defects in the
bulk of silicon implanted SiO
2
, while the 730-nm one results from luminescence centers at the interface
between the nanocrystal silicon and SiO
2
matrix. ͓S0163-1829͑97͒03011-7͔
I. INTRODUCTION
The observation of intense visible luminescence at room
temperature from low-dimensional silicon structures
1
created
an opportunity for incorporating optoelectronic functions in
silicon integrated-circuits technology. From then on, count-
less studies focused on silicon-based light-emitting materials.
Following the electrochemical technique fabricating porous
silicon,
1
many other methods such as plasma deposition from
silane,
2–5
silicon-ion implantation into SiO
2
,
6–11
glass-melt
reaction,
12
crystallization of amorphous silicon,
13
silicon and
SiO
2
rf cosputtering,
14
and reactive ion-etching techniques
15
were used to make silicon nanostructures. Among these, the
most attention was paid to silicon-ion-implanted SiO
2
be-
cause of many advantages of the method of ion implantation:
routinely used in integrated-circuits technology, enhancing
the mechanical and thermal stability, and enabling one to
rule out some of the alternative luminescence sources.
Shimizu-Iwayama et al.
6
used silicon-implanted silica glass
to prepare silicon nanostructure and obtained visible photo-
luminescence ͑PL͒. They observed two bands at 1.9 and 1.7
eV, and ascribed them to E
Ј
center defects and the presence
of silicon nanocrystals, respectively.
6–9
Thermally grown
SiO
2
is much closer to silicon-based light-emitting materials,
and much more compatible to the microelectronic technol-
ogy than silica glass, so silicon-implanted thermal SiO
2
grown on crystal silicon is a promising candidate for silicon-
based light-emitting materials. With respect to this system,
Komoda et al.
11
reported 600–800-nm luminescence, and
Mutti et al.
10
observed 490–540-nm luminescence. They
both ascribed the luminescence to quantum confinement of
nanocrystal silicon. Cheong et al.
6
supplied more evidence
for the quantum confinement effect by the hydrostatic pres-
sure measurement. However, Liao et al.
17,18
observed 470-
and 550- nm emission and found them defect related. It
seems that there are multiple luminescence origins for
silicon-implanted SiO
2
. Considering the controversial lumi-
nescence mechanism and a lack of overall knowledge, we
intend to study the PL evolution of the silicon-implanted
thermal SiO
2
layer in a wide treatment and measurement
range, to show a complete description of the luminescence
property of this prospective silicon-based light-emitting ma-
terial.
II. EXPERIMENTS AND RESULTS
Samples were prepared by Si
ϩ
implantation at an energy
120 keV and with a dose 2ϫ10
16
cm
Ϫ2
, at room temperature,
into the SiO
2
layer thermally grown on ͑100͒-oriented, 5
⍀ cm, p-type silicon substrate. The thickness of the SiO
2
layer was 360 nm. The implantation region is at a depth
between 90 and 170 nm below the surface. Silicon-implanted
wafers were subsequently annealed at temperatures from
100 °C to 1150 °C in a controlled N
2
atmosphere. Annealing
for shorter than 2 min was performed in a KST-2 rapid ther-
mal processor, and that for a longer time was in a quartz
furnace. The PL spectra and PL excitation ͑PLE͒ spectra
were measured on a Hitachi 850 fluorescence spectropho-
tometer at room temperature. The excitation wavelength is
250 nm in this work unless noted otherwise.
Intense visible light emission from our samples was easily
observed at room temperature. The samples with the stron-
gest PL have intensities higher than 10% of that for a typical
aged porous silicon sample under the same ultraviolet exci-
tation. As shown in Fig. 1, the PL spectrum for the as-
implanted sample without annealing or the sample annealed
below 1000 °C ͑these two cases will be just termed as ‘‘be-
low 1000 °C’’ in the following text͒ appears broad with a tail
at the longer-wavelength side. Comparing the PL spectra of
as-implanted and 600 °C, 60-min annealed samples in Fig. 1,
it can be seen that the spectrum tails become relatively
weaker with annealing. Through a number of spectrum de-
compositions, it is found that each of these PL spectra is
composed of three bands located at about 470, 550, and 630
PHYSICAL REVIEW B 15 MARCH 1997-IVOLUME 55, NUMBER 11
55
0163-1829/97/55͑11͒/6988͑6͒/$10.00 6988 © 1997 The American Physical Society
nm. Their peak positions change little with the annealing
condition. Naturally, the shape evolution of the PL spectrum
with annealing below 1000 °C is caused just by the relative
variation between the three bands. As shown in Fig. 1, the
intensity of the 550- or 630-nm band is about one-third of
that for the 470 nm one in the PL spectrum of the as-
implanted sample. A higher annealing temperature leads to
weaker 550- and 630-nm bands compared with the 470 nm
one, and the 630-nm band decreases more rapidly with an-
nealing temperature than the 550 nm one. Figure 1 shows us
an example: after annealing at 600 °C for 60 min, the inten-
sity of the 550-nm band is reduced to one-forth of 470-nm
band, and the 630-nm band disappears. When the annealing
temperature is above 1000 °C, the above three bands are
quenched; in the mean time, another PL spectrum appears if
the annealing time is more than 10 min. As shown in Fig. 1,
the PL spectrum for 1100 °C, 60 min annealing is centered at
about 730 nm. However, annealing never changes the peak
position and the shape of the spectrum obtained by annealing
above 1000 °C, so it can be regarded as one band.
By now, we have observed four PL bands, two stronger at
470 and 730 nm and two weaker at 550 and 630 nm, from
silicon-implanted thermal SiO
2
. Now let us observe their
variations in detail. At first, the full width at half maximum
͑FWHM͒ of all four PL bands weakly decrease with increas-
ing annealing temperature and time ͑not shown͒. Figure 2
shows the temperature and time dependencies of the inte-
grated intensity for each band. As can be seen in Fig. 2͑a͒,
the 470-, 550-, and 630-nm bands have a similar annealing
behavior: with increasing temperature, the PL intensity first
increases slowly and then decreases rapidly in an isochronal
annealing. The maxima for 470-, 550-, and 630-nm bands
are at 600, 300, and 200 °C, respectively. Obviously, the
470-nm band is the most stable among these three bands.
However, the 730-nm band monotonously increases with in-
creasing annealing temperature from 1000 °C to 1150 °C.
Figure 2͑b͒ shows that the 470-, 550-, and 630-nm bands
decrease with annealing time at similar rates ͑at 600 or
500 °C͒, but the 730 nm band increases more rapidly with
annealing time ͑at 1100 °C͒. As a matter of fact, this result is
qualitatively true for any effective temperature. Additionally,
although the 730-nm band cannot be detected for shorter
annealing, it is very stable once produced.
The observed PL spectra also vary with the excitation
wavelength. In Fig. 3, one can observe a redshift of the PL
spectrum for 600 °C, 60-min annealed sample with the in-
creasing excitation wavelength. Spectrum decompositions
show that with increasing excitation wavelength, the 470-nm
band decreases, while the 550 nm one increases and then
becomes the sole band under 300-nm excitation. In general,
longer-wavelength excitation brings about a relatively stron-
ger emission of 550- and 630-nm bands compared with the
470 nm one. The 550- and 630-nm bands increase almost at
the same rate. Finally, the PL spectra never shift when the
excitation wavelength is longer than 300 nm. The PL band
for annealing above 1000 °C, exhibits no change in shape
and FWHM with excitation wavelength.
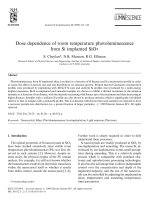
FIG. 1. Typical PL spectra for an as-implanted sample and
samples annealed at 600 °C for 60 min and at 1100 °C for 60 min.
The dashed lines show the decomposed PL bands at about 470, 550,
and 630 nm.
FIG. 2. Dependencies of the PL intensity on ͑a͒ annealing tem-
perature and ͑b͒ annealing time for the four PL bands at 470, 550,
630, and 730 nm. A common annealing time of one hour is chosen
for any band in ͑a͒, but different temperatures are selected in ͑b͒ for
different bands. Note that the scales of intensity and time are loga-
rithmic.
55
6989VISIBLE PHOTOLUMINESCENCE FROM SILICON-ION
To clarify the photoabsorption process of each PL band,
we measured the PLE spectra at various emission positions,
which are shown in Fig. 4. Although annealing can change
the PLE intensity, it cannot change the PLE spectra shapes at
470, 550, and 630 nm. The PLE spectrum monitored at
470-nm emission is a sharp ͑FWHM 20-nm͒ peak around
250 nm. That at 550 nm includes the 250-nm peak together
with a shoulder around 280–290 nm. The 630-nm emission
has a PLE spectrum almost the same as that of 550 nm.
However, the PLE spectrum of the 730-nm band is different
from the other three. As shown in Fig. 4, it has a background
absorption, which decreases with increasing wavelength. On
this background is superimposed a sharp peak at 230 nm and
another weak shoulder. More noticeably, a broad PLE peak
appears at longer wavelengths, and it redshifts with increas-
ing annealing temperature and time. In Fig. 4, we show the
results of two samples annealed for 20 and 240 min at
1100 °C for comparison.
In order to reveal the microstructure evolution which may
be responsible for the observed PL property, we measured
the electron paramagnetic resonance ͑EPR͒ and x-ray photo-
electronic spectra ͑XPS͒. From Fig. 5͑a͒, the as-implanted
sample was found to involve a broad resonance line for the
E
Ј
center defect ͑O
3
wSi• •••
ϩ
SiwO
3
or •SiwO
3
͒.
9,10,19,20
The large width for E
Ј
centers has been ascribed to homo-
geneous broadening by the dipole-dipole interaction.
21
The
asymmetry of this EPR spectrum suggests that it includes
other lines besides the E
Ј
center. Longer annealing time,
especially higher annealing temperature results in the sharper
and weaker EPR spectrum and then makes the spectrum
structure more and more clear. A typical EPR spectrum for
600 °C, 10-min annealing is also shown in Fig. 5͑a͒, from
which we can see the sharpened E
Ј
line together with an-
FIG. 3. Typical PL spectra for 600 °C, 60-min annealing under
different excitation wavelengths and their decomposed bands at 470
and 550 nm which are shown by dashed curves.
FIG. 4. PLE spectra monitored at 470, 550, and 630 nm for any
treatment, and that at 730 nm for annealing at 1100 °C for different
times. The intensity scales for 470-, 550-, and 630-nm emission are
selected arbitrarily since their shapes are independent of annealing,
but both spectra for 730 nm have the same intensity scale.
FIG. 5. ͑a͒ EPR spectra for as-implanted and 600 °C, 10-min
annealed samples; ͑b͒ temperature dependence of the total spin den-
sity for one hour of annealing, and time dependences of the spin
densities of E
Ј
centers and D centers for annealing at 600 °C. Note
that the scales of spin density and time are logarithmic.
6990 55
H. Z. SONG AND X. M. BAO
other low-field resonance, which has been referred to as the
D center „͑•SiwSi
3
͒
n
… .
9
In fact, due to their large width, the
E
Ј
and D center cannot be resolved separately until 400 °C
annealing. We estimated the spin density by comparing the
resonance area with that of a known standard sample. The
total spin density versus temperature is shown in Fig. 5͑b͒.
Different from the temperature dependence of the PL inten-
sity in Fig. 2͑a͒, the spin density just degrades with tempera-
ture, which is not in accordance with the reports by Shimizu-
Iwayama et al.
9
who observed a correlation between E
Ј
defects and a PL intensity for silicon-implanted silica glass.
At temperatures higher than 800 °C, the spin density is be-
low the detection limit of our EPR instrument. In Fig. 5͑b͒,
also shown are spin-density variations of E
Ј
and D centers at
600 °C with annealing time. It is clear that D centers keep
almost constant, but E
Ј
centers remarkably decrease with
increasing time. Another fact that E
Ј
centers degrade more
rapidly than the PL intensity in isothermal annealing supplies
us with more evidence for no exact correlation between the
E
Ј
center and PL in our samples. In fact, D centers also
decrease with increasing temperature, but much slower than
the E
Ј
center. XPS was measured focusing on the implanta-
tion layer. It is found that the samples as-implanted and an-
nealed below 1000 °C show their broadened XPS peak of
silicon 2p core level at positions lower than 103.4 eV, which
is that of stoichiometric SiO
2
. Figure 6 shows us a XPS peak
at 102.3 eV corresponding to 300 °C, 60-min annealing. This
kind of lower energy XPS has been reported for silicon-
riched oxide, SiO
x
͑see Ref. 29, Cooke et al.͒. We noted that
the XPS peak deviation from standard SiO
2
coexists with the
PL for annealing below 1000 °C. With increasing annealing
temperature and time, this peak sharpens and gradually shifts
towards 103.4 eV. When the annealing temperature is at
1000 °C or higher, this peak is located at 103.4 eV and never
shifts, while a different peak at about 99.4 eV appears, as
shown in Fig. 6. This peak corresponds to that for crystal
silicon, and becomes more and more intense with increasing
temperature and time. The above facts imply that, with a
strengthened annealing condition, the as-implanted homoge-
neous SiO
x
network tends to be separated into the following
two phases: SiO
2
and crystal silicon. More important, this
evolution correlates with the appearance of the 730-nm PL
band.
III. DISCUSSION
The original purpose of silicon implantation into SiO
2
is
to form silicon nanostructure buried in oxide matrix, and to
realize strong visible-light emission from quantum confine-
ment of nanocrystal silicon. The detected D centers in our
samples supply evidence for the existence of silicon clusters
scattered in the silicon-implanted thermal SiO
2
layer. For D
centers, the slower decrease with temperature and little varia-
tion with time mean their better stability, especially the pre-
cipitation trend of silicon atoms under thermal treatment.
However, the silicon cluster will not be well crystallized un-
til a critical temperature. The appearance of 99.4-eV XPS
peak for crystal silicon only above 1000 °C implies that crys-
tallized silicon particles, nanosized from many reports,
7–9
will not be numerously produced until annealing above
1000 °C, which is in accordance with the reported results of
transmission electronic microscopy.
7
According to the above discussion about microstructure,
the PL of samples annealed below 1000 °C may not be as-
cribed to nanocrystal silicon, but to the bulk silicon oxide.
As is well known, the visible luminescence centers in SiO
2
are various defects. Almost all intrinsic point defects of SiO
2
can be formed by ion implantation. Therefore, the three PL
bands for samples treated below 1000 °C should be inter-
preted by the defects in the silicon-implanted layer in SiO
2
.
The 470-nm ͑2.7-eV͒ PL has been thoroughly studied in
silica glass
22,23
and ion-implanted SiO
2
layer.
24
Hayes et al.
23
associated this emission with a transient pair of oxygen va-
cancy and oxygen interstitial. This is less reasonable for our
samples because all of them are oxygen deficient. The
250-nm ͑5eV͒PLE peak of the 470-nm PL band is often
observed in SiO
2
and has been proved corresponding to the
photoabsorption of neutral oxygen vacancy defect
͑O
3
wSiϪSiwO
3
͒.
22
Consequently, the 470-nm PL band is
caused by neutral oxygen vacancy, which agrees with the
conclusion by Tohmon et al.
22
and Nishikawa et al.
24
Al-
though the PLE of 550- and 630-nm band includes the
250-nm peak, their difference from that of 470-nm band is
apparent. They should be associated with other defects. As
we know, any bulk point defect in SiO
2
has not been ob-
served to be related to a PL band around 550 nm. With
silicon implantation in a large quantity into SiO
2
, Mutti
et al.
10
observed stable PL at 540 nm after 1000 °C anneal-
ing, and they think it resulted from quantum confinement
effect. Nonetheless, this band is often observed without ther-
mal treatment at high temperature. The 550-nm band must be
assigned as due to some defect in SiO
2
, with the microstruc-
ture presently unsettled. As referred to the 630-nm PL band,
Shimizu-Iwayama et al.
9
ascribed it to the E
Ј
defect accord-
ing to their observed identical dependencies on temperature
for their silica samples. In our results there is not such an
exact correlation, so we do not think of the E
Ј
center defect
as the just origin of 630-nm PL for silicon-implanted thermal
SiO
2
.InSiO
2
, another radiative defect is the nonbridging
oxygen hole center ͑NBOHC͒, whose luminescence re-
sembles our observed 630-nm PL band.
25,26
As a local oxy-
FIG. 6. Two typical XPS spectra for a Si 2p core level after
annealing at 300 °C for 60 min and at 1100 °C for 60 min.
55
6991VISIBLE PHOTOLUMINESCENCE FROM SILICON-ION
gen excess center, the NBOHC must be unstable and very
low in density in our oxygen-deficient material. As a result,
the 630-nm PL is the weakest and the most unstable among
the three bands for annealing below 1000 °C. It is plausible
for us to regard the NBOHC as the very origin of the 630-nm
luminescence band.
What is the role of the E
Ј
center defect, which is the main
EPR signal in the implantation layer? It is necessary to take
account of the nonradiative recombination ͑NRR͒ effect in
our samples. Since the E
Ј
center is a hole trap and defect
degrading the electronic properties of thin-film SiO
2
,
24
we
may regard it as a NRR center. Then, its decrease brings
about an increase in PL intensity.
17
Nevertheless, the radia-
tive center such as the neutral oxygen vacancy, as a defect
produced by implantation, also decreases with increasing an-
nealing time and temperature. That is the very reason for the
observed PL degradation by isothermal annealing. From the
chemical stability, it may be certain that the bonded neutral
oxygen vacancy is more stable than the E
Ј
center with a
dangling bond. Provided that the radiative centers are re-
duced more slowly than the NRR centers, the temperature
dependencies of PL intensity for the three bands at 470, 550,
and 630 nm can be easily explained. With increasing tem-
perature, the decrease of the NRR probability first predomi-
nates in PL variation, so all the three bands become stronger
and stronger. When the NRR centers are greatly quenched,
the decrease of radiative centers will be more prevalent,
which inevitably weakens the PL.
The distinct behavior of the 730-nm PL band from the
other three suggests its special luminescence mechanism.
Experiments indicate that the appearance of 730-nm band is
correlated with the crystallization of nanosized silicon and
the disappearance of defects. It is certain that the mean size
of nanocrystal silicon particles, will increase with annealing
time at a high temperature.
7
However, the little dependence
of the peak position of the 730-nm band on the annealing
condition conflicts with an explanation by quantum confine-
ment of nanocrystal silicon. Thus, it can only originate from
the interface between nanocrystal silicon and disordered
SiO
2
.
7–9
In detail, it is some localized luminescence center at
the interface that is responsible for 730-nm emission. Stron-
ger treatment means a larger interface area, including nano-
crystal silicon increase in size and number. As a result, the
730-nm PL intensity rises with increasing annealing tem-
perature and time. In the PLE spectrum, the characteristic
absorption band at 230 nm cannot be ascribed to point defect
because of the diminished defect density. It is most probably
also from the interface between nanocrystal silicon and SiO
2
.
More important, the shifting PLE band in the longer wave-
length range can be reasonably referred to as the optical-
absorption transition inside nanocrystal silicon. Its redshift
results from the decreased band gap. The absorption inside
nanocrystal silicon together with the emission process at the
interface has been described in the luminescence mechanism
of porous silicon suggested by Koch et al.
27
and Qin and
Jia
28
which have been supported by more and more experi-
mental results.
29
After annealed at temperatures higher than
1000 °C, silicon-implanted SiO
2
film is much like porous
silicon in structure, i.e., nanocrystal silicon surrounded by an
amorphous matrix, so it is comprehensive for them to have
the same photoluminescence mechanism. On the other hand,
the interfacial luminescence center emitting 730-nm light has
never been found for the interface between bulk silicon and
the SiO
2
layer, but often observed in oxidized porous
silicon.
29
It may be a certain local state which is produced
only at the interface between nanocrystal silicon and amor-
phous silicon oxide.
The PL so far observed from silicon-implanted thermal
SiO
2
has covered the whole visible range. This is helpful and
valuable to application research. Due to the lack of an inten-
sity balance between different luminescence bands, however,
it is urgent to thoroughly improve the luminescence effi-
ciency. The photoabsorption of nanocrystal silicon provides
an available path to strengthen the PL. That is to construct
nanocrystal silicon particles small enough together with the
numerous presence of the luminescence centers. Another
topic for further study is to separate those coexisting defects
produced by ion implantation to obtain single band emission.
In summary, we systematically investigated the PL of
silicon-implanted thermal SiO
2
film. The PL of samples an-
nealed below 1000 °C ͑including as-implanted͒ and above
1000 °C were discovered to have different behaviors. The
former is composed of three PL bands at 470, 550, and 630
nm, which show an intensity maxima at 600, 300, and
200 °C, respectively, in isochronal annealing and decrease at
similar rates with time in isothermal annealing. The latter, a
band at 730 nm, always rises with increasing annealing tem-
perature and time in our measurement range. Among these
four PL bands, 470 and 730 nm are strong and stable, while
550 and 630 nm are weak and unstable. Microstructure
analysis and excitation research indicate that the 470-, 550-,
and 630-nm bands originate from different defects in the
silicon-implanted SiO
2
layer, while the 730-nm band results
from luminescence centers at the interface between nanoc-
rystal silicon and silicon oxide matrix.
ACKNOWLEDGMENT
This work was supported by National Science Foundation
of China and Ion Beam Laboratory, Shanghai Institute of
Metallurgy, Chinese Academy of Science.
1
For example, L. T. Canham, Appl. Phys. Lett. 57, 1046 ͑1990͒.
2
T. Kawaguchi and S. Miyamiza, Jpn. J. Appl. Phys. 32, L215
͑1993͒.
3
D. Zhang, R. M. Kolbas, P. D. Milewski, D. J. Lichtenwalner,
A. I. Kingon, and J. M. Zavada, Appl. Phys. Lett. 65, 2684
͑1994͒.
4
P. D. Milewski, D. J. Lichtenwalner, P. Mehta, A. I. Kingon, D.
Zhang, and R. M. Kolbas, J. Electron. Mater. 23,57͑1994͒.
5
S. Tong, X. N. Liu, and X. M. Bao, Appl. Phys. Lett. 66, 469
͑1995͒.
6
T. Shimizu-Iwayama, M. Ohshima, T. Niimi, S. Nakao, K. Sai-
toh, T. Fujita, and N. Itoh, J. Phys. Condens. Matter 5, L375
͑1993͒.
7
T. Shimizu-Iwayama, S. Nakao, K. Saitoh, and N. Itoh, J. Phys.
6992 55
H. Z. SONG AND X. M. BAO
Condens. Matter 6, L601 ͑1994͒.
8
T. Shimizu-Iwayama, S. Nakao, and K. Saitoh, Appl. Phys. Lett.
65, 1814 ͑1994͒.
9
T. Shimizu-Iwayama, K. Fujita, S. Nakao, K. Saitoh, T. Fujita,
and N. Itoh, J. Appl. Phys. 75, 7779 ͑1994͒.
10
P. Mutti, G. Ghisloti, S. Bertoni, L. Bonoldi, G. F. Cerofolni, L.
Meda, E. Grilli, and M. Guzzi, Appl. Phys. Lett. 66, 851 ͑1995͒.
11
T. Komoda, J. Kelly, F. Cristiano, A. Nejim, P. L. F. Hemment,
K. P. Homewood, R. Gwilliam, J. E. Mynard, and B. J. Sealy,
Nucl. Instrum. Methods Phys. Res. Sect. B 96, 387 ͑1995͒.
12
S. H. Risbud, L C. Liu, and J. F. Shackelford, Appl. Phys. Lett.
63, 1648 ͑1993͒.
13
X. Zhao, O. Schoenfeld, J. Kusano, Y. Aoyagi, and T. Sugano,
Jpn. J. Appl. Phys. 33, L649 ͑1994͒.
14
Q. Zhang, S. C. Bayliss, and R. A. Hutt, Appl. Phys. Lett. 66,
1977 ͑1995͒.
15
A. G. Nassiopoulos, S. Grigoropoulos, E. Gogolides, and D. Pa-
padimitriou, Appl. Phys. Lett. 66, 1114 ͑1995͒.
16
H. M. Cheong, W. Paul, S. P. Withrow, J. G. Zhu, J. D. Budai, C.
W. White, and D. M. Hembree, Appl. Phys. Lett. 68,87͑1996͒.
17
L. S. Liao, X. M. Bao, X. Q. Zheng, N. S. Li, and N. B. Min,
Appl. Phys. Lett. 68, 850 ͑1996͒.
18
L. S. Liao, X. M. Bao, N. S. Li, X. Q. Zheng, and N. B. Min, J.
Lumin. 68, 199 ͑1996͒.
19
H. Hosono, J. Appl. Phys. 69, 8079 ͑1991͒.
20
E. H. Poindexter and P. J. Caplan, J. Vac. Sci. Technol. A 6, 1352
͑1988͒.
21
T. Fujita, M. Fukui, S. Okada, T. Shimizu, and N. Itoh, Jpn. J.
Appl. Phys. 28, L1254 ͑1989͒.
22
R. Tohmon, Y. Shimogaichi, H. Mizuno, Y. Ohki, K. Nagasawa,
and Y. Hama, Phys. Rev. Lett. 62, 1388 ͑1989͒.
23
W. Hayes, M. J. Kane, O. Salminen, R. L. Wood, and S. P.
Doherty, J. Phys. C 17, 2943 ͑1984͒.
24
H. Nishikawa, E. Watanabe, D. Ito, M. Takiyama, A. Leki, and
Y. Ohki, J. Appl. Phys. 78, 842 ͑1995͒.
25
L. Skuja, Solid State Commun. 84, 613 ͑1992͒.
26
L. N. Skuja, A. N. Streletskey, and A. B. Pakovich, Solid State
Commun. 50, 1069 ͑1984͒.
27
F. Koch, V. Petrova-Koch, T. Maschik, A. Nikolov, and V.
Gavrilenko, in Microcrystalline Semiconductors: Materials Sci-
ence & Devices, edited by P. M. Fauchet, C. C. Tsai, L. T.
Canham, I. Shimizu, and Y. Aoyagi, MRS Symposia Proceed-
ings No. 283 ͑Materials Research Society, Pittsburgh, 1993͒,p.
197.
28
G. G. Qin and Y. Q. Jia, Solid State Commun. 86, 559 ͑1993͒.
29
For example, L. Tsybeskov and P. M. Fauchet, Appl. Phys. Lett.
64, 1983 ͑1994͒; G. G. Qin, H. Z. Song, B. R. Zhang, J. Lin, J.
Q. Duan, and G. Q. Yao, Phys. Rev. B 54, 2548 ͑1996͒;D.W.
Cooke, B. L. Bennett, E. H. Farnum, W. L. Hults, K. E. Sick-
afus, J. F. Smith, J. L. Smith, T. N. Taylor, P. Tiwari, and A. M.
Portis, Appl. Phys. Lett. 68, 1663 ͑1996͒.
55
6993VISIBLE PHOTOLUMINESCENCE FROM SILICON-ION