- Trang chủ >>
- Khoa Học Tự Nhiên >>
- Vật lý
Diffusion controlled growth of semiconductor nanowires vapor pressure versus high vacuum deposition
Bạn đang xem bản rút gọn của tài liệu. Xem và tải ngay bản đầy đủ của tài liệu tại đây (203.85 KB, 7 trang )
Diffusion-controlled growth of semiconductor nanowires:
Vapor pressure versus high vacuum deposition
V.G. Dubrovskii
a,b,
*
, N.V. Sibirev
c
, R.A. Suris
a,b
, G.E. Cirlin
a,b,c
,
J.C. Harmand
d
, V.M. Ustinov
a,b
a
St. Petersburg Physical Technical Centre of the Russian Academy of Sciences for Research and Education, Khlopina 8/3, 195220 St. Petersburg, Russia
b
Ioffe Physical Technical Institute of the Russian Academy of Sciences, Politekhnicheskaya 26, 194021 St. Petersburg, Russia
c
Institute for Analytical Instrumentation of the Russian Academy of Sciences, Rizhsky 26, 190103 St. Petersburg, Russia
d
CNRS-LPN, Route de Nozay, 91460 Marcoussis, France
Available online 20 April 2007
Abstract
Theoretical model of nanowire formation is presented, that accounts for the adatom diffusion from the sidewalls and from the sub-
strate surface to the wire top. Exact solution for the adatom diffusion flux from the surface to the wires is analyzed in different growth
regimes. It is shown theoretically that, within the range of growth conditions, the growth rate depends on wire radius R approximately as
1/R
2
, which is principally different from the conventional 1/R performance. The effect is verified experimentally for the MBE grown
GaAs and AlGaAs wires. The dependences of wire length on the drop density, surface temperature and deposition flux during vapor
pressure deposition and high vacuum deposition are analyzed and the differences between these two growth techniques are discussed.
Ó 2007 Elsevier B.V. All rights reserved.
Keywords: Nanowires; Kinetic growth model
1. Introduction
Semiconductor nanowires perpendicular to a substrate
have recently attracted an increasingly growing interest
as nanostructured materials with applicability to nano-
electronics [1,2], nanooptics [3,4] and nanosensors [5]. Sil-
icon wires with micrometer diameters were first fabricated
more than 40 years ago [6]. These wires were grown by the
so-called vapor–liquid–solid mechanism [6,7] from vapors
SiCl
4
and H
2
on the Si(1 11) surface activated by Au
drops at surface temperature T of about 1000 °C. Modern
epitaxial techniques enable to fabricate Si [8–10], III–V
and II–VI [11–18] semiconductor wires by the same mech-
anism but with diameters reduced typically to 10–100 nm.
Different growth technologies of nanowire formation can
be divided in two groups. In the first group, material is
deposited onto a substrate from a vapor phase [1–8], for
example in chemical vapor deposition (CVD). In the sec-
ond group, material is delivered from a particle beam un-
der high vacuum conditions [10,14–18], form example in
molecular beam epitaxy (MBE). We shall call these
groups, for briefness, as vapor phase deposition (VPD)
and high vacuum deposition (HVD). Studying the forma-
tion mechanisms of nanowires is important from the view-
point of fundamental physics of growth processes as well
as for fabrication of controllably structures nanowires for
various device applications. These investigations require
the development of relevant theoret ical models. Also,
there have been relatively few systematic studies of the
dependence of nanowire morphology on the growth con-
ditions. Among these, we would like to mention recent re-
sults on the length–radius dependences of MBE grown Si
[10] and GaAs [14,16] wires, CVD grown wires of different
0039-6028/$ - see front matter Ó 2007 Elsevier B.V. All rights reserved.
doi:10.1016/j.susc.2007.04.122
*
Corresponding author. Address: Ioffe Physical Technical Institute of
the Russian Academy of Sciences, Politekhnicheskaya 26, 194021 St.
Petersburg, Russia. Tel.: +7 812 448 6982; fax: +7 812 297 3178.
E-mail address: ffe.ru (V.G. Dubrovskii).
www.elsevier.com/locate/susc
Surface Science 601 (2007) 4395–4401
III–V compounds [13], and GaAs wires grown by magne-
tron sputtering depositon (MSD) [17].
The well known Givargizov–Chernov model of wire for-
mation [19] accounts for the Gibbs–Thomson effect of ele-
vation of chemical potential in the cylindrical wire of
radius R. Their formula for the wire growth rate dL/dt
was found to provide a good fit with experimental
length–radius curves of Si wires grown by VPD on the
Si(1 11) surface activated by Au at T $ 1000 °C for radii
in the micrometer range [19,20]. Kashchiev [21] recently ap-
plied the formula for the growth rate of crystal face of finite
radius R [22] for the description of nanowire formation.
This model does not consider the Gibbs–Thomson effect,
but accounts for the transition from mononuclear to poly-
nuclear mode of nucleation at the wire top as the radius of
wire increases. Some of the authors of this paper developed
a more detailed model of wire growth [23] that handles the
both effects simultaneously. All models described predict
an increasing dependence of wire length on R and correlate
with some MBE experiments for comparatively short and
thick GaAs wires [21,23].
However, many experimental results on L(R ) depen-
dence in modern VPD and HVD techniques demonstrate
that Si wires at T = 525 °C [10] and different III–V wires
at T = 550–600 °C [13,14,17] exhibit the decreasing L(R)
dependencies in the range of diameters typically from 40
to 200 nm. Experimental curves are usually described by
the formula dL/dt = A + BR
*
/R, where A and B are cer-
tain R-independent parameters and R
*
is the characteristic
diffusion radius. The 1/R behavior is typical when the wire
growth is controlled by the adatom diffusion from the
substrate surface [14,17] and/or the wi re sidewalls [13].
Adatom diffusion flux supplies semiconductor material
to the drop and provides supersaturation sufficient to
drive the nucleation. When wire length exceeds the ada-
tom diffusion length on the sidewalls, the supplying flux
decreases, the alloy concentration in the drop and the
drop radius itself diminishes, that leads to wire tapering
[15]. Generalized kinetic approach of Ref. [24] is capable
of semi-quantitative description of such growth behavior.
It is now well understood that the size-dependent Gibbs–
Thomson effect [19] and the decrease of nucleation-medi-
ated growth rate on a small face [21,23] are important
when the growth is controlled by the direct impingement
of material to the drop. It normally happens at high sur-
face temperatures and, consequently, small diffusion
lengths of adatoms. When the growth temperature is low-
ered, the diffusion lengths increase and the wire growth is
controlled primarily by the adatom diffusion. Since the
impingement flux is proportional to drop surface area
(R
2
), and diffusion flux from the sidewalls is proportional
to wire perimeter (R), the rate of particle sink at the li-
quid–solid interface will be R
2
dL/dt = AR
2
+ BR
*
R.
Dividing this over R
2
, one ends up with the equation of
wire growth predicted theoretically in earlier works, for
example, by Dittmar and Neumann [25], Ruth and Hirth
[26] and Blakely and Jackson [27].
While in a given growth experiment the wire lengths and
diameters are anyway dictated by the size distribution of
catalyst drops f(R), it is important to consider the effect
of growth conditions on the morphology of wires grown
at fixed f(R) but at different temperatures T and fluxes V.
Some data and on the L(T) and L(V) dependencies of
MBE grown Ga(Al)As nanowires have been recently ob-
tained and modeled in Refs. [24,18]. This paper continues
the study of diffusion-controlled nanowire growth, with a
closer look at the kinetic processes on a substrate surface.
First of all, we will show that the 1/R dependence of the
wire length is not the general case, because R
*
depends
on R via the ratio R/k
s
, where k
s
is the effective diffusion
length on the substrate surface. Under typical conditions
during HVD this leads to two main growth modes, one
with conventional 1/R and another with 1/R
2
behavior of
wire length. We will present the data on the MBE grown
GaAs and AlGaAs nanowires exhibiting such 1/R
2
length
dependence. Secondarily, we will construct a self-consistent
route to estimate the value of k
s
. Finally, we will consider
the dependence of wire length on temperature T, flux V,
drop density N
W
and drop size distribution f(R) in VPD
and HVD growth techniques and discuss the differences be-
tween them.
2. Theoretical model
Thermodynamic driving force for the wire growth is
the supersaturation of gaseous phase, defined as
U ¼
V s
l
2r
l
X
s
C
eq
À 1, where V is the impinging flux, s
l
is the
mean lifetime of semiconductor particles in the drop before
re-evaporation, r
l
is the inter-atomic distance in the liquid,
X
s
is the volume per atom in the crystal and C
eq
(T) is the
equilibrium concentration of alloy. As shown in Ref. [24],
if U is much higher than the alloy supersaturation f, the
wire growth is mainly controlled by the transport of semi-
conductor particles to the drop. Our growth model, de-
scribed in more detail in Ref. [28], takes into account (i)
the direct impingement at rate V; (ii) the desorption from
the drop; (iii) the diffusion flux of adatoms to the drop
and (iv) the growth of non-activated surface at rate V
s
.
The wire growth rate in the steady state is given by [28]
dL
dH
¼ e Àc þ
R
Ã
R
ð1Þ
Here, H = Vt is the deposition thickness, the R-indepen-
dent term accounts for the direct impingement on the drop
surface, desorption from the drop (c = 1/(U + 1)) and the
growth of non-activated surface (e =1À V
s
/V). The diffu-
sion-induced contribution is described by the characteristic
radius R
*
. The exact solution of system of diffusion equa-
tions at the substrate surface and at the wire sidewal ls pro-
vides the expression for R
*
in the form [28]
R
Ã
¼
2k
s
b þ2k
f
sin a½coshðL=k
f
ÞÀ1 þbG sinhðL=k
f
Þ
bG coshðL=k
f
ÞþsinhðL=k
f
Þ
ð2Þ
4396 V.G. Dubrovskii et al. / Surface Science 601 (2007) 4395–4401
Here, k
f
¼
ffiffiffiffiffiffiffiffiffi
D
f
s
f
p
ffi
ffiffiffiffiffi
r
f
p
exp½ðE
f
A
À E
f
D
Þ=2 k
B
T is the
adatom diffusion length on the sidewalls (limited by
desorption), E
f
A
and E
f
D
are the activation energies for the
adatom desorption and diffusion on the sidewalls,
k
s
¼
ffiffiffiffiffiffiffiffiffi
D
s
s
s
p
is the effective adatom diffusion length on
the substrate surface (normally limited by nucleation
or by outgoing flux to wire sidewalls) and
b ¼ðr
s
k
s
D
f
=r
f
k
f
D
s
Þffi
ffiffiffiffiffiffiffiffiffiffiffiffiffiffiffiffiffiffiffiffi
D
f
s
s
=D
s
s
f
p
. Here and below r
f
and r
s
denote the areas of adsorption site on the wire side-
walls (f) and on the substrate surface (s). The effective inci-
dent angle of impinging flux to the wire a is used to treat
simultaneously the cases of VPD and HVD. In VPD tech-
niques sina = 1, because the vapors surround the drop and
the wire. In HVD techniques with particle beam perpendic-
ular to the surface one can assume that sina % 0, so that
particles impinge only the substrate surface. The function
G is given by
G ¼
I
1
ðR
W
=k
s
ÞK
0
ðR=k
s
ÞþK
1
ðR
W
=k
s
ÞI
0
ðR=k
s
Þ
I
1
ðR
W
=k
s
ÞK
1
ðR=k
s
ÞÀK
1
ðR
W
=k
s
ÞI
1
ðR=k
s
Þ
ð3Þ
where I
n
and K
n
are the modified Bessel functions in stan-
dard notations, and R
W
¼ 1=
ffiffiffiffiffiffiffiffiffiffi
pN
W
p
is the average half-dis-
tance between the wires. At R
*
= const Eq. (1) is
immediately reduced to the simplest growth equation dis-
cussed in the Introduction. While deriving Eqs. (1)–(3) it
has been assumed that the wire is the cylinder of a fixed ra-
dius R. The same model can be also applied to the case of
wire in the form of a regular prism or hexagon, in the latter
case R is the radius of a circle inscribed to this prism or the
hexagon. However, it is important to point out that the
solutions given by Eqs. (1)–(3) apply only when the wire
shape is independent on the polar angle in the substrate
plane. If it is not the case, one has to consider the X and
Y dependence of the diffusion flux to the wire base and
the solutions become more complex. Also, there is a lower
bound for radius R, below which the wire growth can not
be described by the diffusion Eqs. (1)–(3). Namely, R
should be larger than the Givargizov–Chernov minimum
radius R
min
[20,23,24].AtR $ R
min
, the Gibbs–Thomson
effect considerably lowers the growth rate of very thin wires
and should be taken into consideration. Using the esti-
mates of Ref. [24], the value of R
min
decreases at higher
supersaturations U and is smaller than 10 nm during the
MBE growth of GaAs wires at typical growth conditions
of T $ 500–600 °C and V $ 1 ML/s, so that the diffusion
growth model must be valid at least for the wires with
R > 20 nm.
To this end, diffusion length k
s
and quantity e =1À V
s
/V
serve as two external parameters of the model. Let us now
show how these two parameters can be determined self-con-
sistently. First of all, we introduce the probabilities
e
1
= X
s
J
diff
/V of adatom migration to the wire sidewall (here
J
diff
denotes the overall diffusion flux to the wire bases per
unit surface area), e
2
= V
s
/V of adatom incorporation to
the growing surface layer and e
3
= V
des
/V to re-evaporate
from the surface. Due to the mass conservation e
1
+ e
2
+
e
3
= 1 and e =1À e
2
= e
1
+ e
3
by definition. Probability e
1
must be proportional to the overall diffusion flux J
diff
, which
equals the sum of individual fluxes j
diff
(0) to differently sized
wires:
e
1
V
X
s
¼ N
W
hj
diff
ð0Þi ð4Þ
Here and below hgi denotes the average with normalized
size distribution of drops f ðRÞ ; hgi¼
R
1
0
dRf ðRÞgðRÞ: Indi-
vidual diffusion flux to the wire base can be found from the
solution for surface concentration of adatoms n
s
(r) [28] as
j
diff
(0) = D
s
2pR dn
s
/drj
r = R
in the form
j
diff
ð0Þ¼pR
V
X
s
½R
Ã
coshðL=k
f
ÞÀ2k
f
sin a sinhðL=k
f
Þ ð5Þ
Inserting this into Eq. (4), upon averaging we get
e
1
pN
W
hRi
¼
hR
Ã
Ri
hRi
coshðL=k
f
ÞÀ2k
f
sin a sinh ðL=k
f
Þð6Þ
Since R
*
is the known function of k
s
, Eq. (6) allows one to
find k
s
as function of e
1
, of the parameters of drop size dis-
tribution and of the growth conditions T and V.IfR
*
can
be treated as R-independent, Eq. (6) determines R
*
explic-
itly and Eq. (1) is reduced to the formula of Ref. [29]
dL
dH
¼ e Àc
þ
1
R
e
1
phRiN
W
coshðL=k
f
Þ
þ 2k
f
sin a tanhð L= k
f
Þ
ð7Þ
If k
s
is considerably smaller than the radii of wires and
of two-dimensional islands on the surface, we can assum e
that probability e
1
is proportional to the total perimeter
of wires per unit surface area P
W
=2pN
W
hRi and also that
probability e
2
is proportional to the appropriately averaged
perimeter of islands P
I
. As shown, for example, in Ref. [30],
the time dependence of layer perimeter can be approxi-
mated as P
I
ðsÞ¼p
ffiffiffiffiffiffiffiffi
N
I
s
p
e
Às
. Here, N
I
is the surface density
of islands emerging in each layer and s is a certain relative
time. Averaging this in s, we arrive at
P
I
ffi p
ffiffiffiffiffiffi
N
I
p
Z
1
0
dxx
1=2
e
Àx
¼
p
3=2
2
ffiffiffiffiffiffi
N
I
p
ð8Þ
The surface density of islands N
I
during the layer-by-layer
growth can be calculated by applying the nucleation theory
[22,30]. For us it is important that N
I
depends on temper-
ature T and deposition flux V approximately as
N
I
/ V
2
exp
3K
s
þ 2E
s
D
k
B
T
ð9Þ
where K
s
is the specific condensation heat of two-dimen-
sional ‘‘vapor’’ of adatoms and E
s
D
is the activation energy
for adatom diffusion. Finally, the probability of desorpt ion
e
3
is proportional to the reverse diffusion length of single
adatom on a bare substrate 1/k
0
s
. Temperature dependence
of k
0
s
is given by the conventional exponential expression
k
0
s
ffi
ffiffiffiffiffi
r
s
p
exp½ðE
s
A
À E
s
D
Þ=2k
B
T , where E
s
A
is the activati on
V.G. Dubrovskii et al. / Surface Science 601 (2007) 4395–4401 4397
energy for desorption. The expressions for e and e
1
follow-
ing from the above analysis read
e ¼
1 þ P
W
k
0
s
1 þðP
W
þ P
I
Þk
0
s
; e
1
¼
P
W
k
0
s
1 þðP
W
þ P
I
Þk
0
s
; k
s
( R
ð10Þ
In the opposite case, when k
s
is much larger than the
radii of wires and islands, but smaller than the average dis-
tance between them, the probability e
1
will be proportional
to surface density of wires N
W
, the probability e
2
will be
proportional to density of islands N
I
and the probability
e
3
will be proportional to ð2pk
0
s
Þ
À2
. Repeating the consider-
ations described above, the expressions for e and e
1
in this
case will be
e ¼
1 þ 2pN
W
ðk
0
s
Þ
2
1 þ 2pðN
W
þ N
I
Þðk
0
s
Þ
2
;
e
1
¼
2pN
W
ðk
0
s
Þ
2
1 þ 2pðN
W
þ N
I
Þðk
0
s
Þ
2
; R ( k
s
( R
W
ð11Þ
3. Results and discu ssion
Let us now see how the above model describes the most
important limit regimes of nanowire growth. In the case of
VPD (sin a = 1) under the assumption L/k
f
) 1 the wire
growth is determined entirely by the adatoms adsorbed
on the sidewalls and Eqs. (1)–(3) are reduced to the well
known expression [13,20]
L ¼ e À c þ
2k
f
R
H ð12Þ
In the case of HVD the adsorption on the sidewalls is
small (sina % 0) and the wire growth is mainly controlled
by the adatoms arriving from the substrate surface [14].
For numerical estimates, consider typical conditions of
MBE growth of GaAs nanowires on the GaAs(1 11)B-sur-
face activated by Au drops: N
W
$ 10
9
cm
À2
, hRi =40nm
and T = 580 À 590 °C [14,15]. Different estimates for the
diffusion length of Ga atoms on the GaAs(110) sidewalls
at this temperature range from 3 [15] to 10 [31] lm. For
wires with L <3lm we can therefore use a simplified equa-
tion R
*
=2k
s
/G at L/k
f
( 1 instead of general equation (2),
and even for longer wires with L up to 10 lm it could still be
a reasonable approximation. Further, the distance between
wires R
W
approximately equals 180 nm, and for the value of
k
s
of several tens of nanometers (verified experimentally be-
low in this paper) we can use the asymptote of Eq. (3) at
R
W
/k
s
) 1. In this case Eqs. (2), (3) are simplified to
R
Ã
¼ 2k
s
K
1
ðR=k
s
Þ
K
0
ðR=k
s
Þ
!
2k
s
; k
s
( R
2k
2
s
R lnðk
s
=RÞ
; k
s
) R
(
ð13Þ
where we write explicitly two limit cases of wire growth.
When the effecti ve diffusion length on the surface is much
smaller than the wire radius, R
*
is R-independent and the
wire length depends on R as 1/R (1/R-diffusion). In the
opposite case, when the diffusion length is much larger than
the wire radius, R
*
is reverse proportional to R with a weak
logarithmic correction, and the wire length depends on R
approximately as 1/R
2
(1/R
2
-diffusion). Numerical analysis
shows that the function in the right hand side of Eq. (13)
can be approximated with reasonable accuracy by k
2
s
=R
2
for the values of R $ k
s
, if we put ln (k
s
/R) % 1. Now we
note that the cases of R
*
= const and R
*
/ 1/R correspond
to a trivial averaging in self-consistent Eq. (6). Thus, Eq.
(13) together with Eqs. (6) and (10), (11) gives the following
results for the wire lengths and effective diffusion lengths in
the cases of 1/R- and 1/R
2
-diffusion
L ¼ e À c þ
2k
s
R
H; k
s
( R ð14Þ
k
s
¼
k
0
s
1 þðP
W
þ P
I
Þk
0
s
ffi
1
P
W
þ P
I
; k
s
( R ð15Þ
L ffi e À c þ
2k
2
s
R
2
H; k
s
) R ð16Þ
k
s
¼
k
0
s
ffiffiffiffiffiffiffiffiffiffiffiffiffiffiffiffiffiffiffiffiffiffiffiffiffiffiffiffiffiffiffiffiffiffiffiffiffiffiffiffiffiffiffiffiffi
1 þ 2 pðN
W
þ N
I
Þðk
0
s
Þ
2
q
ffi
1
ffiffiffiffiffiffiffiffiffiffiffiffiffiffiffiffiffiffiffiffiffiffiffiffiffiffiffi
2pðN
W
þ N
I
Þ
p
; k
s
) R
ð17Þ
Approximate expressions in Eqs. (15) and (17) apply at a
low desorption from the surface. For example, when GaAs
wires a re grown on the GaAs(1 11)B surface, the diffusion
length of Ga atoms k
0
s
approximately equals 6 lm at 590 °C
[32].AtN
W
=10
9
cm
À2
and hRi = 50 nm this corresponds
to P
W
k
0
s
% 19 and N
W
½k
0
s
2
% 360. In this case the expres-
sions for e and e
1
become
e ¼ e
1
¼
P
W
P
W
þ P
I
; k
s
( R ð18Þ
e ¼ e
1
¼
N
W
N
W
þ N
I
; k
s
) R ð19Þ
Presented formulas give the possibility to derive some
information concerning the nanowire growth mechanisms
from the experimental L(R) curves. Namely, by fitting
these curves by Eq. (12) in VPD or one of Eqs. (14) or
(16) in HVD, we find the values of k
f
or k
s
and e À c.By
measuring the average thickness of epitaxial layer on the
substrate surface H
s
, we calculate e and obtain the desorp-
tion coefficient c = 1/(U + 1), and, hence, the supersatura-
tion of gaseous phase U. In absence of desorption from
the substrate, even without measuring H
s
, at known N
W
and hRi we are able to deduce P
I
or N
I
from Eq. (15) or
(17), then calculate e by means of Eq. (18) or (19) and
get the values of c and U from measured e À c.
As mentioned already, the 1/R diffusion law has been ver-
ified experimentally for the Si/Si(1 1 1)–Au nanowires grown
by MBE at T = 525 °C [10], the GaAs/GaAs(1 1 1)B–Au
nanowires at grown by MBE at T = 550–600 °C [13,14,16],
and also for the GaAs/GaAs(1 11)B–Au nanowires grown
by MSD at T = 585 °C [17]. Below we present experimental
data on the Al
0.33
Ga
0.67
As/GaAs(1 11)B–Au and the GaAs/
4398 V.G. Dubrovskii et al. / Surface Science 601 (2007) 4395–4401
GaAs(1 11)B–Au nanowires exhibiting the 1/R
2
behavior of
L(R) dependences. The Al
0.33
Ga
0.67
As wires were grown by
MBE at surface temperature T = 585 °C and deposition
thickness of AlGaAs H = 725 nm. Experimental details
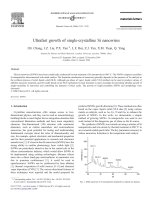
can be found in Ref. [33]. The GaAs wires were grown by
MBE at T = 560 °C and H = 1000 nm. Experimental details
can be found in Ref. [28]. The values of wire density N
W
for
the both ensembles of wires are given in Table 1. From the
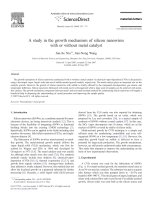
analysis of scanning electron microscopy images of these
wires [28,33], we worked out experimental length–diameter
curves shown by points in Figs. 1 and 2. Solid line in Fig. 1
is the best fit of theoretical length–diameter curve given by
simplified equation (16). Also for comparison, the dashed
line corresponds to the best fit of general equation (12) at
sina = 0 in the 1/R diffusion mode, modeled in Ref. [33].It
is seen that the 1/R
2
curve provides considerably better fit
to the experimental results. Numeric values of growth char-
acteristics, obtained from fitting the experimental L(R)
curves as described above, are summarized in Table 1. Solid
line in Fig. 2 corresponds to the best fit obtained from sim-
plified equation (16) and dashed line relates to R
*
given by
general equations (1)–(3) at sina = 0. Theoretical values of
parameters for GaAs are also presented in Table 1.
Analysis of data presented in Table 1 shows that wires
consume abou t 32% of all adatom s in the case of AlGaAs
and about 15% in the case of GaAs. The effective diffusion
length on the substrate surface is 1.23 times higher for Al-
GaAs because of lower surface density of islands, although
diffusivity of Al atoms itself is much lower than that of Ga.
Since the minimum radius of drop R
min
is 20 nm for Al-
GaAs and 31 nm for GaAs wires, the maximum ratio of
wire length to the deposition thickness (L/H)
max
is 7.3
times for AlGaAs and only 3.2 times for GaAs. We also
note that the above estimations provide reasonabl e values
for surface density of islands in the regime of complete con-
densation $10
9
–10
10
cm
À2
[30].
Let us now consider the drop density, temperature and
flux behavior of nanowire length during VPD and HVD.
Assume, for semi-quantitative analysis, that the R-indepen-
dent term in Eq. (6) is negligible (e À c ( R
*
/R). In the case
of VPD at sufficiently high temperatures, when L/k
f
) 1
and the wires grow due to the adatoms directly impinging
their sidewalls, Eq. (12) gives the temperature dependence
of wire length in the form
L / k
f
¼ k
0
f
exp G
f
T
0
T
À 1
ð20Þ
Here, the quantity G
f
¼ðE
f
A
À E
f
D
Þ=2k
B
T
0
is determined
entirely by the adatom characteristics on the sidewalls.
Therefore, we can ignore completely the processes on the
substrate surface [13]. The length of wires is density and
flux independent and decreases at higher T, because the dif-
fusion length on the sidewalls becomes smaller.
In the case of HVD, making use of Eqs. (15) and (17) for
k
s
in the cases of 1/R and 1/R
2
diffusion, Eqs. (8) and (9)
and the temperature dependence of k
0
s
, one obtains the
effective diffusion lengths as functions of N
W
, hRi, T and
V in the form
k
s
¼ P
W
þ P
I
ðT
0
; V
0
Þ
V
V
0
exp F
s
T
0
T
À 1
þ
1
k
0
s
ðT
0
Þ
exp ÀG
s
T
0
T
À 1
#
À1
; k
s
( R ð21Þ
Table 1
Parameters of lateral size distribution and theoretical characteristics of
wire growth
Wires N
W
,
cm
À2
k
s
,
nm
N
I
,cm
À2
ecU
Al
0.33
Ga
0.67
As at
585 °C
2.7 · 10
9
43 5.9 · 10
9
0.32 0.07 13
GaAs at 560 °C2· 10
9
35 1.1 · 10
10
0.15 0.05 19
50 75 100 125 150 175 200
0
1000
2000
3000
4000
5000
6000
Length of nanowire [nm]
Diameter of nanowire [nm]
Fig. 1. Experimental (black squares) and theoretical (solid line) length–
diameter dependences of AlGaAs nanowires. Theoretical curve is obtained
from simplified equation (21) at k
s
= 43 nm and e À c = 0.25. Dotted line
is the 1/R-type theoretical curve from Ref. [33].
0 100 200 300 400 500
0
500
1000
1500
2000
2500
3000
3500
Length of nanowire [nm]
Diameter of nanowire [nm]
Fig. 2. Experimental (points) and theoretical (lines) length–diameter
dependences of GaAs nanowires. Squares, triangles and circles represent
experimental data from different parts of the substrate. Solid line –
simplified equation (21) at k
s
= 35 nm and e À c = 0.1. Dashed line is
obtained from general equations 7,8 at sin a =0,k
f
=10lm, e À c = 0.1,
b = 0.3 and other parameters given in Table 1.
V.G. Dubrovskii et al. / Surface Science 601 (2007) 4395–4401 4399
k
s
¼ 2pN
W
þ 2pN
I
ðT
0
; V
0
Þ
V
2
V
2
0
exp 2F
s
T
0
T
À 1
þ
1
½k
0
s
ðT
0
2
exp À2G
s
T
0
T
À 1
#
À1=2
; k
s
) R ð22Þ
Here, T
0
and V
0
are the reference values of temperature
and deposition rate, the quantities F
s
¼½ð3K
s
=2Þþ
E
s
D
=k
B
T
0
and G
s
¼ðE
s
A
À E
s
D
Þ=2k
B
T
0
are determined by
the characteristics of adtoms on the substrate surface. It
is seen that normally k
s
increases with the surface temper-
ature and decreases with the deposition flux and is limited
by the values of 1/(2phRiN
W
)or1=
ffiffiffiffiffiffiffiffiffiffiffiffiffi
2pN
W
p
, both decreas-
ing with the density of drops N
W
. The temperature and flux
dependence is dictated by Eq. (9) for the density of islands
N
I
, decreasing at higher T and lower V [30].
While considering the temperature dependence of wire
length during HVD, we should consider the growth equa-
tion beyond the limit L /k
f
( 1, because k
f
exponentially
decreases with T. Consider, for example, the case of 1/R
2
diffusion, when the function G in Eq. (2) is given by
G =(R/k
s
)ln(k
s
/R). Direct integration of Eq. (1) at
e À c = 0 with this G gives
R
2
lnðk
s
=RÞsinhðL=k
f
ÞþmRk
f
coshðL=k
f
ÞÀ1½¼
2k
2
s
k
f
H
ð23Þ
where m = r
f
D
s
/r
s
D
f
.AtL/k
f
! 0 and R/k
s
! 0 this equa-
tion is reduced to
L ffi
2k
2
s
R
2
lnðk
s
=RÞ
H / k
2
s
ð24Þ
This is the case of zero desorption from the sidewalls, tak-
ing place at sufficiently low substrate temperatures. There-
fore, at low T the dependence of L on the growth
conditions is dictated by the diffusion length on the sub-
strate surface k
s
, and wire length increases with the temper-
ature and decreases with the deposition flux. In the
opposite case of large L/k
f
Eq. (23) gives
L ffi ln
4k
2
s
H
mk
2
f
R
!
k
f
/ k
f
ð25Þ
At high T the wire length therefore decreases with the tem-
perature approximately as k
f
. This simple analysis shows
that the length of wire of given radius at otherwise same
conditions must have a maximum at a certain optimal tem-
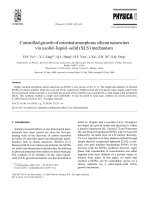
perature. Fig. 3 demonstrates the correlation between the-
oretical L(T) dependence obtained from Eqs. (22) and (23)
at fixed R = 25 nm with the experimental data on the
length of GaAs nanowires grown by MBE on the
GaAs(1 11)B surface activated by Au drops within the tem-
perature range of 460–600 °C. It is seen that the average
growth rate of nanowires is always higher than the deposi-
tion rate (2 A
˚
/s) in the interval of T from 460 to 590 °C, has
a maximum around 550–580 °C and rapidly decreases at
higher T due to adatom desorption from the sidewalls.
To conclude, we have developed theoretical model of
nanowire formation that can systematically handle the
description of the wire length depending on its radius and
technologically controlled growth conditions. Within the
range of growth conditions, L(R) curves obey the 1/R
2
law, and this dependence is verified experimentally for
Ga(Al)As wires. The drop density, temperature and flux
behavior of wire length has been also studied. It has been
shown that this behavior is principally different during high
temperature VPD, when the drop is fed by the particles ad-
sorbed on the sidewalls, and during HVD, when the wire
growth is mainly stimulated by the adatom diffusion from
the substrate surface. Finally, we have shown that the anal-
ysis of experimental L(R) curves provides important infor-
mation concerning the characteristics of growth processes
such as the effective diffusion length on the substrate sur-
face, the diffusion length on the sidewalls and the diffusion
flux to the wires.
Acknowledgements
The authors are grateful to the financial support re-
ceived from SANDiE program, different RFBR, Russian
Federal Agency for Science and Innovations within the
frame of Contract No. 02.513.11.3042 and different scien-
tific programs of RAS. N.V.S wishes to thank the Dynasty
Foundation for the financial support.
References
[1] G. Zheng, W. Lu, S. Jin, C.M. Lieber, Adv. Mater. 16 (2004) 1890.
[2] T. Bryllert, L E. Wernersson, L.E. Froberg, L. Samuelson, IEEE
Lett. 27 (2006) 323.
[3] K. Hiruma, M. Yazawa, T. Katsuyama, K. Ogawa, K. Haraguchi, M.
Koguchi, J. Appl. Phys. 77 (1995) 447.
450 500 550 600 650 700
0
2
4
6
8
10
Deposition rate
Average growth rate (A/s)
Surface temperature T (
°
C)
Fig. 3. Experimental (black circles) and theoretical (solid line) depen-
dences of the length of GaAs nanowires on the surface temperature.
Theoretical curve is obtained from Eqs. (22) and (23) at F
s
=6,G
f
= 25,
k
f
= 6000 nm, V = V
0
, T
0
= 560 °C, N
W
=2· 10
9
cm
À2
and
N
I
(T
0
)=1· 10
10
cm
À2
, m = 0.01.
4400 V.G. Dubrovskii et al. / Surface Science 601 (2007) 4395–4401
[4] M.T. Bjork, B.J. Ohlsson, T. Sass, A.I. Persson, C. Thelander, M.H.
Magnusson, K. Deppert, L.R. Wallenberg, L. Samuelson, Appl.
Phys. Lett. 80 (2002) 1058.
[5] E. Patolsky, G. Zheng, O. Hayden, M. Lakadamyali, X. Zhuang,
C.M. Lieber, Proc. Natl. Acad. Sci. USA 101 (2004) 14017.
[6] R.S. Wagner, W.C. Ellis, Appl. Phys. Lett. 4 (1964) 89.
[7] E.I. Givargizov, J. Cryst. Growth 31 (1975) 20.
[8] A.M. Morales, C.M. Lieber, Science 278 (1998) 208.
[9] F.M. Ross, J. Tersoff, M.C. Reuter, Phys. Rev. Lett. 95 (2005)
146104.
[10] L. Schubert, P. Werner, N.D. Zakharov, G. Gerth, F.M. Kolb, L.
Long, U. Go
¨
sele, T.Y. Tan, Appl. Phys. Lett. 84 (2004) 4968.
[11] X. Duan, C.M. Lieber, Adv. Mater. 12 (2000) 298.
[12] B.J. Ohlsson, M.T. Bjork, A.I. Persson, C. Thelander, L.R. Wallen-
berg, M.H. Magnusson, K. Deppert, L. Samuelson, Physica E 13
(2002) 1126.
[13] W. Seifert, M. Borgstrom, K. Deppert, K.A. Dick, J. Johansson,
M.W. Larsson, T. Martensson, N. Skold, C.P.T. Svensson, B.A.
Wacaser, L.R. Wallenberg, L. Samuelson, J. Cryst. Growth 272
(2004) 211.
[14] V.G. Dubrovskii, G.E. Cirlin, I.P. Soshnikov, A.A. Tonkikh, N.V.
Sibirev, Yu.B. Samsonenko, V.M. Ustinov, Phys. Rev. B 71 (2005)
205325.
[15] J.C. Harmand, G. Patriarche, N. Pe
´
re
´
-Laperne, M N. Me
´
rat-
Combes, L. Travers, F. Glas, Appl. Phys. Lett. 87 (2005)
203101.
[16] M.C. Plante, R.R. LaPierre, J. Cryst. Growth 286 (2) (2006) 394.
[17] V.G. Dubrovskii, I.P. Soshnikov, N.V. Sibirev, G.E. Cirlin, V.M.
Ustinov, J.Cryst.Growth 289 (2006) 31.
[18] A.A. Tonkikh, G.E. Cirlin, V.G. Dubrovskii, N.V. Sibirev, I.P.
Soshnikov, Yu.B. Samsonenko, N.K. Polyakov, V.M. Ustinov, Phys.
Stat. Sol. (a) 203 (2006) 1365.
[19] E.I. Givargizov, A.A. Chernov, Kristallografiya 18 (1973) 147.
[20] E.I. Givargizov, A.A. Chernov, J. Cryst. Growth 31 (1975) 20.
[21] D. Kashchiev, Cryst. Growth Design 6 (2006) 1154.
[22] D. Kashchiev, Nucleation: Basic Theory with Applications, Butter-
worth Heinemann, Oxford, 2000.
[23] V.G. Dubrovskii, N.V. Sibirev, Phys. Rev. E 70 (2004) 031604.
[24] V.G. Dubrovskii, N.V. Sibirev, G.E. Cirlin, J.C. Harmand, V.M.
Ustinov, Phys. Rev. E 73 (2006) 021603.
[25] W. Dittmar, K. Neumann, in: R.H. Doremus, B.W. Roberts, D.
Turnball, N.Y. John (Eds.), Growth and Perfection of Crystals,
Wiley, 1958, p. 121.
[26] V. Ruth, J.R. Hirth, J. Chem. Phys. 41 (1964) 31.
[27] J.M. Blakely, K.A. Jackson, J. Chem. Phys. 37 (1962) 428.
[28] V.G. Dubrovskii, N.V. Sibirev, R.A. Suris, G.E. Cirlin, V.M.
Ustinov, M. Tchernycheva, J.C. Harmand, Semiconductors 40
(2006) 1075.
[29] V.G. Dubrovskii, N.V. Sibirev, Tech. Phys. Lett. 32 (3) (2006) 185.
[30] V.G. Dubrovskii, N.V. Sibirev, G.E. Cirlin, V.M. Ustinov, Semicon-
ductors 40 (2006) 249.
[31] T. Takebe, M. Fujii, T. Yamamoto, K. Fujita, T. Watanabe, J. Appl.
Phys. 81 (1997) 7273.
[32] S. Koshiba, Y. Nakamura, M. Tsuchiya, H. Noge, H. Kano, Y.
Nagamune, T. Noda, H. Sakaki, J. Appl. Phys. 76 (1994) 4138.
[33] G.E. Cirlin, V.G. Dubrovsii, N.V. Sibirev, I.P. Soshnikov, Yu.B.
Samsonenko, A.A. Tonkikh, V.M. Ustinov, Semiconductors 39
(2005) 557.
V.G. Dubrovskii et al. / Surface Science 601 (2007) 4395–4401 4401