Encyclopedia of geology, five volume set, volume 1 5 (encyclopedia of geology series) ( PDFDrive ) 1596
Bạn đang xem bản rút gọn của tài liệu. Xem và tải ngay bản đầy đủ của tài liệu tại đây (95.16 KB, 1 trang )
414 METAMORPHIC ROCKS/PTt-Paths
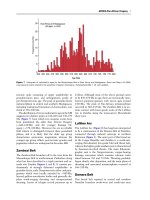
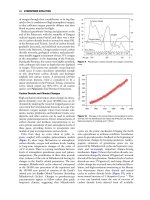
Figure 5 Schematic PTt path for crustal thickening by instantaneous overthrusting as typical for one dimensional modelling. Point
A on the prethrusting geotherm undergoes an isothermal pressure increase to B followed by isobaric heating for 20 Ma before erosion
is initiated.
How can the clockwise PTt loop of Figure 4 be used
as an aid to understanding the PTt evolution of natural metamorphic rocks? The PTt loop shows a wide
range in PT conditions and, if superimposed on a facies
diagram, would show an evolution passing through
several different facies. Mineral reactions and diffusive
transport are, however, thermally activated with kinetics following an Arrhenius relationship. For this
reason, reaction rates increase exponentially with temperature and therefore the peak temperature is likely to
be the point where most reaction occurs. Cooling after
the thermal peak will see a slowing of reaction and
material transport such that the peak temperature mineral assemblage is preferentially preserved. In addition,
the general shape of dehydration reactions means that a
higher degree of fluid release, useful for material transport during prograde reaction, will occur for a path of
increasing temperature with minor pressure change.
Once fluids have left the system at the thermal peak,
any retrogression to hydrous assemblages during
cooling will be hindered by the absence of a free fluid
phase thus again favouring preservation of the peak
temperature assemblage. Combining this information
it is possible to predict the most likely determinable PT
point for a rock that followed a standard clockwise PTt
path, based on preserved mineral assemblage for the
temperature peak.
If, for a single segment of crust, several rocks formerly at different depths are traced, it is possible to plot
the loci of their peak temperature points (Figure 6A).
These are the most probable PT points that would be
determinable for rocks that had followed these particular paths and represents the sort of information
available from field geology for a tilted and peneplained regional metamorphic terrane: hence the
name metamorphic field gradient (sometimes also
piezothermic array). Several important points can be
deduced from this plot especially when additional
temperature–age (Figure 6B) and depth–age plots
(Figure 6C) for the same model are presented. Firstly,
the metamorphic field gradient defines a PT trend
that lies between that of the initial and final geotherms. However, the points defining this trend represent different ages, visible from Figures 6B and
6C, and so the curve does not represent any actual,
temporary geotherm that occurred during the thermal
relaxation. Thus, the sequence of preserved metamorphic rocks is not the same as would be predicted,
for example, along one of the Figure 3 thermal trends.
The age difference between the different preserved
points is also important. If a major deformation
event occurred at 25 Ma, this would be syntectonic
with respect to rock B but would be pretectonic for
rock A and post-tectonic for rock C. In addition, the
difference in depth of the peak-temperature points
(see Figure 6C) is less than the true depth difference,
thus leading to an apparent thinning of the crustal
section. Such thermal models for crustal thickening
followed by exhumation, although relatively simple,
illustrate some of the fundamental problems inherent
in trying to interpret natural metamorphic sequences.
Contact Metamorphism
So far the models presented have considered only
the effects of tectonically induced crustal-scale