- Trang chủ >>
- Khoa Học Tự Nhiên >>
- Vật lý
Structural investigation of silicon nanowires using GIXD and GISAXS evidence of complex saw tooth faceting
Bạn đang xem bản rút gọn của tài liệu. Xem và tải ngay bản đầy đủ của tài liệu tại đây (1.68 MB, 6 trang )
Structural investigation of silicon nanowires using GIXD and GISAXS: Evidence
of complex saw-tooth faceting
Thomas David
*
, Denis Buttard, Tobias Schülli, Florian Dallhuin, Pascal Gentile
CEA/GRENOBLE-INAC/SP2M/SiNaPS, 17 rue des Martyrs, 38054 Grenoble Cedex 9, France
article info
Article history:
Received 21 March 2008
Accepted for publication 24 June 2008
Available online 2 July 2008
Keywords:
X-ray scattering
Diffraction
GIXD
GISAXS
Epitaxy
Silicon
Nanowire
Facet
abstract
We present the results of X-ray experiments on silicon nanowires grown on h111i-oriented silicon sub-
strate using the vapor liquid solid method. Grazing incidence X-ray diffraction shows that nanowires are
in epitaxy on the substrate and have a hexagonal cross-section. The orientations of the sides are then
determined. Grazing incidence small-angle X-ray scattering experiments reveal fine saw-tooth faceting
of the sides of the nanowires. This fine saw-tooth faceting appears with alternating upward and down-
ward orientations on each side of the nanowires, reflecting the trigonal symmetry of the nanowires.
The crystallographic orientation of some of these facets is then determined. Finally, it is observed that
large-diameter nanowires (diame ter larger than 200 nm) exhibit six additional faces that truncate the
edge of the usual hexagonal cross-section of the nanowires. These additional faces also show saw-tooth
faceting which is tilted with respect to the horizontal and seems to be present only around the top of the
nanowires.
Ó 2008 Elsevier B.V. All rights reserved.
1. Introduction
In many fields of physics today, there is a growing need for
smaller and smaller structures. Microelectronics immediately
comes to mind, but biology, optics and even mechanics have a
similar need. This need has drawn the attention of many research
people to nanostructures. Among these interesting structures,
nanowires, grown by the vapor liquid solid (VLS) method [1],
have attracted particular attention, one of the reasons being their
many potential applications. Concerning the choice of material,
silicon is extremely well-known and thus seems to be a good can-
didate. The first obvious use of such nanostructures would be in
microelectronics, but nanowires could also be extremely useful
in the field of sensors for instance. In order to use these basic
structures, however, we need to understand their structural prop-
erties. A few studies have already shown interest in the structural
and morphological properties of silicon nanowires grown by VLS
[2–5], with the very small diameters (5–20 nm) attracting most
attention. It seems that nanowires generally grow in epitaxy on
the silicon substrate if the interface between the catalyst and
the silicon is clean at the beginning of growth. In addition, ‘Big’
nanowires (with a diameter greater than 50 nm) appear to have
six sides, one out of two presenting saw-tooth faceting [5], with
the preferred growth direction being the h111i direction of the
silicon crystal. In the case of smaller diameters, however, six faces
also appear but the axis and the faces of the nanowire exhibit dif-
ferent directions [4,6]. In order to investigate the crystalline nat-
ure and faceting of an assembly of small objects, X-rays are a very
suitable tool. With regard to shape in particular, grazing incidence
small-angle X-ray scattering (GISAXS) has already proved its effi-
ciency in the study of silicon nanocrystals [7]. We performed
grazing incidence X-ray diffraction (GIXD) and GISAXS experi-
ments on ‘big’ silicon nanowires (diameters from 50 to 500 nm)
grown by VLS on h111i-oriented silicon substrate with a gold cat-
alyst. Crystal orientation and structural properties of the nano-
wires were deduced from GIXD while GISAXS provided
information about the shape of the nanowires, their faceting
and the orientation of their facets.
2. Experimental details
2.1. Nanowire growth
Nanowires were grown on a h111i oriented silicon substrate.
The catalysts used in the VLS reaction were gold droplets dewetted
from a thin evaporated film ($ 2 nm thick). The growth took place
0039-6028/$ - see front matter Ó 2008 Elsevier B.V. All rights reserved.
doi:10.1016/j.susc.2008.06.022
* Corresponding author. Tel.: +33 4 38 78 31 12; fax: +33 4 38 78 58 17.
E-mail address: (T. David).
Surface Science 602 (2008) 2675–2680
Contents lists available at ScienceDirect
Surface Science
journal homepage: www.elsevier.com/locate/susc
in a chemical vapor deposition (CVD) reactor, at 20 mbar and
around 600 °C. The gazeous precursor was silane whereas the car-
rier gas was hydrogen. For additional details about controlled VLS
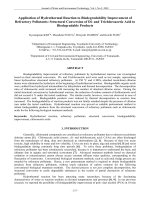
growth of silicon nanowires see [8]. After growth, scanning elec-
tron microscopy (SEM) images of the resulting nanowires were
produced (Fig. 1) and showed h111i oriented nanowires perpendic-
ular to the surface of the substrate. Their diameters were not con-
trolled because the diameters of the droplets obtained from the
dewetting of a gold film are variable. However, we obtained a dis-
tribution of diameters around a given value fixed by the growth
parameters (see [2,3] for details about the dependence of diame-
ters on growth conditions). Their length was about 3.5
l
m, deter-
mined by the duration of growth and was fairly independent of
the diameter for a given set of parameters (except for small diam-
eters as shown in [9]). Some kinks may appear but they can be re-
duced by changing growth parameters (temperature, silane partial
pressure ) [3].
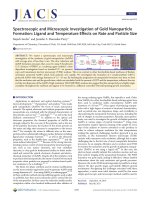
2.2. GIXD and GISAXS setup
GIXD and GISAXS experiments were performed at the European
synchrotron radiation facility (ESRF) in the SUV instrument of the
BM32 beamline under ultra high vacuum (UHV) conditions. The
experimental configuration is shown in Fig. 2. The X-ray wave-
length was k = 0.1062 nm and the pressure was around
10
À10
mbar. Grazing incidence was used in order to obtain as much
signal as possible coming from the nanowires and not from the
substrate (
a
i
typically around the critical angle for total reflection
a
c
¼ 0:15
for the selected wavelength). In GIXD, the emergent an-
gle
a
e
with respect to the sample surface remains small and com-
parable to
a
i
while the scattering angle 2d in the plane of the
sample surface can be large. In GISAXS, both emergent and scatter-
ing angles are small, and images of the scattered intensity are re-
corded just around the direct beam and specular reflection. For
GIXD, a position sensitive detector (PSD) was used while for GI-
SAXS a 1152 Â 1242 pixels low-noise 16-bit CCD detector from
Princeton was used.
3. Results
3.1. GIXD: Shape and epitaxial orientation of the nanowires
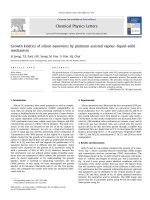
Fig. 3a shows a profile of the diffracted intensity around the
ð2
20Þ reflection. We observe two diffraction peaks, the narrower
(S) coming from the substrate and the broader (NW) from the wires,
indicating that nanowires are single crystals and that their in-plane
orientation is the same as the one of the substrate. Using Bragg’s
law 2d sinh ¼ k for the selected wavelength k = 0.10619 nm we
can estimate the lattice parameter a
Si
and a
nw
, respectively, of the
substrate and the nanowires. We then deduce the lattice mismatch
parameter da=a ¼ða
nw
À a
Si
Þ=a
Si
¼À1:23  10
À3
corresponding to a
compression. Analysis of this strain is in progress but it can be ten-
tatively explained by surface effects in the nanowires coming from
a thin oxide shell.
Fig. 3b shows a reciprocal space map of the diffracted intensity
around the ð2
20Þ peak of silicon. On this map, we see six diffusion
streaks indicated by the dotted lines. These streaks are produced
by vertical ‘‘planes”. Consequently, they provide evidence of the
hexagonal cross-section of the wires. The angle between two
streaks is 60° and the directions of the six sides of the nanowires
can be deduced from the directions of these streaks on the map.
Thus, the directions of the six sides of the nanowires are
½
1
12; ½
12
1; ½2
1
1; ½11
2; ½1
21 and ½
211. Similarly, the directions
of the edges between two faces are ½1
10 and the five other equiv-
alent directions. These results are consistent with previous elec-
tronic microscopy observations [10]. As this map shows the
scattered intensity coming from the entire population of nano-
wires illuminated by the beam, we can be sure that these nano-
wires are all in epitaxy with the substrate and have the same in-
plane orientation. Otherwise the map would show an arc following
a Debye–Scherrer ring.
The same experiment was performed on another sample ob-
tained after a shorter period of growth, resulting in nanowires at
the very beginning of their growth. The corresponding map (not
shown) has a round shape without streaks, showing that the hexa-
gon faces have not yet been formed.
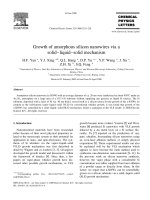
3.2. GISAXS: fine saw-tooth faceting
Fig. 4a shows a GISAXS image obtained with the incident beam
along the ½1
10 direction (i.e., incoming on the nanowires through
an edge), while Fig. 4b shows the same image obtained with the
incident beam along the ½
1
12 direction. The coordinates on the im-
age correspond to the in-plane ðq
x
Þ and the out-of-plane ðq
z
Þ scat-
tering vector. As there is no periodic vertical rod, no lateral
periodicity of the wires is observed. However we can observe sev-
eral tilted rods on the left and right of the image. As the rods are
tilted, the facets do not correspond to the principal faces of the
Fig. 1. SEM images of nanowires. (a) overall view, (b) single nanowire, (c), (d) and
(e) detailed views from (b). Every face seems to be saw-tooth faceted with different
types of facets oriented upwards. (SF) type faces have small upward-facing facets
while (LF) type faces have large upward-facing facets. The edges of the hexagonal
prism are truncated and the cross-section would thus be dodecagonal. These new
faces are themselves finely faceted with tilted facets (TF), and appear wide at the
top of the nanowire (c) and almost non-existent at the bottom (d).
Fig. 2. Setup used for GIXD experiments.
~
k
i
and
~
k
e
are, respectively the incident and
emergent wave vector. The scattering vector is
~
q ¼
~
k
e
À
~
k
i
with q ¼
4
p
k
sinðhÞ.
2676 T. David et al. / Surface Science 602 (2008) 2675–2680
hexagonal cross-section of the wires shown earlier. These rods are
produced by supplementary facets on the principal faces. This is
consistent with the saw-tooth faceting observed earlier [5,10].By
measuring the tilt angle we can estimate the orientation of the
facets.
Finally, on all GISAXS measurements, and especially in Fig. 4a, a
splitting of the scattered streak may be observed. This phenome-
non is due to multiple scattering effects and has already been
investigated [11–15].
The diffuse streaks produced by facets are schematically repre-
sented in Fig. 5. The incident X-ray beam is scattered by facets and
the scattering vector
~
q normal to these facets is located by angles
a
R
and
u
. The axis x and z correspond to the plane of the CCD cam-
era (respectively the horizontal and the wires axes), while y is the
X-ray beam direction. In the plane of the camera, the projection of
the vector
~
q has a measured angle
a
M
from the vertical. Depending
on the facet orientation in relation to the CCD plane
u
can take sev-
eral values. If the facet is normal to the CCD plane
u
¼ 0
,so
~
q
xy
and
~
q are in the CCD plane and no correction is needed
ð
a
R
¼
a
M
Þ. But if
u
6¼ 0
;
~
q
xy
and
~
q are out of the CCD plane and a
correction is needed as tanð
a
R
Þ¼tanð
a
M
Þ= cosð
u
Þ. It is important
to note that the visibility of streaks on the GISAXS image decreases
quickly when
u
increases. Facet indexation with the corrected an-
gle is analysed in Section 4.
4. Analysis and discussion
4.1. Complex saw-tooth faceting
The asymmetry in Fig. 4a reflects the trigonal character of the
nanowires. This is not in contradiction with the Friedel rule of cen-
trosymmetry nor with the six symmetrical diffuse scattering
streaks around the ð 2
20Þ reflection of silicon obtained in Fig. 3b. In-
deed, in GISAXS the full inversion symmetry rule is eliminated
[16,17]. This apparent trigonal character corroborate the observa-
Fig. 3. (a) Experimental profile of diffraction (dotted line) close to the ð2
20Þ peak of silicon with peak (S) from the substrate and peak (NW) from the nanowires. The solid
lines correspond to fits for the center of the peaks in order to accurately determine the maximum peak position, (b) Reciprocal space map of scattered intensity (arbitrary
units) around the ð2
20Þ peak of silicon. h and k are the reciprocal space coordinates. There are six diffusion streaks spread regularly every 60° around the peak, providing
evidence of the hexagonal cross-section of the nanowires and thus allowing determination of faces direction.
Fig. 4. GISAXS image obtained along (a) the ½1
10 direction and (b) the ½
1
12 direction. We see diffusion streaks tilted in relation to the vertical q
z
direction, produced by
different facet families. The angles indicated correspond to the measured angles ð90
À a
M
ÞÀa
M
and u are defined in Fig. 5. In image (a) asymmetry between the left and
right is noticeable, while image (b) is symmetrical. Intensity is given in a logarithmic scale. Inserts: schematic top view of a nanowire cross-section.
T. David et al. / Surface Science 602 (2008) 2675–2680
2677
tions of Ross et al. in [5] which show that only one out of two sides
are saw-tooth faceted. However, as shown in Fig. 1b–e, our SEM
observations are not very consistent with the simple faceting mod-
el usually proposed. Indeed, we observe saw-tooth faceting on each
side of the nanowire. For large-diameter wires (i.e. diameter larger
than 200 nm) the hexagonal cross-section is replaced by a dodec-
agonal section. It seems that the six additional faces are wider at
the top (Fig. 1c), while almost non-existent at the bottom (Fig. 1d).
All these observations lead us to reconsider the nanowire facet
model and to propose a new one, as shown in Fig. 6.InFig. 6awe
can observe the dodecagonal section. The twelve faces are all saw-
tooth faceted and distributed in three families. The (LF) family cor-
responds to large upward-oriented facets as indicated in Fig. 6b
and the (SF) family corresponds to small upward-oriented facets.
The two opposite faces are centrosymetric. This is the reason
why the GISAXS image in Fig. 4a is asymmetric. This is perfectly
consistent with the trigonal character of the nanowires. For large
diameter nanowires (diameter larger than 200 nm), six additional
faces appear as a result of the truncation of the hexagon edge, pro-
ducing the (TF) family corresponding to tilted saw-tooth faceting.
The GISAXS image is consistent with this explanation, as shown
in Fig. 7. On the GISAXS image in Fig. 7, the ‘large’ facets produce a
streak at 10
¼ð90
À
a
Mright
Þ¼ð90
À
a
R
Þ on the right of the image
and one at 19:5
¼ð90
À
a
Mleft
Þ on the left ðtanð
a
Mleft
Þ¼
tanð
a
R
ÞÂcosð60
ÞÞ. However, the streak at 19.5° should be much
less intense than the one at 10° because of the in-plane angle cor-
rection explained earlier. In the same way, the ‘small’ facets would
produce streaks at 19.5° (intense) and 37° (weak). Combining the
two, we have one superimposed streak at 19.5° on the left of the
image and two distinct streaks at 10° and 37° on the right. As
the streak at 37° corresponds to a diffraction vector outside the
detector plane ð
u
6¼ 0
Þ, its intensity is very weak compared to
the two other at 10° and 19.5°. This is exactly what we observe
in Figs. 4a and 7 with an acceptable error of 1°. The SEM image
in Fig. 1 corresponds well with this explanation since we measure
an angle of about 9.5° with respect to the vertical for the large fac-
ets and 20° for the small ones. It is interesting to note that the an-
gles determined locally by Ross et al. in [5] using SEM measure
11.2° and 23.3° values, which are close to ours. Similar results have
also been reported with TEM observations [10]. In terms of direc-
tion, the facets tilted at 19.5° correspond to ð
1
11Þ planes and those
tilted at 10° correspond to ð
1
13Þ planes.
Finally, we must explain the existence of the diffuse streaks at
approximately 60° in Fig. 4a and at approximately 34° in Fig. 4b.
For big wires with a diameter larger than 200 nm, tilted facets ap-
pear, as we can see in Fig. 1e, at an angle with respect to the hor-
izontal
x
% 58
. By applying corrections, we can find the
approximate orientation of the diffuse streaks in Fig. 4a and b.
Fig. 5. Schematic representation of the faceted wire and the CCD camera plane.
~
q is
the diffuse vector, x; the horizontal axis in the CCD plane, y; the X-ray beam
direction, z; the wire axis,
a
R
and a
M
, respectively the real and measured angles
between
~
q and the vertical and
u the angle between the normal of the facet and the
CCD plane.
Fig. 6. Model of the nanowires. (a) The nanowire cross-section has the six usual
faces, all saw-tooth faceted. Half of them (LF) present the large upward-facing facets
and the other half (SF) present the small upward-facing facets. The six additional
faces truncating the edges are represented in red and marked (TF). They also exhibit
a saw-tooth faceting but with tilted facets. (b) shows a view in the vertical plane
along the direction indicated by the blue arrow in (a). The two opposite faces are of
different type, one being (LF) and the other (SF). This is the reason why the GISAXS
image is asymmetric. (For interpretation of the references to colour in this figure
legend, the reader is referred to the web version of this article.)
Fig. 7. Correspondence between the streaks visible on the GISAXS image and the
different types of faces. The two streaks marked with black solid lines correspond to
the facets whose normal is in the detector plane ð
u ¼ 0
Þ. These facets are present
on two of the faces of types (LF) and (SF). The two streaks marked with large blue
dashed lines correspond to the same facets but with
u 6¼ 0
, present on the other
faces of type (LF) and (SF). Finally, the two streaks marked with small red dashed
lines probably correspond to the other tilted facets present on the faces of type (TF).
These faces are only present on nanowires whose diameters are larger than 200 nm.
The intensity is given in a logarithmic scale. (For interpretation of the references to
colour in this figure legend, the reader is referred to the web version of this article.)
2678 T. David et al. / Surface Science 602 (2008) 2675–2680
4.2. Other results concerning silicon faceting
Numerous theoretical articles have already been published on
this topic. These have usually demonstrated that the orientation
of these facets strongly depends on growth conditions and espe-
cially on temperature. Thus Bermond et al. [18] conducted experi-
mental observations of silicon nanowhisker faceting at different
temperatures. The results show facets of type {1 1 3}, {110},
{100} and {111} after annealing at T > 1000 K. The authors provide
evidence that these facets depend on surface tension
c
. They show
that
c
110
¼ 0:98
c
111
;
c
113
¼ 0:98
c
111
and
c
100
¼ 0:96
c
111
, leading to
c
111
>
c
110
>
c
113
>
c
100
, which is non-conventional.
On the other hand, Zhang et al. [19] carried out calculations for
structures and energetics for hydrogen-terminated silicon nano-
wire surfaces that produced more classical results. The h112i sili-
con nanowires with only two {1 1 1} and two {110} surfaces
appear to be more energetically favorable than the h110i wire sur-
rounded by four {1 1 1} surfaces. In the case of h111i nanowires, dif-
ferent faceting is possible, leading to different cross-sections such
as triangular, truncated triangular or hexagonal. The stability of sil-
icon nanowires is determined by competition between the minimi-
zation of surface energy of facets
c
111
<
c
110
<
c
100
, in inverse
proportion to the surface atomic density of these facets, and the
minimization of the surface-to-volume ratio svr ðsvr
hexag:
>
svr
rectangular
> svr
triang:
Þ.
Important among the theoritical studies is the article by Rurali
et al. [20] which studied the geometrical structure and electronic
properties of h100i and h110i silicon nanowires in the absence of
surface passivation. The authors showed that the reconstruction
of the facets can lead to surface metallic states. Other studies on
surface conduction and silicon nanotube faceting include Rurali
et al. [21], Kobayashi [22] or Zhao et al. [23]. An interesting study
on simulated calculations was conducted by Justo et al. [24] in
which, for different growth directions (h001i, h110i and h112i), var-
ious possible facet shapes, such as hexagonal or square, were cal-
culated. In the case of growth direction h112i the wires
comprised only {1 11} and {110} surfaces. This indicates that the
surface plays a key role in nanowire energy and that the wire
perimeter is a meaningful dimensional parameter.
Although some articles deal with molecular beam epitaxy
(MBE) growth [25], VLS growth is usually performed in a CVD reac-
tor. In the first study reported by Wagner and Ellis [1], the authors
clearly demostrate the growth of silicon wires on silicon h111i sub-
strate using gold as a catalyst. Alternatively, {2 1 1} and {110} fac-
ets are observed resulting in a hexagonal wire cross-section.
Although not discussed, microscopy images also exhibit non-peri-
odic saw-tooth faceting. Pan et al. [26] obtained more ‘‘exotic” re-
sults with the growth of germanium islands on silicon nanowires.
In this study, h11
2i silicon nanowires revealed {1 1 1}, f1
10g and
{113} facets.
The most detailed studies on silicon nanowire faceting, how-
ever, are those by Hannon et al. [27] with sidewall morphology
and Ross et al. [5] with saw-tooth faceting. They interpret this fac-
eting term of both the role of the geometry and surface energy of
the wire and the liquid droplet, and report that the period and
amplitude of saw-tooth faceting are directly proportional to wire
diameter. However, the origin of the facets presented in the litera-
ture is not really explained or understood, even if it is clear that the
gold catalyst plays a key role.
4.3. Why these facets in our experiments?
As briefly shown above, surface faceting mechanisms have been
attracting attention for years. See [28] for instance, for a general
explanation of parameters determining stable facets. With regard
to bulk silicon, many groups have studied different types of facet-
ing, especially in the presence of gold on the surface, and mostly
using self-organised systems [29–31]. Most stable facet orienta-
tions in all these studies appear to depend on the gold covering
of the silicon surface but h111i and h113i directions seem to be
particularly stable, corroborating our results. Thus, each natural
ð
1
12Þ side of our nanowires would show ð
1
11Þ and ð
1
13Þ facets.
Furthermore, the six additional tilted facets that truncate the
edges produce another type of facet, with different orientations.
Even if we cannot determine these orientations precisely, we can
assume that their stability toward one of the ð
1
11Þ and ð
1
13Þ facets
depends on gold coverage (just like every facet in the previously
mentioned studies). Assuming these tilted facets become more sta-
ble than the others when gold coverage increases, this would ex-
plain why they are wider near the top of nanowires (where there
is more gold diffusing from the gold catalyst droplet) than at the
bottom (where less gold can diffuse). Obviously this still has to
be investigated but, once again, as gold coverage often seems to
influence the stability of the different facets, this could be a possi-
ble explanation.
5. Conclusion
Our investigations into the morphological and structural prop-
erties of epitaxial silicon nanowires grown by CVD/VLS on a
h111i oriented silicon substrate have shown the nanowires to be
epitaxial on the h111i-oriented substrate and to have a hexagonal
cross-section with sides oriented in h
1
12i directions.
We determined the direction of small saw-tooth facets (ð
1
11Þ
and ð
1
13Þ) and found that this saw-tooth faceting appeared on
every side of the nanowires rather than on one of the two sides.
However, the faceting proved to be head-to-tail on half of the sides,
thus confirming the trigonal symmetry of the nanowires. As X-rays
show the average signal from the nanowires over the whole sam-
ple, all these properties are visible only because of the overall
homogeneity.
Finally, we observed a change in cross-section from hexagonal
to dodecagonal near the top of the large nanowires. The new sides
also seem to be saw-tooth faceted but with another kind of facet.
The relative stability of these other facets compared with the
‘usual’ ones might be the result of a different level of surface gold
coverage near the catalyst.
Acknowledgements
This work has been carried out as part of the PREEANS ANR pro-
ject. We are sincerely grateful to T. Baron and P. Ferret for their
fruitful discussions.
References
[1] R.S. Wagner, W.C. Ellis, Appl. Phys. Lett. 4 (1964) 89.
[2] F. Dhalluin, P.J. Desré, M.I. den Hertog, J L. Rouvière, P. Ferret, P. Gentile, T.
Baron, J. Appl. Phys. 102 (2007) 094906.
[3] J. Westwater, D.P. Gosain, S. Tomiya, S. Usui, H. Ruda, J. Vac. Sci. Technol. B 15
(1997) 554.
[4] D.D.D. Ma, C.S. Lee, F.C.K. Au, S.Y. Tong, S.T. Lee, Science 299 (2003) 1874.
[5] F.M. Ross, J. Tersoff, M.C. Reuter, Phys. Rev. Lett. 95 (2005) 146104.
[6] Y. Wu, Y. Cui, L. Huynh, C.J. Barrelet, D.C. Bell, C.M. Lieber, Nanoletters 4 (2004)
433.
[7] G. Renaud, R. Lazzari, C. Revenant, A. Barbier, M. Noblet, O. Ulrich, F. Leroy, J.
Jupille, Y. Borensztein, C.R. Henry, J P. Deville, F. Scheurer, J. Mane-Mane, O.
Fruchart, Science 300 (5624) (2003) 1416.
[8] P. Gentile, T. David, F. Dhalluin, D. Buttard, N. Pauc, M. Den Hertog, P. Ferret, T.
Baron, Nanotechnology 19 (2008) 125608.
[9] J. Kikkawa, Y. Ohno, S. Takeda, Appl. Phys. Lett. 86 (2005).
[10] M.I. Den Hertog, J.L. Rouvière, F. Dhalluin, P. Gentile, P. Ferret, C. Ternon, T.
Baron, Inst. Phys. Conf. Ser. (in press).
[11] M. Rauscher, R. Paniago, H. Metzger, Z. Kovats, J. Domke, J. Peisl, J. Appl. Phys.
86 (1999) 6763.
T. David et al. / Surface Science 602 (2008) 2675–2680
2679
[12] F. Leroy, J. Eymery, D. Buttard, G. Renaud, R. Lazzari, J. Cryst. Growth 275
(2005) e2195.
[13] R. Lazzari, F. Leroy, G. Renaud, Phys. Rev. B 76 (2007) 125411.
[14] R. Lazzari, G. Renaud, J. Jupille, F. Leroy, Phys. Rev. B 76 (2007) 125412.
[15] C. Revenant, F. Leroy, G. Renaud, R. Lazzari, A. Letoublon, T. Madey, Surf. Sci.
601 (2007) 3431.
[16] M. Rauscher, T. Salditt, H. Spohn, Phys. Rev. B 52 (1995) 16855.
[17] P. Busch, M. Rauscher, D M. Smilgies, D. Posselt, C.M. Papadakis, J. Appl.
Crystallogr. 39 (2006) 433.
[18] J.M. Bermond, J.J. Métois, X. Egéa, F. Floret, Surf. Sci. 330 (1995) 48.
[19] R.Q. Zhang, Y. Lifshitz, D.D.D. Ma, Y.L. Zhao, Th. Frauenheim, S.T. Lee, S.Y. Tong,
J. Chem. Phys. 123 (2005) 144703.
[20] R. Rurali, A. Poissier, N. Lorente, Phys. Rev. B 74 (2006) 165324.
[21] R. Rurali, N. Lorente, Nanotechnology 16 (2005) S250.
[22] K. Kobayashi, Phys. Rev. B 69 (2004) 115338.
[23] M. Zhao, R.Q. Zhang, Y. Xia, C. Song, S.T. Lee, J. Phys. Chem. 111 (2007) 1234.
[24] J.F. Justo, R.D. Menezes, L.V.C. Assali, Phys. Rev. B 75 (2007) 045303.
[25] L. Schubert, P. Werner, N.D. Zakharov, G. Gerth, F.M. Kolb, L. Long, U. Gösele,
T.Y. Tan, Appl. Phys. Lett. 84 (2004) 4968.
[26] L. Pan, K.K. Lew, J.M. Redwing, E.C. Dickey, Nano Lett. 5 (2005) 1081.
[27] J.B. Hannon, S. Kodambaka, F.M. Ross, R.M. Tromp, Nature 440 (2006) 69.
[28] E.D. Williams, N.C. Bartelt, Ultramicroscopy 31 (1989) 36.
[29] R. Hild, C. Seifert, M. Kammler, F J. Meyer zu Heringdorf, M. Horn-von-
Hoegen, R.A. Zhachuk, B.Z. Olshanetsky, Surf. Sci. 512 (2002) 117.
[30] D. Sanchez-Portal, R.M. Martin, Surf. Sci. 532–535 (2003) 655.
[31] J.W. Dickinson, J.C. Moore, A.A. Baski, Surf. Sci. 561 (2004) 193.
2680 T. David et al. / Surface Science 602 (2008) 2675–2680