Báo cáo khoa học: Mapping contacts between regulatory domains of skeletal muscle TnC and TnI by analyses of single-chain chimeras potx
Bạn đang xem bản rút gọn của tài liệu. Xem và tải ngay bản đầy đủ của tài liệu tại đây (319.16 KB, 12 trang )
Mapping contacts between regulatory domains of skeletal
muscle TnC and TnI by analyses of single-chain chimeras
Ana O. Tiroli
1,2,
*, Ljubica Tasic
1,
*
,
†, Cristiano L. P. Oliveira
1,3
, Carlos Bloch Jr
1,4
, Iris Torriani
1,3
,
Chuck S. Farah
5
and Carlos H. I. Ramos
1,2
1 Centro de Biologia Molecular Estrutural, Laborato
´
rio Nacional de Luz Sı
´
ncrotron, Brazil
2 Departamento de Bioquı
´
mica, Instituto de Biologia, Universidade Estadual de Campinas, Brazil
3 Instituto de Fı
´
sica, Universidade Estadual de Campinas, Brazil
4 Laborato
´
rio de Espectrometria de Massa, Embrapa-Recursos Gene
´
ticos e Biotecnologia, Brazil
5 Departamento de Bioquı
´
mica, Instituto de Quı
´
mica, Universidade de Sa˜o Paulo, Brazil
Muscle contraction is regulated by the troponin (Tn)
complex, which is composed of three subunits: TnC,
TnI, and TnT [1,2]. TnC is the calcium binding sub-
unit that possesses two Ca
2+
-binding sites per domain
[3,4]. TnI inhibits the actomyosin Mg
2+
-ATPase
in the presence of tropomyosin and inhibition is
removed by TnC [5]. The inhibitory activity of TnI
has been associated with a central peptide corres-
ponding to residues 98–116, known as the inhibitory
region [5].
Keywords
troponin; muscle contraction; protein
engineering; limited proteolysis; solution
structure
Correspondence
C.H.I. Ramos, Centro de Biologia Molecular
Estrutural, Laborato
´
rio Nacional de Luz
Sı
´
ncrotron, CP 6192, Campinas SP, 13084-
971 Brazil
Fax: +55 19 3287 7110
Tel: +55 19 3287 4520
E-mail:
*These authors contributed equally to this
work.
†Present address
Instituto de Quı
´
mica, Universidade Estadual
de Campinas, Campinas SP, Brazil
(Received 19 October 2004, revised 24
November 2004, accepted 6 December
2004)
doi:10.1111/j.1742-4658.2004.04515.x
The troponin (Tn) complex is formed by TnC, TnI and TnT and is respon-
sible for the calcium-dependent inhibition of muscle contraction. TnC and
TnI interact in an antiparallel fashion in which the N domain of TnC binds
in a calcium-dependent manner to the C domain of TnI, releasing the
inhibitory effect of the latter on the actomyosin interaction. While the crys-
tal structure of the core cardiac muscle troponin complex has been deter-
mined, very little high resolution information is available regarding the
skeletal muscle TnI–TnC complex. With the aim of obtaining structural
information regarding specific contacts between skeletal muscle TnC and
TnI regulatory domains, we have constructed two recombinant chimeric
proteins composed of the residues 1–91 of TnC linked to residues 98–182
or 98–147 of TnI. The polypeptides were capable of binding to the thin
filament in a calcium-dependent manner and to regulate the ATPase reac-
tion of actomyosin. Small angle X-ray scattering results showed that these
chimeras fold into compact structures in which the inhibitory plus the C
domain of TnI, with the exception of residues 148–182, were in close con-
tact with the N-terminal domain of TnC. CD and fluorescence analysis
were consistent with the view that the last residues of TnI (148–182) are
not well folded in the complex. MS analysis of fragments produced by lim-
ited trypsinolysis showed that the whole TnC N domain was resistant to
proteolysis, both in the presence and in the absence of calcium. On the
other hand the TnI inhibitory and C-terminal domains were completely
digested by trypsin in the absence of calcium while the addition of calcium
results in the protection of only residues 114–137.
Abbreviations
c, cardiac; GdmCl, guanidinium chloride; MM, molecular mass; SAXS, small angle X-ray scattering; TnC(1–91), N-terminus domain of TnC
composed of residues 1–91; TnI(98–182), TnI inhibitory and C-terminal domains, residues 98–182; TnI(98–147), TnI(98–182) deleted of
residues 148–182; TnC(1–91)–TnI(98–182), chimeric single-chain protein formed by TnC(1–91), a GGAGG linker and TnI(98–182); TnC(1–91)–
TnI(98–147), chimeric single-chain protein formed by TnC(1–91), a GGAGG linker, and TnI(98–147); Tn, troponin.
FEBS Journal 272 (2005) 779–790 ª 2005 FEBS 779
TnC is dumbbell-shaped protein with two globular
domains, each composed of two EF-hand calcium
binding motifs, which are connected by an exten-
ded a-helix [6]. Under physiological conditions, the
C-terminal domain is expected to be saturated with
calcium ions, whereas calcium binding to the
low-affinity sites at the N-terminal domain (residues
1–91) triggers muscle contraction [7]. The isolated N
and C domains of TnC maintain their structural and
functional characteristics [8] and calcium binding to
N domain of TnC causes a conformational change
that exposes a binding site for interaction with TnI
[9]. The isolated domains of TnI were also investi-
gated by studying N and C termini deletion mutants
of TnI [10] showing that the C terminus of TnI (res-
idues 117–182), when linked to the inhibitory region,
has the major regulatory function of the molecule.
The studies of isolated domains lead to the conclu-
sions that the interaction between TnC and TnI is
antiparallel [10], and that the inhibitory region and
the region between residues 117 and 148 are involved
in the binding to N domain of TnC [11–16]. Serial
deletion studies of the C terminus of TnI showed
that residues 166–182 are involved in binding to the
thin filament [16]. Altogether, these studies showed
that the TnC(1–91) and TnI(98–182) form a regula-
tory subunit, and that the first half of the C termi-
nus of TnI is important for this binding.
Structural information of the interaction of TnC
and TnI were firstly provided by low-resolution scat-
tering studies [17,18] showing that the C terminus of
TnI has a tubular-like conformation that involves the
globular N domain of TnC. NMR studies have provi-
ded additional information on the structure of skeletal
TnC(1–91) in the presence of TnI inhibitory peptide
and residues 117–148 [19], and in the presence of TnI
residues 115–131 [12]. However, high resolution infor-
mation on the skeletal TnI(98–182) in solution has
proven difficult to obtain. Recently, Takeda et al. [20]
presented the high-resolution structure of the calcium-
saturated human cTn. Although this structural resolu-
tion took us a step closer to understanding the action
of troponin, some portions of the inhibitory and C-ter-
minal domains of TnI are lacking in this model and
more structural information is necessary for full com-
prehension of Tn function.
To investigate the interactions between skeletal mus-
cle TnC(1 –91) and TnI(98–182), we have constructed
two single chain chimeras composed of these domains.
The chimeras were formed by residues 1–91 of TnC
and residues 98–182 or 98–147 of TnI, connected by a
GlyGlyAlaGlyGly linker. The obligatory 1 : 1
TnC ⁄ TnI stoichiometry provided by these single-chain
chimeras facilitated their conformational analysis by
a variety of methods including SAXS, MS and pro-
teolysis.
Results
Expression, purification, and initial
conformational analyses
The chimeric gene encodes a single chain polypeptide
that has residues 1–91 of TnC in its N terminus, a
GGAGG linker, and then residues 98–182 of TnI for
TnC(1–91)–TnI(98–182) or 98–147 for TnC(1–91)–
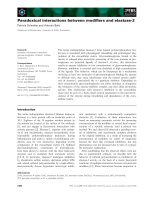
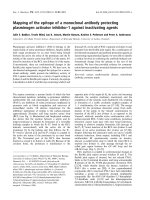
TnI(98–147) (Fig. 1A). The two chimeras were
expressed in Escherichia coli and purified in soluble
state (Fig. 1B). The purified chimeras showed no sign
A
B
Fig. 1. (A) Amino acid sequence of the chimeras TnC(1–91)–TnI(98–
182) and TnC(1–91)–TnI(98–147). The chimeras are composed from
TnC residues 1–91, followed by a GGAGG linker followed by resi-
dues 98–182 or 98–147 of TnI. The GGAGG linker is shown in low-
ercase and the Trp residue is shown in italic. The TnI sequence
that is deleted in the chimera TnC(1–91)–TnI(98–147) is shown
underlined. (B) SDS ⁄ PAGE 15%. Lane 1, bacterial pellet before
induction; lane 2, bacterial pellet of TnC(1–91)–TnI(98–182) after 4 h
of induction; lane 3, TnC(1–91)–TnI(98–182) after purification; lane
4, bacterial pellet of TnC(1–91)–TnI(98–147) after 4 h of induction;
lane 5, TnC(1–91)–TnI(98–147) after purification; lane 6, Molecular
mass markers.
Contacts between skeletal TnC and TnI regulatory domains A. O. Tiroli et al.
780 FEBS Journal 272 (2005) 779–790 ª 2005 FEBS
of impurities or degradation, were soluble even in pure
water and folded (see below). The folded state of the
two chimeras was investigated by CD spectroscopy
(Fig. 2A and Table 1). The CD spectra of the two chi-
meras were very similar (Fig. 2A) and did not vary sig-
nificantly upon the addition of calcium (data not
shown). TnI has a Trp residue at position 160 that is
maintained in the chimera TnC(1–91)–TnI(98–182) and
emission fluorescence spectroscopy was used to observe
the environment of this residue. The emission fluores-
cence spectrum indicated that the W160 was exposed
to the solvent as confirmed by the maximum intensity
wavelength of 343 nm and emission fluorescence centre
of mass at 351 nm (Fig. 2B and Table 1). There were
no relevant differences in the emission fluorescence
spectra of TnC(1–91)–TnI(98–182) in the absence or in
the presence of calcium (Table 1), and the addition of
the denaturant guanidinium chloride (GdmCl) caused
only a very small red shift in the emission spectrum
(Fig. 2B and Table 1).
Functional analyses
The functional characteristics of the chimeras were
analysed by cosedimentation with actin and tropomyo-
sin followed by SDS ⁄ PAGE, and by their ability to
regulate the ATPase activity of actomyosin. Both
experiments were performed in the absence and in the
presence of calcium and the results are described in
Table 1. The TnC(1–91)–TnI(98–182) chimera cosedi-
mented with actin–tropomyosin and inhibited about
48% of the actomyosin ATPase activity in the absence
of calcium (Table 1). In the presence of calcium,
TnC(1–91)–TnI(98–182) did not cosediment with
actin–tropomyosin and did not inhibit the ATPase
activity of actomyosin (Table 1). In the absence of cal-
cium, the TnC(1–91)–TnI(98–147) chimera had a lower
cosedimentation with actin–tropomyosin when com-
pared to TnC(1–91)–TnI(98–182) and inhibited about
35% of the actomyosin ATPase activity (Table 1).
TnC(1–91)–TnI(98–147) did not inhibit the actomyosin
ATPase activity nor did it cosediment with actin–tropo-
myosin in the presence of calcium. These results indica-
ted that the chimeras presented functional properties
similar to that of the TnC–TnI complex [10].
Limited proteolysis and MS analyses
The tryptic peptides generated by the lysis of TnC(1–
91)–TnI(98–147) with trypsin were analysed by MS
(Fig. 3). No peptides from the TnC(1–91) portion were
released in the presence or in the absence of calcium
not even after 24 h incubation at 37 °C, confirming the
high stability of this domain [21]. The TnI(98–147)
portion was completely digested even at 4 °C in the
absence of calcium and peptides corresponding to
regions 99–103 (m ⁄ z ¼ 664, LFDLR), 108–112 (m ⁄ z ¼
639, RPPLR), 116–123 (m ⁄ z ¼ 895, MSADAMLR),
124–129 (m ⁄ z ¼ 589, ALLGSK), 132–137 (m ⁄ z ¼ 747,
VNMDLR), and 138–141 (m ⁄ z ¼ 445, ANLK) were
identified (Fig. 3A,B). When the trypsinolysis reaction
was performed in the presence of calcium, the follow-
ing peptides derived from the TnI(98–147) portion of
the chimera, 116–123 (m ⁄ z ¼ 895, MSADAMLR),
124–129 (m ⁄ z ¼ 589, ALLGSK), and 132–137 (m ⁄ z ¼
747, VNMDLR), were not identified even after up
to 45 min of reaction. Instead, a molecular ion
(m ⁄ z ¼ 2712) that corresponds to the region 114–
137 (VRMSADAMLRALLGSKHKVNMDLR) was
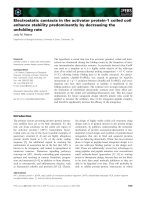
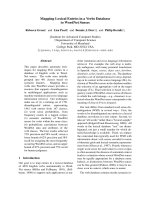
Fig. 2. (A) CD spectra of TnC(1–91)–TnI(98–182) (solid line) and of
TnC(1–91)–TnI(98–147) (dashed line). The spectra in the presence
or in the absence of calcium are indistinguishable (data not shown).
The spectra of TnC(1–91)–TnI(98–182) and TnC(1–91)–TnI(98–147)
are characteristic of a-helical proteins. (B) Fluorescence spectra of
TnC(1–91)–TnI(98–182) in the absence (solid line) and in the pres-
ence (dashed line) of GdmCl. The fluorescence spectrum of TnC(1–
91)–TnI(98–182) is characteristic of a solvent exposed tryptophan.
A. O. Tiroli et al. Contacts between skeletal TnC and TnI regulatory domains
FEBS Journal 272 (2005) 779–790 ª 2005 FEBS 781
observed (Fig. 3C). However, after 60 min of lysis, the
large fragment was no longer present and the smaller
peptides appeared (data not shown). The chimera
TnC(1–91)–TnI(98–182) had the same behaviour as the
chimera TnC(1–91)–TnI(98–147).
Small angle X-ray scattering experiments
SAXS measurements were performed for TnC(1–91),
TnC(1–91)–TnI(98–182), and TnC(1–91)–TnI(98–147).
The experiments were performed in the presence and
in the absence of calcium, which gave undistinguish-
able results (Table 1). The experimental intensity
data as a function of the modulus of the scattering
vector q are shown for TnC(1–91)–TnI(98–182)
(Fig. 4A) and TnC(1–91)–TnI(98–147) (Fig. 4B). The
value of the radius of gyration obtained for TnC(1–
91)–TnI(98–182) was 30 ± 2 A
˚
with a maximum
dimension of 110 A
˚
(Fig. 4A and Table 1). For
the protein TnC(1–91)–TnI(98–147) the calculated
Table 1. Chimeras biophysical and functional parameters. The errors are < 4%.
TnC(1–91)–TnI(98–182)
(– calcium)
TnC(1–91)–TnI(98–182)
(+ calcium)
TnC(1–91)–TnI(98–147)
(– calcium)
TnC(1–91)–TnI(98–147)
(+ calcium)
CD at 222 nm
(deg.cm
)2
Ædmol
)1
)
)9300 )9450 )8800 )8850
Emission fluorescence
k
Max
a
(nm)
343 343 – –
Emission fluorescence
Mass centre
a
(nm)
351 351 – –
Bind to the thin filament
b
++ No + No
Actomyosin ATPase activity (%) 52
c
100 65
c
100
Radius of gyration
d
(A
˚
)30302323
a
In the presence of GdmCl, k
Max
¼ 347 nm and mass centre ¼ 353 nm.
b
++, Strong binding; + weak binding [16].
c
The actomyosin
ATPase activity in the presence of the binary complex formed by TnI and TnC and in the absence of calcium is 40% [10,16].
d
Measured
by SAXS.
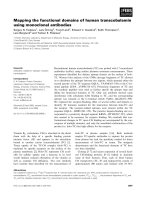
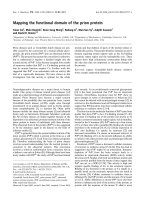
Fig. 3. (A) Amino acid sequence of TnC(1–91)–TnI(98–147) showing in bold the fragments that were digested with trypsin in the absence of
calcium. (B) Mass spectra of digested TnC(1–91)–TnI(98–147) apo protein after 15 min treatment with trypsin at 4 °C. The peptic fragments
identified by MALDI-TOF-MS were: 99–103 (m ⁄ z ¼ 664, LFDLR), 108–112 (m ⁄ z ¼ 639, RPPLR), 116–123 (m ⁄ z ¼ 895, MSADAMLR), 124–
129 (m ⁄ z ¼ 588, ALLGSK), 132–137 (m ⁄ z ¼ 747, VNMDLR) and 138–141 (m ⁄ z ¼ 445, ANLK). (C) Mass spectrum of digested holo protein
after 15-min treatment with trypsin at 4 °C. A peptide corresponding to residues 114–137 (m ⁄ z ¼ 2712, VRMSADAMLRALLG
SKHKVNMDLR) was identified. Therefore, the peptides 116–123 (m ⁄ z ¼ 895, MSADAMLR), 124–129 (m ⁄ z ¼ 589, ALLGSK) and 132–137
(m ⁄ z ¼ 747, VNMDLR) were protected from trypsin digestion in the presence of calcium.
Contacts between skeletal TnC and TnI regulatory domains A. O. Tiroli et al.
782 FEBS Journal 272 (2005) 779–790 ª 2005 FEBS
radius of gyration was 23 ± 2 A
˚
and the maximum
dimension 90 A
˚
(Fig. 4B and Table 1). As expec-
ted, the chimera TnC(1–91)–TnI(98–147) was smaller
than the chimera TnC(1–91)–TnI(98–182). In both
cases the p(r) function indicated an elongated (pro-
late) shape for the protein conformation. The general
behaviour for the p(r) function was similar for the
two proteins, and the major differences occur for
large r-values. The differences in size and radius of
gyration indicated that the portion missing in the
chimera TnC(1–91)–TnI(98–147) did not occupy a
central part in the structure of protein TnC(1–91)–
TnI(98–182), but was probably located near one of
the extremities. As showed in Fig. 4C, the Kratky
plots suggested the presence of some flexible domains
for both TnC(1–91)–TnI(98–182) and TnC(1–91)–
TnI(98–147). Due to the large homology between the
sequences of these chimeras, we also expected a
marked similarity in the structures. This was parti-
ally indicated by the general shape of the p(r) func-
tions (Fig. 4A,B), where the maximum of the curves
had approximately the same value in both cases and
by the Kratky plot that showed similarity in the
flexibility of the structures of the two proteins
(Fig. 4C).
SAXS modelling
The Fig. 5A shows the high-resolution structure of the
TnC(1–91) (1SKT) as well as an ab initio model calcu-
lated from SAXS experimental data of the TnC(1–91)
protein in solution. Ten independent models were aver-
aged using the gasbor program, which uses the same
principles as the chadd program but the simulated
dummy backbone corresponds to the whole protein.
This additional experiment and the corresponding
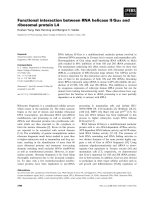
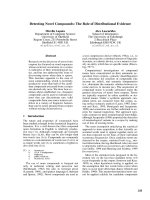
Fig. 4. (A) TnC(1–91)–TnI(98–182) experimental data and GNOM fitting. Inset: pair distance distribution function p(r). The experimental values
for D
max
and R
g
, 110 A
˚
and 30 A
˚
, respectively, suggest that the protein is elongated. (B) TnC(1–91)–TnI(98–147) experimental data and GNOM
fitting. Inset: pair distance distribution function p(r). D
max
and R
g
,90A
˚
and 23 A
˚
, respectively, suggest that this protein is also elongated but
smaller than TnC(1–91)–TnI(98–182). (C) Kratky plots for both proteins. This plot suggests that the proteins have flexible chains in solution.
A. O. Tiroli et al. Contacts between skeletal TnC and TnI regulatory domains
FEBS Journal 272 (2005) 779–790 ª 2005 FEBS 783
calculation were carried out to confirm that the crys-
tallographic structure of the TnC(1–91) corresponded
to its high-resolution structure. The correspondence
was also confirmed by the perfect fit of the TnC(1–91)
experimental data using the program crysol [22] with
the TnC(1–91) NMR structure (1SKT) as an input to
this program. The models shown in Fig. 5B corres-
pond to the most probable solution structure obtained
for TnC(1–91)–TnI(98–182) and TnC(1–91)–TnI(98–
147) from the averaging process using spheres with
packing radius of 1.5 A
˚
. Both models had prolate
conformations and the positions of TnC(1–91) and
TnI(98–182) were located. To compare the models,
they were superimposed as shown in Fig. 5C. The sem-
itransparent spheres correspond to the most probable
model configuration for TnC(1–91)–TnI(98–182) and
the solid spheres to TnC(1–91)–TnI(98–147). From this
comparison the deleted portion of TnI becomes appar-
ent. Finally, from the superimposed models presented
in Fig. 5 we observe that: (a) the globular part repre-
sents the TnC(1–91); (b) the tube-like structure extend-
ing from the globule common to both chimeras,
represents the TnI(98-147) component; and (c) the sec-
ond tube-like structure that is present only in TnC(1–
91)–TnI(98–182) represents the region 148–182 of TnI.
As a final check of the model building from SAXS
data, we performed hydrodynamic calculations using
the program hydropro to obtain the volume of the
models [23,24]. It is interesting to compare the pairs of
ratios: (a) V[model-TnC(1–91)–TnI(98–182)] ⁄ V(1SKT)
and MM[TnC(1–91)–TnI(98–182)] ⁄ MM(1SKT); (b)
V[model-TnC(1–91)–TnI(98–147)] ⁄ V(1SKT) and MM
[TnC(1–91)–TnI(98–147)] ⁄ mm(1SKT); and (c) V[model-
TnC(1–91)–TnI(98–182)] ⁄ V(model- TnC(1–91) –TnI(98–
147)] and MM[TnC(1–91)–TnI(98–182)] ⁄ mm[TnC
(1–91)–TnI(98–147)]. If the modelling is correct, these
ratios should give similar values. The hydrodynamic
calculations for the models were performed using a
subunit radius of 5.36 A
˚
. This value was estimated so
that the CA backbone model will furnish the correct
hydrodynamic values of the real protein. For the cal-
culation of the TnC(1–91) (1SKT) hydrodynamic val-
ues we used a subunit radius of 3.1 A
˚
as recommended
in the hydropro program. Table 2 lists the above
ratios and shows that we find similar values for all the
structures compared, indicating that the models cor-
rectly retrieve the volume ratios.
Discussion
The chimeras were folded and functional
Protein engineering the connection of two or more
protein units to create a single polypeptide chain is a
powerful alternative model to investigate the protein
characteristics. Among the diverse past examples of
the application of this approach are the linking of
monomers into dimers [25], the identification of essen-
tial functional regions in homologous proteins [26], the
production of attached protein-reporters to facilitate
purification or the investigation of activity [27], the
creation of antibody chimeras [28], and the study of
A
B
C
Fig. 5. (A) High-resolution structure of the TnC(1–91) (1SKT) as well
as an ab initio model calculated from SAXS experimental data of
the protein in solution. The low-resolution structure of the TnC(1–
91) corresponded to its high-resolution structure. (B) The models
correspond to the most probable solution structure obtained for
TnC(1–91)–TnI(98–182) and TnC(1–91)–TnI(98–147) from the avera-
ging process using spheres with packing radius of 1.5 A
˚
. Both
models had prolate conformation and the position of the TnC(1–91)
and TnI(98–182) were located. (C) The models of TnC(1–91)–
TnI(98–182) (semitransparent spheres) and TnC(1–91)–TnI(98–147)
(solid spheres) were superimposed. From this comparison it was
easy to locate the portion corresponding to residues 148–182 of
TnI.
Table 2. The ratios of the volumes (V) of the models built by SAXS and of the structure of TnC(1–91) (1SKT) are compared with their
molecular mass (MM) ratios.
Volume comparison Molecular mass comparison
V[model-TnC(1–91)–TnI(98–182)] ⁄ V(1SKT) 2.0 ± 0.2 MM[TnC(1–91)–TnI(98–182)] ⁄
MM(1SKT) 2.0
V[model-TnC(1–91)–TnI(98–147)] ⁄ V(1SKT) 1.6 ± 0.2 MM[TnC(1–91)–TnI(98–147)] ⁄
MM(1SKT) 1.6
V[model-TnC(1–91)–TnI(98–182)] ⁄ V
(model-TnC(1–91)–TnI(98–147)
1.3 ± 0.1 MM[TnC(1–91)–TnI(98–182)] ⁄
MM[TnC(1–91)–TnI(98–147)] 1.3
Contacts between skeletal TnC and TnI regulatory domains A. O. Tiroli et al.
784 FEBS Journal 272 (2005) 779–790 ª 2005 FEBS
protein–protein interactions [29,30]. The study of TnI
separated from other components of the Tn complex
has always been difficult due to its low solubility,
which increases only in the presence of the TnC. In
order to improve the solubility of TnI and to guaran-
tee a 1 : 1 stoichiometry of TnI ⁄ TnC we created two
single chain chimeras that mimic the regulatory
domain of the TnI–TnC binary complex.
CD analysis of the purified chimeric proteins indica-
ted that they fold into predominantly a-helical confor-
mations. TnC and the residues corresponding to the
skeletal TnI 117–160 in cTnI have high a-helical con-
tent [6,20]. The chimeras had functional similarity with
the experiments performed with truncated TnC(1–91)
and TnI(98–182) or TnI(1–147) not covalently connec-
ted by peptide bond [10,16]. The TnC(1–91)–TnI(98–
182) chimera was able to bind and to regulate the
actomyosin ATPase activity in a manner similar to the
TnC–TnI complex. The TnC(1–91)–TnI(98–147) chi-
mera showed lower binding affinity as well as lower
ability to regulate the actomyosin ATPase activity
when compared to the larger chimera. These results
are similar with the results observed for the binary
complexes formed by TnC(1–91) and TnI(1–147), and
TnC and TnI [16] and agree with the hypothesis that
the entire C terminus of the TnI is important for the
regulation of the actomyosin ATPase activity [10,16].
Defining the TnI region that binds to TnC(1)91)
Several studies have shown that the TnI region
between residue 98 and residue 148 is involved in the
interaction with the N domain of TnC upon calcium
ion binding [10,15,16]. However, the true extension of
this region, the residues involved, and the events that
occur upon calcium binding are poorly defined. With
the aim of mapping these subregions and the residues
involved, we have created two chimera proteins that
have single-chain, TnC(1–91) and TnI(98–182) or
TnC(1–91) and TnI(98–147).
The compactness of the structures of TnC(1–91)–
TnI(98–182) and TnC(1–91)–TnI(98–147) obtained
from SAXS experiments are in agreement with a close
localization of the N domain of TnC and the first half
of the C terminus of TnI. The sensitivity to degrada-
tion by proteases is related to the conformational flexi-
bility of the protein substrate [31], and we can assume
that the VRMSADAMLRALLGSKHKVNMDLR
region (114–137) of TnI interacts, in the presence of
calcium, with the TnC
1)91
fragment in a specific man-
ner that protects it from digestion. There are several
lines of evidence that this is the TnI region involved in
the binding in the N domain of TnC. TnC can be
cross-linked to residues 113–145 of TnI [11]. Pearlstone
et al. [13] using a recombinant fragment of TnI con-
taining residues 96–148 showed that residues 117–148
are responsible for binding the N domain of TnC.
Takeda et al. [14] used limited proteolysis to show that
residues 117–134 of TnI are involved in the binding of
TnC in the presence of calcium. Tripet et al. [15]
showed that mutations in the region 115–131 of TnI
affects its binding to TnC. Ramos [16] showed that
deletion mutants TnI(1–147) and TnI(1–136) exhibit
similar binding to the N domain of TnC as wild-type
TnI in the presence of calcium, however, further dele-
tions [TnI(1–129) and TnI(1–116)] decrease this bind-
ing. Li et al. [32] used a cross-linking to show that the
residue 117 of TnI is localized near the helices B and
C of TnC in the presence of calcium and moves away
from them when calcium is present. Recent work has
demonstrated that the emission fluorescence of a probe
at position 121 in TnI is sensitive to calcium binding
to the N domain of TnC [33]. The crystal structure of
cTn [20] showed that residues R117 to L128 of TnI (in
chicken fast skeletal numbers) are in close contact with
the N domain of TnC in the presence of calcium.
These findings from other studies reinforce our obser-
vation that residues 114–137 are in fact involved in the
interaction with calcium-loaded TnC.
Structural insights on the region comprising
the last residues of TnI
Little is known about the structure of the last 20 resi-
dues in the C terminus of the TnI, probably because it
lacks a rigid structure. The a-helical content was very
similar for both chimeras and the emission fluorescence
spectrum of Trp160 in TnC(1–91)–TnI(98–182) corres-
ponds to the spectrum of a solvent exposed residue as
shown for TnI by Lakowicz et al. [34], results which
are probably due to the lack of a stable secondary
structure in residues 148–182 of TnI. The comparison
of the models generated by SAXS for TnC(1–91)–
TnI(98–182) and TnC(1–91)–TnI(98–147) were inform-
ative about the position of the last residues (148–182)
of the TnI. The chimera TnC(1–91)–TnI(98–182) had a
large portion that was not in contact with TnC(1–91).
Because this structure is lacking in the SAXS structure
of TnC(1–91)–TnI(98–147), we can assume that this
region corresponds to residues 148–182 of TnI. The
last residues of cTnI are missing in the crystallographic
structure [20] indication a badly folded or highly
dynamic conformation in this region.
Therefore, the results obtained from CD, fluores-
cence, and SAXS indicated a model in which the last
residues of TnI do not interact with TnC. We suggest
A. O. Tiroli et al. Contacts between skeletal TnC and TnI regulatory domains
FEBS Journal 272 (2005) 779–790 ª 2005 FEBS 785
that the main function of this region is likely to be the
binding to the thin filament and not to TnC. This
hypothesis is in agreement with previous works.
Takeda et al. [14] used limited proteolysis to show that
residues 141–181 of TnI are involved in the binding to
the thin filament. The deletion of the region compri-
sing the last residues of TnI (166–182) decreases the
inhibitory capacity of TnI [16]. Takeda et al. [20]
showed that the residues G129–W160 (in chicken fast
skeletal numbers) seem to be away from TnC. This
structural arrangement would favour an interaction of
residues 166–182 of TnI with the thin filament. When
calcium is bound to TnC, the interaction with region
114–137 of TnI could facilitate the dissociation of
region 166–182 of TnI from the thin filament.
Final comments
With the results presented in this work, combined with
others available in the literature, we suggest a model
for the structure of TnI and TnC that can explain
how they interact during muscle contraction. Figure 6
shows a schematic representation of the structural dis-
position of TnC and TnI in the light of recent results
from our group and others. The N terminus of TnI is
displaced around the C domain of TnC [17,18,20]. The
inhibitory region is positioned in a way that it can
interact with both the N and the C domains of TnC
(as suggested by the work of Farah et al. [10]). The
region between residues 114 and 148 is localized near
to the N domain of TnC and binds to it (this work).
The region comprising the last residues of TnI is dis-
posed away from TnC (this work) in such a way that
facilitates its binding to the thin filament [16]. In this
model (Fig. 6), the hydrophobic pocket opened upon
calcium ion binding to the NTnC binds the residues
114–137 of TnI. This binding removes the inhibitory
region and the last residues of TnI away from the thin
filament allowing muscle contraction [5,10,16]. Crystal-
lization experiments are in progress, and we hope that
solving the structure at the atomic level of the chime-
ras studied here will lead to the identification of the
functional domain of TnC and TnI, as well as com-
plement the crystal structure of the entire troponin
complex.
Experimental procedures
Site-directed mutagenesis
The cDNAs of TnC and TnI were previously described [16]
and the plasmid constructs for expression of the TnC–TnI
chimeras were produced by PCR-based site-directed muta-
genesis in two steps. For the first PCR using TnC cDNA
template, the forward TnC oligo 5¢-GATATACATAT
GGCGTCA-3¢ contains an NdeI site and an initiation
codon and the reverse TnC oligo 5¢-GCTCCTCCTCGCC
GGCGCCCCCGGCGTCCTC-3¢ contains the codons for
the two glycines and one alanine plus an NgoMIV restric-
tion enzyme site placed after the Ala91 codon of TnC. For
the second PCR, using the TnI cDNA template, the for-
ward oligo 5¢-GAGCTGGAGGACGCCGGCGGGAAG
CTGTTTG-3¢ contains an NgoMIV restriction enzyme site
plus the codons for two glycines before the codon for
Lys98 of the TnI and the reverse TnI oligo 5¢-CCCGG
ATCCTTAGGACTCCCCGGCCTC-3¢ contains a BamHI
restriction enzyme site after the stop codon, and can be
used for either TnI and TnI(1–147) templates [16]. The
PCR products were digested with NgoMIV and ligated.
This procedure resulted in the DNA sequence of TnC(1–91)
connected to the DNA sequence of TnI(98–182) or TnI(98–
147) by a nucleotide sequence coding for a GlyGlyAlaGly-
Gly linker. The PCR products, TnC(1–91)–TnI(98–182)
and TnC(1–91)–TnI(98–147), were cloned into pET3a vec-
tor digested with NdeI and BamHI creating the respective
vectors pET3aTnC(1–91)–TnI(98–182) and pET3aTnC(1–
91)–TnI(98–147). The constructs were confirmed by DNA
sequencing.
Protein purification
The pET3aTnC(1–91)–TnI(98–182) and pET3aTnC(1–91)–
TnI(98–147) vectors were transformed in E. coli strain
Fig. 6. Model structure of the interaction between TnC and TnI
based on the SAXS model and in the tryptic peptides analyses in
this work and on the information available in previous works. See
Discussion for details.
Contacts between skeletal TnC and TnI regulatory domains A. O. Tiroli et al.
786 FEBS Journal 272 (2005) 779–790 ª 2005 FEBS
BL21(DE3)pLysS and expressed by adding 100 mmÆL
)1
of
lactose at D
600
¼ 0.8. The induced cells were grown over-
night and harvested by centrifugation for 15 min at 2600 g.
The purification method was the same for both chimeric
proteins. The bacterial pellet was suspended in 100 mm
acetate buffer, pH 5.0, 8 m urea, 1 mm CaCl
2
, and cells
were lysed by French PressÒ followed by centrifugation for
15 min at 12 000 g,4°C. The supernatant was ultracentri-
fuged for 60 min at 80 000 g at 4 °C in a Beckman TL100
ultracentrifuge, rotor TLA120.1 (Palo Alto, CA, USA) and
a large amount of contaminants was precipitated. The
supernatant of this step was dialysed overnight at 4 °Cin
the buffer described above without urea. After the dialyses,
the suspension was centrifuged for 15 min at 12 000 g and
4 °C, and the soluble fraction was loaded into a DEAE–
Sepharose column (Pharmacia, Uppsala, Sweden) equili-
brated with 100 mm acetate buffer, pH 5.0, and 1 mm
CaCl
2
. The column was washed twice with the buffer, and
then, a linear gradient of NaCl was applied. The TnC(1–
91)–TnI(98–147) was eluted in the flow-through, while the
TnC(1–91)–TnI(98–182) was eluted with 120 mm NaCl.
The concentrations of the proteins were calculated by the
BCA Protein Assay Kit (Pierce, Rockford, IL, USA). The
production of TnC(1–91) was performed as previously des-
cribed [16]. The calculated MS molecular masses were iden-
tical within the error margin to the expected molecular
masses from the amino acid sequences of the chimeras
[20363 for TnC(1–91)–TnI(98–182) and 16267 for TnC(1–
91)–TnI(98–147)].
Spectroscopic experiments
CD measurements were taken using a Jasco J-810 spectro-
polarimeter (Tokyo, Japan) with temperature controlled by
Peltier Type Control System PFD 4255. The CD spectra
were taken in cuvettes of 1 cm pathlength using 4 lm pro-
tein in 0.5 mm Hepes buffer pH 7.0, 1 mm CaCl
2
for the
experiments in the presence of calcium or 1 mm EDTA for
the experiments in the absence of calcium at 20 °C. CD
measurements were taken with scan speed of 50 nmÆmin
)1
from 200 to 260 nm. Fluorescence measurements were
made in an SLM AB2 spectrofluorimeter using a 1 · 1cm
pathlength cuvette, using the same conditions as in the CD
experiments, with excitation at 280 nm and a bandpass of
8 nm, and emission at 320 nm with a bandpass of 8 nm.
All spectra were baseline corrected with the buffer and were
the means of at least three independent experiments.
ATPase activity and actin-binding experiments
The measurements of the actomyosin Mg
2+
-ATPase activ-
ity and binding to actin were performed as previously des-
cribed [10,16]. Briefly, actin (7 lm), tropomyosin (2 lm),
myosin (0.4 lm ), and chimeras (7 lm) were combined on
ice in 25 mm Mops ⁄ HCl pH 7.0, 50 mm NaCl, 5 mm
MgCl
2
,1mm dithiothreitol, 1 mm EGTA for the experi-
ments in the absence of calcium or 1 mm CaCl
2
for the
experiments in the presence of calcium. ATP (2 mm) was
added and the mixture incubated at 25 °C for 60 min, after
which phosphate was determined [35]. Co-sedimentation
experiments were performed using 7 lm actin, 2 lm tropo-
myosin, 7 lm chimera, diluted in 20 mm imidazole ⁄ HCl
pH 7.0, 200 mm NaCl, 25 mm 2-mercaptoethanol, 1 mm
EGTA for the experiments in the absence of calcium or
1mm CaCl
2
for the experiments in the presence of calcium.
Mixtures were centrifuged at 80 000 g ,25°C, for 15 min in
a Beckman TL100 ultracentrifuge. Samples collected before
and after centrifugation were analysed by SDS ⁄ PAGE.
Limited proteolysis and MALDI-TOF-MS
In the proteolysis experiments, 2 lgÆ mL
)1
of the lyophi-
lized chimera was dissolved in 10 mm ammonium bicar-
bonate solution pH 8.0, with the addition of 1 mm EDTA
for the experiments in the absence of calcium or 1 m m
CaCl
2
for the experiments in the presence of calcium. The
lysis experiments were performed with 0.1 lgÆmL
)1
trypsin
(Sigma, St. Louis, MO, USA) at 37 °Corat4°C and
stopped by addition of a freshly prepared CHCA matrix
solution (10 mgÆmL
)1
,H
2
O ⁄ acetonitril ⁄ trifluoroacetic acid
(3%) ¼ 4 ⁄ 5 ⁄ 1, v ⁄ v ⁄ v) in time intervals of: 0, 15, 30, 45,
60, 120 and 180 min, and 24 h. The dried-doplet technique
was used for MALDI-ToF-MS sample preparation. The
mass spectra were recorded in both linear and reflection
modes using a 4700 Proteomics Analyser (Applied Biosys-
tems, Foster City, CA, USA) and mass ranges from m ⁄ z
400 to m ⁄ z 30 000 were observed. Each measurement con-
sisted of 8–12 spectra, and the peptides were identified by
their monoisotopic masses.
Small angle X-ray scattering experiments
Experiments were performed at the SAXS beamline of the
Laborato
´
rio Nacional de Luz Sı
´
ncrotron (LNLS) in Camp-
inas, Brazil. The monochromatic beam was tuned at
8.33 KeV and the experimental setup included a tempera-
ture-controlled, 1 mm-thick sample cell with mica windows,
and a linear position-sensitive detector. The samples at con-
centrations of 4–8 mgÆmL
)1
and in the same buffer condi-
tions described for CD measurements were kept at 20 °C
during the exposures and data acquisition was performed
by taking five 900 s frames for each sample, allowing con-
trol of any possible radiation damage. The sample to detec-
tor distance was 445 mm, which enabled detection of a q
range [q ¼ (4p ⁄ L)sin(h), k ¼ wavelength and 2h ¼ scatter-
ing angle] equal to 0.025ÆA
˚
)1
< q < 0.25ÆA
˚
)1
. Data ana-
lysis of the scattering intensities was performed using the
software package trat1d [36] using the usual correction
for detector homogeneity, incident beam intensity, sample
absorption, blank subtraction and intensity averaging. Data
A. O. Tiroli et al. Contacts between skeletal TnC and TnI regulatory domains
FEBS Journal 272 (2005) 779–790 ª 2005 FEBS 787
analysis and model calculations were performed using the
computer programs gnom [37], gasbor [38], chadd [39],
and hydropro [40]. Curve-fitting and desmearing of the
experimental data was done using the gnom software pack-
age [37]. From the program fitted curve the inverse Fourier
transform from the scattering intensity was calculated. The
resulting pair distance distribution function p(r) went to
zero for the r-value corresponding to the particle maximum
dimension D
max
. The second moment of the p(r) function,
equal to the radius of gyration R
g
of the scattering particle,
was also calculated. We also calculated the so-called Kratky
plots (I.q
2
· q
2
) which give information on the compactness
of the protein structure. The Kratky plots show a well-
defined curve with an initial upward portion followed by a
descending bell-shaped curve for particles with compact
shape and without flexible domains, and a characteristic
plateau and a monotonic rise at higher angles for particles
with random coil conformation. Structured particles with
flexible domains will have a well-defined maximum but with
a descending curve that does not reach the horizontal
axis [41].
Ab initio calculations were performed to obtain model
structures. There are several methods for model calculations
[38,39,42] and the choice of the right method depends on the
experimental data. However, for all methods, the major
problem is that SAXS is a low-resolution and low-informa-
tion technique, which renders nonunique solutions. Increas-
ing the measured q-range and imposing some shape and ⁄ or
symmetry constraints can reduce the redundancy of the
models [17]. The information from the structure of TnC(1–
91) (1SKT) was used to produce domain structure models
from solution scattering data from TnC(1–91)–TnI(1–182)
and TnC(1–91)–TnI(98–147), following the strategies out-
lined by Petoukov and coworkers [39]. In this approach, the
polypeptide chains are represented by fictitious amino acid
residues centred at the Ca atomic positions. The separation
of the residues in the molecular structure is smaller than the
resolution of the scattering experiments ( 0.5 nm). Conse-
quently, the protein chains can be modelled as an assembly
of dummy residues. The program chadd was used to attach
a dummy backbone composed of the desired number of
dummy residues to the backbone of the TnC(1–91), at posi-
tion 91. In the case of the TnC(1–91)–TnI(98–182) model
simulation, the number of dummy residues attached was 90,
and for the TnC(1–91)–TnI(98–147) model simulation 55
dummy residues were attached. In the simulation process, a
grid of water atoms was placed around the model to mimic
the hydration layer of the protein in solution. Using a simu-
lated annealing optimization, the program searches the best
configuration of the attached backbone that gives the mini-
mum discrepancy between the calculated scattering intensity
from the ab initio model and the experimental SAXS data.
Using this methodology, the available search space for the
model configuration is reduced because of the constraints
imposed on its conformation, consequently reducing the
model redundancy. As a result of these calculations, the final
dummy backbone conformation represented the linker and
TnI components of the chimeras. In order to retrieve the
most probable configuration, an average of the ab initio
models was obtained using the program damaver [43]. In
this procedure the models were compared to each other by
the alignment program subcomp [44] and the models that
had higher similarity were averaged. The most probable con-
figuration was space-filled with a close packing of spheres.
In each case we calculated 10 independent models and we
found very good fits with v
2
< 0.7 (data not shown).
Acknowledgements
The authors thank the PEW Charitable Trust, the
Fundac¸ a
˜
o de Amparo a
`
Pesquisa do Estado de Sa
˜
o
Paulo (FAPESP), and the Conselho Nacional de
Desenvolvimento Cientı
´
fico e Tecnolo
´
gico (CNPq) for
financial support. A.O.T. is a CNPq fellow and L.T.
and C.L.P.O. are FAPESP fellows. We also thank Dr
A. Spisni for helpful discussions and the technical staff
at LNLS for valuable assistance.
References
1 Farah CS & Reinach FC (1995) The troponin complex
and regulation of muscle contraction. FASEB J 9, 755–
767.
2 Gordon AM, Homsher E & Regnier M (2000) Regula-
tion of contraction in striated muscle. Physiol Rev 80,
853–924.
3 Potter JD & Gergely J (1975) The calcium and magne-
sium binding sites on troponin and their role in the reg-
ulation of myofibrillar adenosine triphosphatase. J Biol
Chem 250, 4628–4633.
4 Zot HJ & Potter JD (1982) A structural role for the
Ca
2+
-Mg
2+
sites on troponin C in the regulation of
muscle contraction. Preparation and properties of tro-
ponin C depleted myofibrils. J Biol Chem 257, 7678–
7683.
5 Syska H, Wilkinson JM, Grand RJA & Perry SV (1976)
The relationship between biological activity and primary
structure of troponin I from white skeletal muscle of the
rabbit. Biochem J 153, 375–387.
6 Herzberg O & James MN (1985) Structure of the cal-
cium regulatory muscle protein troponin-C at 28 A
resolution. Nature 313, 653–659.
7 Johnson JD, Charlton SC & Potter JD (1979) A fluores-
cence stopped flow analysis of Ca
2+
exchange with
troponin C. J Biol Chem 254, 3497–3502.
8 Li MX, Chandra M, Pearlstone JR, Racher KI, Trigo-
Gonzalez G, Borgford T, Kay CM & Smillie LB (1994)
Properties of isolated recombinant N and C domains of
chicken troponin C. Biochemistry 33, 917–925.
Contacts between skeletal TnC and TnI regulatory domains A. O. Tiroli et al.
788 FEBS Journal 272 (2005) 779–790 ª 2005 FEBS
9 Gagne SM, Tsuda S, Li MX, Smillie LB & Sykes BD
(1995) Structures of the troponin C regulatory domains
in the apo and calcium- saturated states. Nat Struct Biol
2, 784–789.
10 Farah CS, Miyamoto CA, Ramos CHI, Silva ACR,
Quaggio RB, Fujimori K, Smillie LB & Reinach FC
(1994) Structural and regulatory functions of the NH2-
and COOH-terminal regions of skeletal muscle troponin
I. J Biol Chem 269, 5230–5240.
11 Kobayashi T, Tao T, Gergely J & Collins JH (1994)
Structure of the troponin complex. Implications of
photocross-linking of troponin I to troponin C thiol
mutants. J Biol Chem 269, 5725–5729.
12 McKay RT, Tripet BP, Hodges RS & Sykes BD (1997)
Interaction of the second binding region of troponin I
with the regulatory domain of skeletal muscle troponin
C as determined by NMR spectroscopy. J Biol Chem
272, 28494–28500.
13 Pearlstone JR, Sykes BD & Smillie LB (1997) Inter-
actions of structural C and regulatory N domains of
troponin C with repeated sequence motifs in troponin I.
Biochemistry 36, 7601–7606.
14 Takeda S, Kobayashi T, Taniguchi H, Hayashi H &
Maeda Y (1997) Structural and functional domains of
the troponin complex revealed by limited digestion. Eur
J Biochem 246, 611–617.
15 Tripet B, VanEik JE & Hodges RS (1997) Mapping of
a second actin-tropomyosin and a second troponin C
binding site within the C terminus of troponin I, and
their importance in the Ca
2+
-dependent regulation of
muscle contraction. J Mol Biol 271, 728–750.
16 Ramos CHI (1999) Mapping subdomains in the C-ter-
minal region of troponin I involved in its binding to
troponin C and to thin filament. J Biol Chem 274,
18189–18195.
17 Olah GA & Trewhella J (1994) A model structure of the
muscle protein complex 4Ca
2+
.troponin C.troponin I
derived from small-angle scattering data: implications
for regulation. Biochemistry 33, 12800–12806.
18 Stone DB, Timmins PA, Schneider DK, Krylova I,
Ramos CHI, Reinach FC & Mendelson RA (1998) The
effect of regulatory Ca2+ on the in situ structures of
troponin C and troponin I: a neutron scattering study.
J Mol Biol 281, 689–704.
19 McKay RT, Pearlstone JR, Corson DC, Gagne SM,
Smillie LB & Sykes BD (1998) Structure and interaction
site of the regulatory domain of troponin-C when com-
plexed with the 96–148 region of troponin-I. Biochemis-
try 37, 12419–12430.
20 Takeda S, Yamashita A, Maeda K & Maeda Y
(2003) Structure of the core domain of human cardiac
troponin in the Ca (2+)-saturated form. Nature 424,
35–41.
21 Ramos CHI, Lima MV Jr, Silva SL, Borin PFL, Re
´
gis
WCB & Santoro MM (2004) Stability and folding
studies of the N-domain of troponin C. Evidence for
the formation of an intermediate. Arch Biochem Biophys
427, 135–142.
22 Svergun DI, Barberato C & Koch MHJ (1995) CRY-
SOL: a program to evaluate X-ray solution scattering
of biological macromolecules from atomic coordinates.
J Appl Cryst 28, 768–773.
23 Gralle M, Botelho MM, Oliveira CLP, Torriani I &
Ferreira ST (2002) Solution studies and structural model
of the extracellular domain of human amyloid precursor
protein. Biophys J 83, 3513–3524.
24 Borges JC, Hannes F, Craievich AF, Hansen LD &
Ramos CHI (2003) Free human mitochondrial GrpE is
a symmetric dimer in solution. J Biol Chem 278, 35337–
35344.
25 Chou WC, Liao KW, Lo YC, Jiang SY, Yeh MY &
Roffler SR (1999) Expression of chimeric monomer and
dimer proteins on the plasma membrane of mammalian
cells. Biotechnol Bioeng 65, 160–169.
26 Meyer RD & Rahimi N (2003) Comparative structure-
function analysis of VEGFR-1 and VEGFR-2: What
have we learned from chimeric systems? Ann NY Acad
Sci 995, 200–207.
27 Rizzuto R, Brini M, Pizzo P, Murgia M & Pozzan T
(1995) Chimeric green fluorescent protein as a tool for
visualizing subcellular organelles in living cells. Curr
Biol 5, 635–642.
28 Shin SU & Morrison SL (1989) Production and proper-
ties of chimeric antibody molecules. Methods Enzymol
178, 459–476.
29 Chamberlin SG, Brennan L, Puddicombe SM, Davies
DE & Turner DL (2001) Solution structure of the
mEGF ⁄ TGFalpha44–50 chimeric growth factor. Eur J
Biochem 268, 6247–6255.
30 Dey B, Del Castillo CS & Berger EA (2003) Neutraliza-
tion of human immunodeficiency virus type 1 by sCD4-
17b, a single-chain chimeric protein, based on sequential
interaction of gp120 with CD4 and coreceptor. J Virol
77, 2859–2865.
31 Fontana A, Fassina G, Vita C, Dalzoppo D, Zamai M
& Zambonin M (1986) Correlation between sites of lim-
ited proteolysis and segmental mobility in thermolysin.
Biochemistry 25, 1847–1851.
32 Li Z, Gergely J & Tao T (2001) Proximity relation-
ships between residue 117 of rabbit skeletal troponin-I
and residues in troponin-C and actin. Biophys J 81,
321–333.
33 Oliveira DC & Reinach FC (2003) The calcium-induced
switch in the troponin complex probed by fluorescent
mutants of troponin I. Eur J Biochem 270, 2937–2944.
34 Lakowicz JR, Gryczynski I, Cheung HC, Wang CK,
Johnson ML & Joshi N (1988) Distance distributions in
proteins recovered by using frequency-domain fluoro-
metry. Applications to troponin I and its complex with
troponin C. Biochemistry 27, 9149–9160.
A. O. Tiroli et al. Contacts between skeletal TnC and TnI regulatory domains
FEBS Journal 272 (2005) 779–790 ª 2005 FEBS 789
35 Heinohen JK & Lahti RJ (1987) A new and convenient
calorimetric determination of inorganic orthophosphate
and its application to the assay of inorganic pyropho-
sphatase. Anal Biochem 113, 313–317.
36 Oliveira CLP (2003) TRAT1D – Computer Program for
SAXS Data Treatment. LNLS technical Manual MT
01 ⁄ 2003.
37 Semenyuk V & Svergun DI (1991) GNOM – a program
package for small-angle scattering data processing.
J Appl Crystal 24, 537–540.
38 Svergun DI, Petoukhov MV & Koch MHJ (2001)
Determination of domain structure of proteins from
X-ray solution scattering. Biophys J 80, 2946–2953.
39 Petoukhov MV, Eady NAJ, Brown KA & Svergun DI
(2002) Addition of missing loops and domains to pro-
tein models using X-ray solution scattering. Biophys
J 83, 3113–3125.
40 de la Torre JC, Huertas ML & Carrasco B (2000)
Calculation of Hydrodynamic Properties of Globular
Proteins from Their Atomic-level Structure. Biophys J
78, 719–730.
41 Botelho MG, Gralle M, Oliveira CLP, Torriani IL &
Ferreira ST (2003) Folding and stability of the extracel-
lular domain of the human amyloid precursor protein.
J Biol Chem 278, 34259–34267.
42 Svergun DI (1999) Restoring low resolution structure
of biological macromolecules from solution scattering
using simulated annealing. Biophys J 76, 2879–
2886.
43 Svergun DI & Petoukhov MV (2003) DAMAVER – set
of programs to align the models provided by DAMMIN
and GASBOR and to build ‘the most probable’ model –
beta version, />nfo/Research/Sax/damaver.html
44 Kozin MB & Svergun DI (2001) Automated matching
of high- and low-resolution structural models. J Appl
Cryst 34, 33–41.
Contacts between skeletal TnC and TnI regulatory domains A. O. Tiroli et al.
790 FEBS Journal 272 (2005) 779–790 ª 2005 FEBS