Quantifying Aesthetic Form Preference in a Utility Function pot
Bạn đang xem bản rút gọn của tài liệu. Xem và tải ngay bản đầy đủ của tài liệu tại đây (574.36 KB, 10 trang )
Seth Orsborn
Department of Interdisciplinary Engineering,
Missouri University of Science and Technology,
Rolla, MO 65409
e-mail:
Jonathan Cagan
Department of Mechanical Engineering,
Carnegie Mellon University,
Pittsburgh, PA 15213
e-mail:
Peter Boatwright
Tepper School of Business,
Carnegie Mellon University,
Pittsburgh, PA 15213
e-mail:
Quantifying Aesthetic Form
Preference in a Utility Function
One of the greatest challenges in product development is creating a form that is aestheti-
cally attractive to an intended market audience. Market research tools, such as consumer
surveys, are well established for functional product features, but aesthetic preferences are
as varied as the people that respond to them. Additionally, and possibly even more
challenging, user feedback requires objective measurement and quantification of aesthet-
ics and aesthetic preference. The common methods for quantifying aesthetics present
respondents with metric scales over dimensions with abstract semantic labels like
“strong” and “sexy.” Even if researchers choose the correct semantics to test, and even
if respondents accurately record their responses on these semantic scales, the results on
the semantic scales must be translated back into a product shape, where the designer
must take the consumers’ numerical scores for a set of semantics and translate that into
a form which consumers will find desirable. This translation presents a potential gap in
understanding between the supply and demand sides of the marketplace. This gap be-
tween designer and user can be closed through objective methods to understand and
quantify aesthetic preferences because the designer would have concrete directions to use
as a foundation for development of the product form. Additionally, the quantification of
aesthetic preference could be used by the designer as evidence to support certain product
forms when engineering and manufacturing decisions are made that might adversely
affect the aesthetics of the product form. This paper demonstrates how the qualitative
attribute, form, cannot only be represented quantitatively, but also how customer prefer-
ences can be estimated as utility functions over the aesthetic space, so that new higher
utility product forms can be proposed and explored. To do so, the form is summarized
with underlying latent form characteristics, and these underlying characteristics are
specified to be attributes in a utility function. Consumer surveys, created using design of
experiments, are then used to capture an individual’s preference for the indicated at-
tributes and thus the form. Once preference is summarized in the utility function, the
utility function can be used as the basis for form generation and modification or design
verification. ͓DOI: 10.1115/1.3116260͔
Keywords: utility function, form preference, consumer preference, discrete choice
analysis, product design
1 Introduction
1.1 Motivation for Form Preference. In light of the impor-
tance of new products to corporate growth, much research has
been done in the area of new product development. A key focus
has been to understand consumer preference so that new products
address the needs and desires of the potential consumers. For
many product categories, exterior styling and other aesthetic ele-
ments are measured to be critical to the buying decision or to
customer satisfaction. This research creates and discusses a
method to map customer utility of complex product shapes, pro-
viding a method for product designers to conduct early market
research in a continuous design space to find high utility product
shapes.
Engineering design research has produced models for under-
standing consumer preference for product features and function-
ality related to creating new products that match consumer needs.
Methods, such as quality function deployment through the house
of quality ͓1͔ and mapping customer preferences onto fuzzy sets
͓2,3͔, only consider consumer preference for features and func-
tionality. Emotional product characteristics, especially shape, can-
not be ignored during the design process because they have con-
siderable influence on consumer purchase decisions ͓4–8͔. While
some methods have been created to account for emotional re-
sponses to consumer products during design ͓9,10͔, these methods
are still limited due to their dependence on subjective scales
͓11,12͔, such as semantics ͓13͔. Product form has been considered
with respect to functionality and manufacturing ͓14͔, but the aes-
thetic considerations were neglected by not taking them into ac-
count directly. Aesthetic preference for an individual product fea-
ture has been determined using shape morphing ͓15͔, but does not
account for multiple features or indicate how to create a set of
design concepts that would be preferred.
These results from past research indicate the importance of for-
mal study of emotive product characteristics such as aesthetics.
By directly quantifying a consumer’s preference for form within a
class of products, the work presented in this paper circumvents the
subjective limitations of semantics, both in terms of the variation
in the meanings of the words and in terms of the mapping of the
words to forms. Our approach does not require a priori sets of
descriptors of products ͑e.g. sportiness and luxuriousness͒ on
which respondents score the product shapes, nor does our ap-
proach require the analyst to specify important product details to
include as potential constructs ͑e.g. size of headlight͒. Rather than
asking consumers to translate forms into ratings on semantic de-
scriptors, this work allows consumers to see the forms and to
simply indicate which forms are preferred. There are important
advantages of our approach relative to those that require respon-
Contributed by the Design Theory and Methodology Committee of ASME for
publication in the J
OURNAL OF MECHANICAL DESIGN. Manuscript received January 25,
2008; final manuscript received March 9, 2009; published online April 27, 2009.
Review conducted by Yan Jin. Paper presented at the ASME 2008 Design Engineer-
ing Technical Conferences and Computers and Information in Engineering Confer-
ence ͑DETC2008͒, Brooklyn, NY, July 6–August 3, 2008.
Journal of Mechanical Design JUNE 2009, Vol. 131 / 061001-1Copyright © 2009 by ASME
Downloaded 07 May 2009 to 128.2.5.228. Redistribution subject to ASME license or copyright; see />dent scoring. First, our approach does not require the researcher to
know the potential subjective characteristics a priori. Second, our
approach does not prime respondents with a set of criteria on
which the analysts expect them to measure the product. Third, our
approach does not present respondents and designers with the
challenge of translating back and forth between visual and verbal
languages.
Although past research shows the importance of and interest in
consumer preferences for product aesthetics, extant research in
this area has been limited due to the challenge of quantifying
subjective preferences. But recent work has yielded a method to
map the continuous space of numerous curves to a smaller set of
dimensions that can be feasibly used as a basis for experimental
design ͓16͔. We build on that method to develop and analyze
consumer preferences within a quantified aesthetic space, taking
away the subjectivity of understanding preferences for a complex
space of product aesthetics. Along with automatic design genera-
tion, the process presented in this work provides a stable founda-
tion for developing new products that not only meet utilitarian
consumer needs, but also their aesthetic preferences.
2 Methodology for Quantifying Form Preference
In this section we introduce the general methodology used for
quantifying consumer aesthetic form preference. The rest of this
paper then goes through the details of the methodology in the
context of an example application.
The first step is to choose a product design space. Since what is
being determined is a consumer’s preference for a consumer prod-
uct form, a set of products that are all in the same competitive
market are chosen. For example, if a company wants to determine
the form preference for travel coffee mugs, a sample of coffee
mugs from this product class should be chosen. Ideally, this
sample will represent all, or close to all, the parametric variations
within the product class. There are instances where some features
may not be included on all the products, such as handles on a
coffee mug. If the feature does not exist, its parametric value can
be reduced to zero, essentially eliminating the feature’s form. This
product design space defines the generic form of the product.
The generic form of these products then needs to be atomized.
The product form is broken into characteristics, like the coffee
mug handle, and each characteristic is represented using Bezier
curves. Each Bezier curve is then represented using atomic at-
tributes. Once the atomization is done, then the parametric ranges
for the atomic attributes are derived from the product sample by
representing each product form in the sample set within the atom-
ized product space. The atomic form attributes then translates di-
rectly into the attributes of the descriptive utility function.
We employ utility functions to relate product shape to customer
preferences. A utility function is a tool used by economists to
describe a person’s utility, a measure of happiness, or satisfaction
gained by using a certain good or service ͓17,18͔. Utility functions
have been used quite successfully in engineering design research
͓19–24͔.
A benefit of a utility function is that it can represent a complex
space where many different attributes each account for a dimen-
sion. A utility function offers a means to describe the relationship
of all these attributes and then the space can be explored to maxi-
mize a person’s utility. Utility functions can be used in optimiza-
tion to determine an optimal set of trade-offs ͓25–27͔. This utility
function can then be used to automatically generate new designs
according to the derived preference.
Discrete choice conjoint analysis allows estimation of utility
weights in a relatively realistic task, wherein respondents select
their most preferred item out of a set ͓28,29͔. Additional motiva-
tion for this research is that quantifiable performance measures are
not independent of qualitative issues for product designers have
not found or agreed on an objective measure for quantifying aes-
thetics ͓30͔.
While the typical conjoint survey requires respondents to read
and evaluate verbal descriptions of products, where varying at-
tributes are described using text, the conjoint in this study is pic-
torial. It has been demonstrated that pictorial representations have
an advantage over text in that they reduce fatigue, are more inter-
esting ͓29͔, and produce better results ͓31,32͔.
Respondents answer two surveys, an initial calibration/
estimation survey, and a follow-up validation survey. To accom-
modate heterogeneity of the aesthetic preferences of respondents,
the respondent’s results from the initial survey are analyzed indi-
vidually, and a utility function is created for each individual. This
utility function is then used to create a respondent-specific set of
product concept designs to verify the validity of the individual’s
utility function, where these product concept designs are pre-
sented to the individual respondent in the follow-up validation
survey.
In summary, utility functions have been used in engineering
design research to quantify preference for quantitative attributes.
The work presented here takes the qualitative attribute of form
and captures preference for it in a utility function. This utility
function is then used to generate new designs that match con-
sumer preference.
3 Determining Attributes
As with any discrete choice study, the choice of attributes is
fundamental to the understanding of the design space. There are
two theories of product form considered. The first considers prod-
ucts to have drama ͓33͔. Drama is described as the stages of
anticipation, anxiety, and integration. This is contrary to the sec-
ond theory that states that the viewing of art is linear, not holistic
͓34͔. Tension is created in three ways: anticipation, conflict/
contrast, and complexity. This suggests that product designers
separate their products into discrete elements and ask the consum-
ers to rank order them with respect to their expressing the prod-
uct’s personality. Then, the source of the tension is known and can
be used in the marketing of the product. In this work, it can be
used in the designing ͑or redesigning͒ of product form. By atom-
izing the form of a product ͓33͔, it can be determined which
attributes truly affect the consumer response and how. Utility
theory states that it is necessary to choose attributes that represent
the consumer interest. This choice of appropriate attributes is not
trivial. The technique in this research is one approach to choosing
attributes, and the proof of concept reveals it to be reasonably
effective in the end result of assessing and predicting customer
preferences for form.
3.1 Parametrizing the Design Space. The current state of the
art for discrete choice conjoint analysis is limited to about 30
variables for effective survey techniques using design of experi-
ments ͓35͔. With a larger attribute space, the survey respondent is
likely to fatigue from the large number of questions required.
Therefore, it is necessary to minimize the number of attributes
needed to initially describe a product’s form.
For the sample data set, 20 sports utility vehicles ͑SUVs͒ were
chosen from the 2003 model year. Fifty-three traditional SUV
models were produced in 2003. Of these, ten were identical in
form to other SUVs due to rebadging, e.g. the GMC Yukon and
the Chevrolet Tahoe. The true population size, with respect to
form, was 43 SUVs. Of these, 20 were included in the sample,
accounting for 47% of the population. The selection requirements
were that each vehicle have an available blueprint that included
the front and side views. Each of the views must be isometric ͑or
as parametrically close as possible͒ and the two views should
complement each other parametrically, i.e. the proportions in each
view of the drawing is consistent with the actual vehicle. Table 1
lists the sample vehicles.
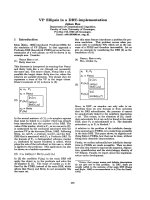
Seven atomic attributes were selected from the full representa-
tion of the SUV form ͑Fig. 1͒. These were chosen because they
provided an interesting design space while keeping the number of
061001-2 / Vol. 131, JUNE 2009 Transactions of the ASME
Downloaded 07 May 2009 to 128.2.5.228. Redistribution subject to ASME license or copyright; see />variables manageable. Atomic attributes Hcowlx and Hcowlz po-
sition the cowl with respect to the coordinate axis, which is lo-
cated on the ground just below the middle of the front axle.
V1hoodx and V1hoodz position the top of the grill with respect to
the cowl. V1grllz indicates the height of the grill. V1hdltz posi-
tions the headlight with respect to the cowl. V4hdltz is the height
of the headlight.
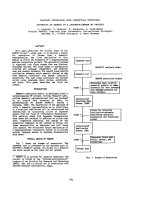
In summary, the representation of a complex form with lesser
features is called atomization ͓33͔. The form of an automobile has
first been broken in characteristics, i.e. headlight and grill. Then
each characteristic has been subdivided into the curves needed to
represent that characteristic. The representation of the curve is
then divided into its atomic attributes ͑Fig. 2͒. These atomic at-
tributes can be modified to change the overall form of the vehicle,
the gestalt. The consumer sees only a change in product form.
Meanwhile, the designer is manipulating the form atomically.
3.2 Form of Utility Function. Now that the attributes have
been determined, they must be composed into a utility function.
The true functional form of individual’s utility for aesthetics being
unknown, we employ a combination of linear and quadratic speci-
fications. We assume the utility for the latent attributes to be sepa-
rable, using a linear model for each attribute u
i
U͑x
¯
͒ =
͚
i=0
n
u
i
: u
i
= f͑

i
,x
i
͒͑1͒
where u
i
is some function representing the utility of an individual
attribute x
i
from the vector of attributes x
¯
, where n is the total
number of attributes. This function also includes the attribute
weights,

, which vary depending on the functional form. For
each attribute u
i
, we assume quadratic utility. Each attribute has a
squared, a linear, and a constant term with a separate weight,

ij
,
for each term of the function where x
i
is the parametric value of
the atomic attribute ͑Eq. ͑2͒͒. While the quadratic form allows for
interior solutions, a linear individual attribute utility would be
limiting in that it would force “corner solutions,” where maximum
utility is assumed to be at either the constrained maximum or
minimum of the parametric range. The quadratic form for indi-
vidual attribute utility is sufficient for most representations in that
it can approximate a maximum within a range, but can also be
linear if the preference is truly linear ͓36͔
u
i
=

i1
x
i
2
+

i2
x
i
+

i3
͑2͒
Because the individual utility function is quadratic, its 2D space
͑attribute versus weight͒ can be searched for a maximum and
minimum utility using any number of optimization techniques,
such as pattern search. While a maximum would be easy to find
using a derivative, this method is not applicable in every situation.
A nonlinear general utility function would require optimization
techniques, and is the subject of future research. If a user’s pref-
erence for an individual attribute is linear, it can still be captured
using a quadratic, then

i1
is simply zero. Some quadratics are
convex and some are concave. Some quadratics do not reach their
maximum or minimum within the constrained space. This com-
plexity and its implication on product design generation will be
demonstrated later.
In summary of the modeling approach, the overall gestalt of the
vehicle is described through an atomization of the form: separat-
ing the form into characteristics, describing each characteristic
with a set of curves, and representing each curve with a set of
atomic attributes. The preference for these attributes is then rep-
resented in a utility function that assumes a linear relationship
Table 1 SUV sample „2003 model year…
SUVs
1 Acura MDX
2 BMW X3
3 BMW X5
4 Chevrolet Suburban
5 Ford Escape
6 Ford Excursion
7 Ford Expedition
8 Ford Explorer
9 Hyundai Santa Fe
10 Kia Sportage
11 Land Rover Free Lander
12 Land Rover Range Rover
13 Mazda Tribute
14 Mercedes Benz ML
15 Mitsubishi Montero
16 Mitsubishi Montero Sport
17 Porsche Cayenne
18 Suzuki Grand Vitara
19 Toyota Land Cruiser
20 Toyota RAV4
Fig. 1 Seven SUV atomic attributes
Fig. 2 Atomization of product form
Journal of Mechanical Design JUNE 2009, Vol. 131 / 061001-3
Downloaded 07 May 2009 to 128.2.5.228. Redistribution subject to ASME license or copyright; see />between the atomic attributes with quadratic utility over the levels
of the attribute. While the overall gestalt of the product may
change through the atomic manipulation of attributes, the consum-
er’s preference can still be capture for the form as a whole.
4 Estimating Utility Weights
Section 3 demonstrated what the x
i
in the utility function rep-
resents: a value in the parametric range of the attribute. It was
shown that the “best” value can be found by optimizing according
to the utility function. But, what was not stated was how the
attribute weights,

ij
, are estimated.
4.1 Design of Experiments. Discrete choice analysis is used
to determine the attribute weights for the utility function. Rank
ordering, an alternative to discrete choice, has been shown to be
effective in understanding preference ͓29͔, though it is questioned
due to its dissimilarity with the actual choice process consumers
use when choosing products. Utilizing SAS, a pre-existing survey
creation and analysis tool, a fractional factorial design can be
created ͓29͔, using a modified Fedorov algorithm to build the
survey design based on a multinomial logit model ͓37͔. This al-
gorithm is based on the null hypothesis that the attribute weights
are zero, i.e. zero prior parameter values. Initially, what is required
is the number of attributes to be tested and the levels that those
attributes should be tested at. Attribute levels chosen for testing
should span the desired range and be evenly spaced to prevent
biases ͓37͔. For example, if the rim diameter attribute is to be
tested with its maximum at 20 in. and minimum at 10 in. Then
three discrete attribute levels should be 10 in., 15 in., and 20 in.
The number of attribute levels to test is determined by the form of
the individual utility function. If the individual utility function is
linear, a minimum of two attribute levels is necessary. As is the
case here, a minimum of three attribute levels is necessary for a
quadratic. In general, it is not necessary for each attribute to have
the same number of levels. Because the overall utility function is
linear ͑Eq. ͑1͒͒, it does not require that u
i
be of the same form for
each attribute. In this work, u
i
is always a quadratic.
Once the number of attributes and their levels are determined, a
fractional factorial experiment design can be created. It is impor-
tant to consider several criteria when choosing an experiment de-
sign option ͓38͔. First, the experiment design should be balanced.
A balanced design presents the consumer each level of each at-
tribute the same number of times. Second, the experiment design
should be orthogonal. An orthogonal design presents the con-
sumer each pair of each level of each attribute in the same number
of times. For example, two attributes x
1
and x
2
would be tested at
each combination of their three levels, the same number of times
in an orthogonal design, totaling in eight combinations: 2
3
. While
100% efficiency is not an exclusionary criterion for good experi-
ment designs, it was sought in all of the design choices. The more
efficient a design, the more precise the estimation of the coeffi-
cient for each attribute level, which is the weight on the attribute
in the utility function. Additionally, the experimental design im-
pacts which weights are identified, such as main effects and inter-
actions. The only way to completely account for all main effects,
two-way interactions, and higher-order interactions is to have a
full factorial. By ensuring that the fractional factorial experiment
design is an orthogonal array ͑both orthogonal and balanced͒, all
estimable main effects are uncorrelated ͓39͔. Third, experiment
designs vary depending on the number of choices per question.
But, the number of choices per question can affect the number of
questions required for an efficient design. In each of the experi-
ment designs chosen, three options were presented for each ques-
tion. This was found to be the best for minimizing the number of
questions needed while keeping the task simple. This was due to
the mathematical implication that each attribute had three levels,
which were required for fitting a quadratic, as will be seen in Sec.
4.2. The fourth criterion is to minimize fatigue ͓40͔. The more
complex the choices, the more distorted the estimates become
͓41͔. With form, the complexity of the multitude of variables is in
a sense “hidden;” though there are many attributes, the consumer
only sees a changing picture. It has been suggested to use simpli-
fied strategies to prevent fatigue or boredom, such as making the
study as short as possible, because as people get more tired, they
simplify their decision making ͓40͔. For example, in the begin-
ning consumers may choose a vehicle based on the whole design,
toward the end they may be choosing based on one or two key
features, such as track width or the front view of the grill. Sim-
plification can be done through minimizing the number of ques-
tions and minimizing the number of choices per question. For
example, consider that one is looking for an experiment with 7
attributes at 3 levels each. The first experiment option may be 36
questions, each with 3 choices. The second experiment option
may be only nine questions, but with nine choices per question.
While the first experiment design is much longer, the individual
task complexity is much less ͑choosing one-of-three versus one-
of-nine͒, and therefore a less fatiguing experiment.
Once the design is chosen, the experiment must be constructed.
It is common in marketing to include a no-choice option, or a
constant. This is done especially in empirical modeling in order to
specify a model, which more closely reflects the actual choice
process, because in the empirical data set of actual purchases,
consumers truly have the option to forgo all of the focal products.
Our laboratory experiment did not include the no-choice for two
reasons, beyond simply the fact that the laboratory controlled the
set of available options, unlike empirical data. The first is that
what is being attempted to be understood is preference. Most mar-
keting studies seek to find out what preference at what price.In
this study, price is not an issue and was purposely left out. Only
the understanding of which form is preferred over another is of
interest. Second, adding a no-choice option degrades the precision
of the estimates ͓37͔. When an experiment is designed it assumes
that there will be a response for each question. For each no-choice
option selected, the efficiency of the experiment design decreases
and, thereby, the estimation of the part worth is more likely to be
imprecise. If the part worth is incorrect, its error will propagate
through the methodology; the utility function is less likely to truly
match the consumer and therefore product designs created or ana-
lyzed based on the utility function will also not match the con-
sumer’s preference.
4.2 Discrete Choice Analysis. Once the survey has been con-
structed and administered, the respondent’s results need to be ana-
lyzed to determine the part-worth estimates. A part-worth is the
estimated preference for a single choice instance. Since the ex-
periment was designed to be both orthogonal and balanced, and
because part-worth parameters are estimated by the individual,
estimates for the discrete choice logit model are a one-to-one
transformation of those using the simple the Luce method ͓42͔,
often now referred to as the Bradley–Terri–Luce ͑BTL͒ equation
͓43͔, since Bradley and Terry had earlier proposed Luce’s choice
axiom in binary choice sets ͓44͔. In the BTL method, the prob-
ability that a consumer will select option i from a pool of items j
is
P͑i͒ =
w
i
w
j
͑3͒
In this work, w
i
is simply the number of times that option was
chosen divided by the total number of times that option was of-
fered, w
j
.
Since there are three levels for each attribute, there are three
part-worth values that need to be estimated. For example ͑Table
2͒, the horizontal position of the cowl may be offered at three
levels covering its parametric range: level 1 at 71.958 in. ͑maxi-
mum͒, level 2 at 63.883 in. ͑mean͒, and level 3 at 55.808 in.
͑minimum͒. A consumer chooses designs with level 1 13 times,
level 2 14 times, and level 3 9 times out of 36 questions.
Then the probability of that person preferring each level is just
061001-4 / Vol. 131, JUNE 2009 Transactions of the ASME
Downloaded 07 May 2009 to 128.2.5.228. Redistribution subject to ASME license or copyright; see />the percentage of times that they chose it: 36.1%, 38.9%, and
25.0%, respectively. These values are then centered around zero
by subtracting the average percentage of the set, thus the magni-
tude of the estimates reflects the importance or weight of that
attribute in the overall utility function, U
i
.
These centered values are then the part-worth values. Example
part-worth values are plotted versus the attribute range ͑Fig. 3͒.
Since the intention is to estimate the weights for the utility func-
tion based on a quadratic function, a quadratic curve is fit to the
three part-worth values ͑Fig. 4͒. This function is of the parametric
range for the attribute versus its utility and easily converts from
y =−0.0013x
2
+0.1702x−5.5996 to u
i
=

i1
x
i
2
+

i2
x
i
+

i3
͑Eq. ͑2͒͒,
where

i1
=−0.0013,

i2
=0.1702, and

i3
=−5.5996. This at-
tribute’s utility function is then combined with the other at-
tributes’ utility functions to form the full utility function for that
individual consumer. Once all attribute weights for the utility
function have been determined, the utility function can be used in
designing new products forms or confirming existing designs.
5 Consumer Study
The following is a study conducted as a validity check, to de-
termine if the process developed is predictive of consumer pref-
erences of vehicle forms outside of the set presented in the initial
calibration and estimation set. An initial vehicle survey was used
to determine the weights for a respondent’s utility function. The
initial survey was the same for each respondent. Then, a follow-up
survey, individualized for each respondent, validated the utility
functions through designs created according to the respondent’s
utility function. Both studies were provided online to ensure each
respondent could take the survey in a comfortable setting and to
facilitate data collection.
5.1 Initial Survey Design. An initial sample study using all
55 of the atomic attributes from the headlight and grill character-
istics needed to describe the curves in detail had several problems
that could not be addressed directly. The issues that could be
addressed, fatigue and attribute interaction, were both able to be
minimized by reducing the number of attributes included in the
utility function. The number of attributes chosen was based on the
need to keep the experiment length as short as possible while still
being able to change the appearance of the vehicle significantly.
Since a quadratic function is being used to describe preference for
each attribute, each attribute must have three levels. As stated
previously, these attribute levels were set at maximum, average,
and minimum for the parametric ranges found in the product
sample. Through an iterative process using SAS software, it was
found that a reasonably sized orthogonal array ͑orthogonal and
balanced design͒ of 36 questions could be determined from 7
attributes. This experiment is composed of 18 different product
designs. Four of the questions are asked multiple times ͑with the
options in different orders͒ to verify choice consistency.
The seven attributes chosen to be included in the utility func-
tion are shown in Fig. 1: Hcowlx, Hcowlz, V1hoodx, V1hoodz,
V1grllz, V1hdltz, and V4hdltz. Fifty-one other attributes are
needed to create a completed vehicle form. The 51 attributes are
each kept constant at a neutral parametric value, so as to minimize
their interaction with the seven attributes included in the utility
function and thus to minimize their influence on the survey re-
spondents design choices. The seven explored attributes, while
few, provide a large variation in the form of the vehicles, as can be
seen in Figs. 5–7. Table 3 lists these attributes and the parametric
values for their three levels for the initial vehicle survey. Each
parametric value is in inches.
5.2 Vehicle Survey. A publicly available web-based survey
host was used to build the survey structure and to administer all
surveys. This pre-existing software was used for the sake of
quickly conducting the experiment. The first page of the online
vehicle survey introduced the survey and provided some general
information. This second page provided instructions on how the
Table 2 Part-worth estimation example
Level Parametric value Times chosen
% chosen
͑%͒ Centered
1 71.958 13 36.1 0.028
2 63.883 14 38.9 0.056
3 55.808 9 25.0 Ϫ0.083
Fig. 3 Part-worth value example
Fig. 4 Quadratic function example
Fig. 5 Option designs 1 and 2
Fig. 6 Option designs 11 and 12
Journal of Mechanical Design JUNE 2009, Vol. 131 / 061001-5
Downloaded 07 May 2009 to 128.2.5.228. Redistribution subject to ASME license or copyright; see />survey would work and gave an example drawing to familiarize
the respondent with the forms that would need to be assessed. The
third ͑Fig. 8͒, and each consecutive page, showed three vehicle
forms created according to the design of experiments. Next to
each form was a radio button. The respondent was required to
choose an option before the next question would become avail-
able. This proceeded as such through all 36 questions. After 18
questions, the half-way point, the respondent was reminded that
taking a break was encouraged if needed.
Upon completion of the survey, the respondent’s answers were
downloaded and analyzed ͑in Microsoft Excel͒ using the BTL
method. Once the attribute weights,

ij
, were determined, the re-
sulting utility function was then ready to be used to create respon-
dent specific designs.
5.3 Verification Survey. To verify that the utility function
captures the respondent’s preference, a second survey was admin-
istered. Where the first survey was general and given to the re-
spondents universally, the verification survey is based on an indi-
vidual’s utility function and was thus customized for each
respondent.
The verification survey was composed of ten questions each
with three options, in the same layout as the first vehicle survey.
In this case, the options are not orthogonal designs intended to be
analyzed for attribute weights. Each option represented one of
three types of designs: high utility, neutral utility, or low utility.
The order of these options was randomized for each verification
survey question.
For a design to be included in the verification survey, its utility
must be within 10% of its respective target. Included high utility
designs must be greater than
U
max
− ͑0.1 ء ͑U
max
− U
min
͒͒ ͑4͒
Likewise, low utility designs must be less than
U
min
+ ͑0.1 ء ͑U
max
− U
min
͒͒ ͑5͒
The constraint for the neutral utility designs is
͓U
min
+ ͑0.5 ء ͑U
max
− U
min
͔͒͒ Ϯ ͑0.05 ء ͑U
max
− U
min
͒͒ ͑6͒
By applying these constraints, it could be ensured that the designs
were visually distinct and were separate enough in utility to not be
accidentally convoluted.
The verification survey had a similar opening survey page and
the instructions page was the same, except the number of ques-
tions was changed from 36 to 10, and the estimated time was
reduced to 5 min. The questions, from the perspective of the re-
spondent, were essentially the same. It is interesting to note that
one respondent even delayed taking the verification survey until
prodded because he was convinced he had already taken it.
6 Results
The sample population for this experiment consisted of 30 in-
dividuals ranging from 23 years old to 61 years old, with an
average of 37 years old. The experiment was intentionally di-
rected at a population over the age of 25, with the expectation that
persons of an automotive purchasing age would be more con-
scious of product form design. The sample population was almost
evenly split according to gender ͑16 males versus 14 females͒
though there were considerably more married persons than non-
married persons ͑23 versus 7͒.
Each respondent was contacted via an online message board or
email announcement. The respondent then contacted the experi-
ment coordinator and was assigned a numeric identifier for ano-
nymity. An email was sent to the respondent that contained a
hyperlink to the first survey. Upon completion of that survey, the
respondent’s results were downloaded and processed as discussed
in Sec. 5. Upon creation of the individualized verification survey,
a second email was sent to the respondent with a hyperlink to their
verification survey. Upon completion of the verification survey,
the results were downloaded and compared with expected results.
6.1 Individual Utility Functions. An individual’s utility
function was found by analyzing the results from the vehicle sur-
vey using the BTL method described earlier. The resulting utility
function, U
i
, was composed of a utility function for each atomic
attribute, u
i
shown in Fig. 1. Each attribute utility function could
be plotted against its parametric range. These came in one of four
forms: sloped linear, convex, concave, or flat. All the examples
used in this section are actual attribute utility functions from the
experiment. Respondent 30 was chosen for these examples be-
cause the attribute utility functions span the entire spectrum ͑Figs.
9–15͒ of functional forms.
The utility function for attribute Hcowlx ͑the horizontal posi-
tion of the cowl relative to the global coordinate axis͒ was deter-
mined to be linear with a preference for the horizontal position of
Fig. 7 Option designs 31 and 32
Table 3 Attributes and their levels
Attributes
Levels
123
1 Hcowlx 71.958 63.883 55.808
2 Hcowlz 55.908 49.920 43.931
3 V1hoodx Ϫ43.344 Ϫ48.272 Ϫ53.201
4 V1hoodz Ϫ6.024 Ϫ11.087 Ϫ16.149
5 V1grllz Ϫ5.684 Ϫ10.485 Ϫ15.286
6 V1hdltz 11.199 8.193 5.187
7 V4hdltz Ϫ4.485 Ϫ9.970 Ϫ15.455
Fig. 8 Vehicle survey example question
061001-6 / Vol. 131, JUNE 2009 Transactions of the ASME
Downloaded 07 May 2009 to 128.2.5.228. Redistribution subject to ASME license or copyright; see />the cowl to be as close to the front axle as possible ͑Fig. 9͒ at
55.80 in. A linear attribute utility function shows a maximum
preference at one of the parametric constraints.
A convex utility function ͑Fig. 10͒ shows that an attribute has a
particular parametric value range that is preferred. ͑It is specifi-
cally not stated that the exact parametric value for the attribute
could be determined. As in all utility theory, where models are
approximations of true preferences, the parametric estimates re-
flect approximate preferences rather than exact preferences.͒ At-
tribute Hcowlz ͑the vertical position of the cowl relative to the
global coordinate axis ͑Fig. 10͒ is symmetric and concave. For
Hcowlz, the utility function estimate indicates the highest utility
for the vertical height of the cowl is close to 50 in., with a rapid
decrease in utility if the cowl is raised or lowered.
An unusual form of an attribute utility function is flat ͑Fig. 11͒.
If the respondent chooses each level of an attribute an equal num-
ber of times during the vehicle survey, the BTL method produces
part-worth values of zero. What can be inferred is that the respon-
dent does not consider the attribute of importance in their choices
among the presented options. For product design generation, a flat
utility function gives the greatest flexibility to the designer, in that
a design may fall anywhere within an attribute’s parametric range
without affecting customer preferences. Respondent 30 showed no
preference for the length of the hood ͑V1hoodx, Fig. 11͒, provid-
ing flexibility in hood length when designing form concepts.
The preference for the height of the hood ͑V1hoodz, Fig. 12͒ is
similar to that for the height of the cowl, though here the concave
function is not symmetric. It has a highest estimated preference at
11.75 in. below the height of the cowl. The utility for the height of
the grill is linear ͑V1grillz, Fig. 13͒, with greater preference to-
Fig. 9 Respondent 30 Hcowlx
Fig. 10 Respondent 30 Hcowlz
Fig. 11 Respondent 30 V1hoodx
Fig. 12 Respondent 30 V1hoodz
Fig. 13 Respondent 30 V1grllz
Fig. 14 Respondent 30 V1hdltz
Journal of Mechanical Design JUNE 2009, Vol. 131 / 061001-7
Downloaded 07 May 2009 to 128.2.5.228. Redistribution subject to ASME license or copyright; see />ward the shortest grill, 5.68 in. tall.
A concave utility function ͑Figs. 14͒ has a clear parametric
range that is not preferred. The shape of this function allows for
distinct designs with a higher utility for this attribute, either the
minimum or maximum in the parametric range. This allows for
compromise in the design and distinctive forms that the individual
still prefers. The distance from the cowl to the top of the headlight
͑V1hdltz, Fig. 14͒ also has a maximum utility at the lower con-
straint, 5.19 in. But, since it is concave, large and small distances
are preferable to those in between.
The final attribute, the height of the headlight ͑Fig. 15͒, also has
a constrained preference at the shortest value, 4.50 in. These func-
tions map out the space of preferred forms for Respondent 30, and
the functions can be used to compare designs or to create new
designs that fit Respondent 30s quantified preference.
The respondent’s utility function is then used to create concept
designs. Figure 16 shows one of the high utility concept designs
created according to Respondent 30s utility function. This design
has a utility value of 0.802, where the maximum possible utility
for Respondent 30 is 0.804. Just as the attribute utility plots sug-
gest, it was designed with small headlights and grill. The hood is
relatively long, the positioning of the cowl is at its minimum.
While this design is high utility for Respondent 30, it is not
necessarily high utility for everyone. As a contrast, Fig. 17 shows
a low utility design for Respondent 15, one that is similar to the
high utility design for Respondent 30, with the headlight and grill
both quite short in the two designs. Designers would need to take
preference heterogeneity into consideration as the conceptual de-
sign process moves forward. One way to accommodate the differ-
ence would be to see if various respondents’ utility functions clus-
ter into distinct market segments ͓32͔.
Figure 18 shows one of the low utility concept designs for
Respondent 30. This design has a utility of Ϫ0.43, where the
lowest possible utility is Ϫ0.51. This form concept has many ob-
vious differences from the maximum utility design in Fig. 14, all
of which reflect the utility functions presented for Respondent 30.
Both the headlight and grill are taller, and the cowl height is
shorter and farther back. It is important to note that the length of
the hood has changed, but does not affect the design preference, as
indicated in Fig. 11. The positioning of the headlight and grill
with respect to the cowl has changed dramatically.
Figure 19 shows a neutral utility design for Respondent 30. For
respondents, this set of designs was the most diverse. Linear
͑Figs. 9 and 13͒, or nonpeaking quadratic ͑Fig. 15͒, functions only
have a short parametric range for neutral designs. But, convex and
concave functions ͑Figs. 10, 12, and 14͒ all have two separate
parametric ranges, where the utility function crosses the horizon-
tal axis, which offer attribute values for neutral designs. These
values, while seemingly unimportant, should be considered care-
fully. As a product’s form is refined, it needs to account for many
individual preferences in a single target market. While a single
form design may not be high utility for every individual, if the
design can be kept at neutral utility, or above, it is more likely to
be preferred over a low utility design. The aggregation of indi-
vidual utility functions has shown to be effective for determining
market segments ͓32͔. Its potential for application to product form
is quite clear, but is left for future research.
6.2 Results From Individual Verification Surveys. Not all
respondents had such a mix of utility functions as Respondent 30.
For certain respondents, many of the attribute utility functions
were flat. For others, all attribute utility functions had an interior
maximum or minimum. As stated previously, the purpose in the
verification survey is to assess the degree to which the utility
function accurately reflects form preference. Respondents were
presented with ten questions, where each question had three op-
tions: one that was generated from what was estimated to be the
high utility portion of the design space, one from the low utility
design space, and one neutral utility design. The respondent was
required to choose one of the three options. If the estimated utility
functions are relevant, one would expect respondents to choose
the forms that were estimated to have higher utility. The order that
the design options were presented was randomized for each re-
spondent, to eliminate any ordering effects. Unlike the first sur-
vey, which was identical for each respondent, each set of designs
for the verification survey was created specifically for the respon-
dent, totaling 900 designs for the 30 respondents.
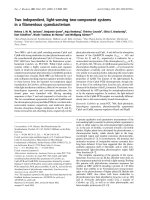
The results from the verification surveys are summarized in Fig.
20. High utility designs were chosen 78.33% of the time on aver-
age, with a standard deviation of 23.06%. The neutral utility de-
signs were chosen at an average of 19.33% of the time, with a
Fig. 15 Respondent 30 V4hdltz
Fig. 16 Respondent 30 high utility design 1
Fig. 17 Respondent 15 low utility design 2
Fig. 18 Respondent 30 low utility design 6
Fig. 19 Respondent 30 neutral utility design 2
061001-8 / Vol. 131, JUNE 2009 Transactions of the ASME
Downloaded 07 May 2009 to 128.2.5.228. Redistribution subject to ASME license or copyright; see />standard deviation of 19.82%. It should be noted that this crosses
the 0% value. Finally, on average the low utility designs were
chosen 2.33% of the time, with a standard deviation of 7.74%.
The results clearly show that respondents tended to prefer high
utility designs. There is no overlap between the standard deviation
bars for the high and neutral utility designs, showing that the
difference in choice probabilities of the high and the neutral de-
signs is statistically significant. Although the difference in the
choice probabilities of the low and neutral designs are not statis-
tically significant, the observed choice probability for the low util-
ity designs is lower than that of the neutral designs, giving direc-
tional support to the utility function estimates. Overall, the results
of the verification survey show that the methodology developed
here successfully elicits aesthetic form preferences of the respon-
dents even at an individual level.
7 Conclusions
When a new product is designed, it is necessary to account for
factors that influence the choice of product and purchase decision
of the consumer. Engineering design has developed methods for
accurately ascertaining engineering parameters for new products,
such as which features should be included in a product. However,
a product is also composed of other parameters that have not been
formally incorporated into new product design analyses, but
which may be influential for certain product categories. In certain
product categories, for example, consumer choices may be influ-
enced by the visual appeal of the product. This paper introduced a
method for quantifying a consumer’s form preference in a utility
function. Through design of experiments an initial survey is cre-
ated that tests the consumer’s preference for specific product
forms. An analysis of the initial survey results produces a utility
function that can then be used to create product form designs that
match the consumer’s preference.
Future research could address ways to reduce the number of
designs evaluated by respondents for complex products, such as
vehicles, possibly using techniques such as adaptive conjoint. Ad-
ditionally, the BTL method is appropriate for balanced orthogonal
designs, such as was utilized here; although for our data the BTL
yielded the same results as would the logit function, future re-
search can directly incorporate functional forms such as logit and
probit. The example provided demonstrated an interesting, but
simplified, design space. As more product form detail is captured
and more complex products are analyzed, the number of attributes
needed to describe the design space will increase significantly.
The next challenge is how to represent the design space with the
least number of attributes while still capturing the fundamental
form changes that consumers find important. This will require a
reparametrization of the design space that may include or combine
previously used methods, such as key product ratios. As the prod-
uct complexity increases, the traditional utility function represen-
tation may not be sufficient. New representations may need to be
developed that quantify the design space in a more concise for-
mat.
Acknowledgment
Funding for this research was partially provided by the National
Science Foundation under Grant No. DMI-0245218.
References
͓1͔ Griffin, A., and Hauser, J. R., 1993, “The Voice of the Customer,” Mark. Sci.
͑Providence R.I.͒, 12͑1͒, pp. 1–27.
͓2͔ Otto, K., and Antonsson, E., 1994, “Modeling Imprecision in Product Design,”
Proceedings of the Third IEEE International Conference on Fuzzy Systems,
Vol. 1, pp. 346–351.
͓3͔ Scott, M., and Antonsson, E. K., 1998, “Aggregation Functions for Engineer-
ing Design Trade-Offs,” Fuzzy Sets Syst., 99͑3͒, pp. 253–264.
͓4͔ Berkowitz, M., 1987, “Product Shape as a Design Innovation Strategy,” J.
Prod. Innovation Manage., 4͑4͒, pp. 274–283.
͓5͔ Bloch, P. H., 1995, “Seeking the Ideal Form: Product Design and Consumer
Response,” J. Marketing, 59͑3͒, pp. 16–29.
͓6͔ Wolter, J. F., Bacon, F. R., Duhan, D. F., and Wilson, R. D., 1989, “How
Designers and Buyers Evaluate Products,” Ind. Mark. Manage., 18, pp. 81–89.
͓7͔ Krishnan, V., and Ulrich, K. T., 2001, “Product Development Decisions: A
Review of the Literature,” Manage. Sci., 47͑1͒, pp. 1–21.
͓8͔ Yamamoto, M., and Lambert, D., 1994, “The Impact of Product Aesthetics on
the Evaluation of Industrial Products,” J. Prod. Innovation Manage., 11͑4͒, pp.
309–324.
͓9͔ Cagan, J., and Vogel, C., 2002, Creating Breakthrough Products, Innovation
From Product Planning to Program Approval Environment and Planning B,
Prentice Hall, Upper Saddle River, NJ.
͓10͔ Nagamachi, M., 1995, “Kansei Engineering: A New Ergonomic Consumer-
Oriented Technology for Product Development,” Int. J. Ind. Ergonom., 15, pp.
3–11.
͓11͔ Lai, H H., Chang, Y M., and Chang, H C., 2005, “A Robust Design Ap-
proach for Enhancing Feeling Quality of a Product: A Car Profile Case Study,”
Int. J. Ind. Ergonom., 35, pp. 445–460.
͓12͔ Chang, H C., Lai, H H., and Chang, Y M., 2006, “Expression Modes Used
by Consumers in Conveying Desire for Product Form: A Case Study of a Car,”
Int. J. Ind. Ergonom., 36, pp. 3–10.
͓13͔ Osgood, C., Suci, G., and Tannenbaum, P., 1957, The Measurement of Mean-
ing, University of Illinois Press, Urbana, IL.
͓14͔ Michalek, J. J., Cervan, O., Papalambros, P. Y., and Koren, Y., 2006, “Balanc-
ing Marketing and Manufacturing Objectives in Product Line Design,” ASME
J. Mech. Des., 128͑6͒, pp. 1196–1204.
͓15͔ Vergeest, J. S. M., Van Egmond, R., and Dumitrescu, R., 2004, “Freeform
Shape Variables of Product Designs and Their Correlation to Subjective Cri-
teria,” Journal of Design Research, 4͑1͒, pp. 1–19.
͓16͔ Orsborn, S., Boatwright, P., and Cagan, J., 2008, “Identifying Product Shape
Relationships Using Principal Component Analysis,” Res. Eng. Des., 18͑4͒,
pp. 163–180.
͓17͔ Von Neumann, J., and Morgenstern, O., 1944, Theory of Games and Economic
Behavior, Princeton University Press, Princeton, NJ.
͓18͔ Keeney, R. L., and Raiffa, H., 1976, Decisions With Multiple Objectives: Pref-
erence and Value Tradeoffs, Cambridge University Press, Cambridge, UK.
͓19͔ Thurston, D. L., 1990, “Multiattribute Utility Analysis in Design Manage-
ment,” IEEE Trans. Eng. Manage., 37͑4͒, pp. 296–301.
͓20͔ Thurston, D. L., 1991, “A Formal Method for Subjective Design Evaluation
With Multiple Attributes,” Res. Eng. Des., 3͑2͒, pp. 105–122.
͓21͔ Otto, K., and Antonsson, E., 1993, “The Method of Imprecision Compared to
Utility Theory for Design Selection Problems,” Proceedings of the 1993 ASME
DTM Conference, pp. 167–173.
͓22͔ Li, H., and Azarm, S., 2000, “Product Design Selection Under Uncertainty and
With Competitive Advantage,” ASME J. Mech. Des., 122͑4͒, pp. 411–418.
͓23͔ Li, H., and Azarm, S., 2002, “An Approach for Product Line Design Selection
Under Uncertainty and Competition,” ASME J. Mech. Des., 124͑3͒, pp. 385–
392.
͓24͔ Maddulapalli, A. K., and Azarm, S., 2006, “Product Design Selection With
Preference and Attribute Variability for an Implicit Value Function,” ASME J.
Mech. Des., 128͑5͒, pp. 1027–1037.
͓25͔ Thurston, D. L., and Carnahan, J., 1992, “Fuzzy Ratings and Utility Analysis
of Preliminary Design Evaluation of Multiple Attributes,” ASME J. Mech.
Des., 114͑4͒, pp. 648–658.
͓26͔ Thurston, D. L., 2001, “Real and Misconceived Limitations to Decision Based
Design With Utility Analysis,” ASME J. Mech. Des., 123͑2͒, pp. 176–182.
͓27͔ Callaghan, A., and Lewis, K., 2000, “A 2-Phase Aspiration-Level and Utility
Theory Approach to Large Scale Design,” Proceedings of the ASME DETC
2000, Baltimore, MD.
͓28͔ Green, P. E., and Rao, V. R., 1971, “Conjoint Measurement for Quantifying
Judgmental Data,” J. Mark. Res., 8, pp. 355–363.
͓29͔ Green, P. E., and Srinivasan, V., 1978, “Conjoint Analysis in Consumer Re-
search: Issues and Outlook,” J. Consum. Res., 5͑2͒, pp. 103–123.
Fig. 20 Summary of verification survey results
Journal of Mechanical Design JUNE 2009, Vol. 131 / 061001-9
Downloaded 07 May 2009 to 128.2.5.228. Redistribution subject to ASME license or copyright; see />͓30͔ Srinivasan, V., Lovejoy, W. S., and Beach, D., 1997, “Integrated Product De-
sign for Marketability and Manufacturing,” J. Mark. Res., 34, pp. 154–163.
͓31͔ Holbrook, M. B., and Moore, W. L., 1981, “Feature Interactions in Consumer
Judgments of Verbal Versus Pictorial Presentations,” J. Consum. Res., 8, pp.
103–113.
͓32͔ Page, A. L., and Rosenbaum, H. F., 1987, “Redesigning Product Lines With
Conjoint Analysis: How Sunbeam Does It,” J. Prod. Innovation Manage.,
4͑2͒, pp. 120–137.
͓33͔ Durgee, J. F., 1988, “Product Drama,” J. Advert., 17, pp. 42–49.
͓34͔ Holbrook, M. B., 1986, “Aims, Concepts, and Methods for the Representation
of Individual Differences in Esthetic Responses to Design Features,” J. Con-
sum. Res., 13, pp. 337–347.
͓35͔ Sawtooth Software, Inc., 2007, “Aca System for Adaptive Conjoint Analysis,”
Technical Report.
͓36͔ Chen, W., Wiecek, M., and Zhang, J., 1999, “Quality Utility—A Compromise
Programming Approach to Robust Design,” ASME J. Mech. Des., 121͑2͒, pp.
179–187.
͓37͔ Zwerina, K., Huber, J., and Kuhfeld, W., 1996, “A General Method for Con-
structing Efficient Choice Designs,” SAS Technical Report No. TS-722E.
͓38͔ Kuhfeld, W. F., Tobias, R. D., and Garratt, M., 2005, “Efficient Experimental
Design With Marketing Research Applications,” SAS Technical Report No.
TS-722D.
͓39͔ Kuhfeld, W., 2004, “Experimental Design, Efficiency, Coding, and Choice
Designs,“ SAS Technical Report No. TS-722C.
͓40͔ Swait, J., and Adamowicz, W., 2001, “The Influence of Task Complexity on
Consumer Choice: A Latent Class Model of Decision Strategy Switching,” J.
Consum. Res., 28, pp. 135–148.
͓41͔ Deshazo, J. R., and Fermo, G., 2002, “Designing Choice Sets for Stated Pref-
erence Methods: The Effects of Complexity on Choice Consistency,” J. Envir.
Econom. Manage., 44͑1͒, pp. 123–143.
͓42͔ Luce, R. D., 1959, Individual Choice Behavior: A Theoretical Analysis, John
Wiley and Sons, New York.
͓43͔ Luce, R. D., 1977, “The Choice Axiom After Twenty Years,” J. Math. Psy-
chol., 15, pp. 215–233.
͓
44͔ Bradley, R. A., and Terry, M. E., 1952, “Rank Analysis of Incomplete Block
Designs,” Biometrika, 39, pp. 324–345.
061001-10 / Vol. 131, JUNE 2009 Transactions of the ASME
Downloaded 07 May 2009 to 128.2.5.228. Redistribution subject to ASME license or copyright; see />