Báo cáo khoa học: Light-induced reactions of Escherichia coli DNA photolyase monitored by Fourier transform infrared spectroscopy pot
Bạn đang xem bản rút gọn của tài liệu. Xem và tải ngay bản đầy đủ của tài liệu tại đây (287.53 KB, 12 trang )
Light-induced reactions of Escherichia coli DNA
photolyase monitored by Fourier transform infrared
spectroscopy
Erik Schleicher
1,
*, Benedikt Heßling
2
, Viktoria Illarionova
1
, Adelbert Bacher
1
, Stefan Weber
3
,
Gerald Richter
1,
† and Klaus Gerwert
2
1 Lehrstuhl fu
¨
r Organische Chemie und Biochemie, Technische Universita
¨
tMu
¨
nchen, Germany
2 Lehrstuhl fu
¨
r Biophysik, Ruhr-Universita
¨
t-Bochum, Germany
3 Freie Universita
¨
t Berlin, Fachbereich Physik, Berlin, Germany
Cyclobutane pyrimidine dimers (Pyr<>Pyr) and pyri-
midine–pyrimidone (6–4) photoproducts are the predo-
minant structural modifications resulting from exposure
of DNA to ultraviolet light [1,2]. The structure of
Pyr<>Pyr was elucidated by Blackburn and Davies
already 40 years ago [3,4]. Both photoproducts result
from 2p+2p cyclo-additions. The potentially mutagenic
or lethal modifications [5] must be repaired in order to
ensure cell survival and genetic stability. This can be
effected by excision-repair or by photoreactivation
Keywords
DNA photolyase; DNA repair; FT-IR;
pyrimidine dimer; stable-isotope labelling
Correspondence
G. Richter, School of Biological and
Chemical Sciences, University of Exeter,
Stocker Rd, Exeter, EX4 4QD, UK
Fax: +44 1392 26 3434
Tel: +44 1392 26 3494
E-mail:
K. Gerwert, Lehrstuhl fu
¨
r Biophysik,
Ruhr-Universita
¨
t-Bochum, Universita
¨
tsstr.
150, 44780 Bochum, Germany
Fax: +49 2343 21 4238
Tel: +49 2343 22 4461
E-mail:
*Present address
Freie Universita
¨
t Berlin, Fachbereich Physik,
Arnimallee 14, 14195 Berlin, Germany
†Present address
School of Biological and Chemical Sciences,
University of Exeter, UK
(Received 9 December 2004, revised 10
February 2005, accepted 16 February 2005)
doi:10.1111/j.1742-4658.2005.04617.x
Cyclobutane-type pyrimidine dimers generated by ultraviolet irradiation of
DNA can be cleaved by DNA photolyase. The enzyme-catalysed reaction
is believed to be initiated by the light-induced transfer of an electron from
the anionic FADH
)
chromophore of the enzyme to the pyrimidine dimer.
In this contribution, first infrared experiments using a novel E109A mutant
of Escherichia coli DNA photolyase, which is catalytically active but unable
to bind the second cofactor methenyltetrahydrofolate, are described. A
stable blue-coloured form of the enzyme carrying a neutral FADH radical
cofactor can be interpreted as an intermediate analogue of the light-driven
DNA repair reaction and can be reduced to the enzymatically active
FADH
)
form by red-light irradiation. Difference Fourier transform infra-
red (FT-IR) spectroscopy was used to monitor vibronic bands of the blue
radical form and of the fully reduced FADH
)
form of the enzyme.
Preliminary band assignments are based on experiments with
15
N-labelled
enzyme and on experiments with D
2
O as solvent. Difference FT-IR mea-
surements were also used to observe the formation of thymidine dimers by
ultraviolet irradiation and their repair by light-driven photolyase catalysis.
This study provides the basis for future time-resolved FT-IR studies which
are aimed at an elucidation of a detailed molecular picture of the light-
driven DNA repair process.
Abbreviations
DTT, dithiothreitol; FT-IR, Fourier transform infrared; MTHF, 5,10-methenyltetrahydrofolylpolyglutamate; Pyr<>Pyr, cyclobutane pyrimidine
dimmer.
FEBS Journal 272 (2005) 1855–1866 ª 2005 FEBS 1855
mediated by DNA photolyases. Specifically, photolyases
catalyse the light-driven cleavage of the cyclobutane ring
of tricyclic pyrimidine dimers, and (6–4) photolyases
cleave the pyrimidine (6–4) pyrimidone photoproduct
[6,7]. Both enzymes have similar sequences [7,8]. The
protein family also includes the cryptochromes which
participate in the regulation of circadian rhythms but
appear to be devoid of DNA repair activity [9–11].
The 3D structures of DNA photolyases (EC 4.1.99.3)
from Escherichia coli [12], Anacystis nidulans [13]
and Thermus thermophilus [14] have been determined
by X-ray crystallography. All enzymes use anionic
reduced FADH
)
as redox-active cofactor [15–17]. Both
5,10-methenyltetrahydrofolylpolyglutamate (MTHF)
and 8-hydroxy-5-deazaflavin serve as light-harvesting
cofactors in DNA photolyases [18–20].
DNA photolyase of E. coli is typically isolated as a
blue-coloured protein carrying a neutral flavin radical,
FADH
•
, as a chromophore. This catalytically inactive
form can be converted to the enzymatically active form
by photoreduction. Tryptophan 306 is believed to serve
as the electron donor for this reaction on basis of
site-specific mutagenesis studies [21], time-resolved
electron paramagnetic resonance [22] and transient
optical absorption experiments [23].
Photolyase in the catalytically active FADH
)
form
binds light-damaged DNA in a light-independent step
with high affinity [24,25]. Subsequent to photoexcita-
tion of the FADH
)
cofactor by direct absorption of
near-ultraviolet or visible light or by Fo
¨
rster-type
energy transfer from the MTHF antenna chromophore
[26], the excited-state FADH
)
chromophore is believed
to donate an electron to the pyrimidine dimer in the
DNA, thus generating a substrate radical anion and a
neutral FADH
•
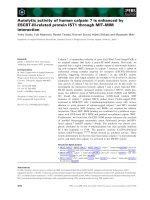
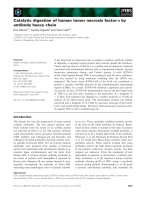
radical [17,22,27]. The dimeric pyrimi-
dine radical anion splits into pyrimidine monomers,
and the excess electron is transferred back to the
FADH
•
cofactor to regenerate the initial redox state
of the flavin, FADH
)
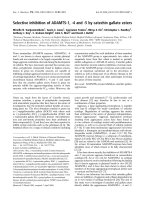
(Fig. 1).
This paper describes the first examination of DNA
photolyase by Fourier transform infrared (FT-IR)
spectroscopy. Specific infrared bands observed in dif-
ference FT-IR spectra are assigned to various photo-
processes in this experimental system. Hence, this
study provides the basis for future time-resolved
FT-IR studies which are aimed at an elucidation of a
detailed molecular picture of the light-driven DNA
repair process.
Results
Construction of a DNA photolyase E109A mutant
MTHF, the second cofactor of E. coli DNA photo-
lyase, acts as a light-harvesting antenna. However, the
protein has a relatively low affinity for this cofactor
which is therefore partially lost during purification
[28]. Thus, individual wild-type enzyme batches typi-
cally differ in their MTHF content. Heterogeneity of
the enzyme with respect to the chromophores, how-
ever, is a serious handicap for spectroscopic studies.
In order to obtain enzyme batches with reproducible
absorption properties, we therefore decided to con-
struct a mutant protein that does not bind MTHF but
is nevertheless enzymatically active.
X-ray structure analysis has shown that the posi-
tion-2 amino group and the position-3 imino group of
the pteridine moiety of MTHF form hydrogen bonds
Fig. 1. Putative repair reaction mechanism
of DNA photolyase.
FT-IR on DNA photolyase E. Schleicher et al.
1856 FEBS Journal 272 (2005) 1855–1866 ª 2005 FEBS
with the c-carboxylic group of glutamate residue 109
[12]. Therefore we replaced the glutamate codon by a
codon specifying alanine using PCR-driven site-direc-
ted mutagenesis. A recombinant Bacillus subtilis strain
carrying the resulting plasmid p602E109A expressed
DNA photolyase to a level of about 15% of total cell
protein. Purification by published procedures afforded
the blue radical form of the mutant enzyme. The yield
of isolated protein was about twofold higher than that
obtained with the recombinant E. coli strain described
earlier [29].
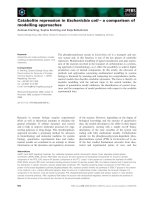
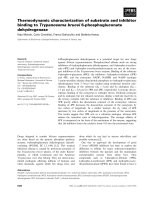
The blue radical forms of wild-type photolyase and
the E109A mutant protein show similar absorption
spectra in the visible range above 450 nm (Fig. 2A).
At shorter wavelengths, however, the absorbance of
the mutant protein is substantially lower than that of
the wild-type enzyme. The absorbance difference
between the wild-type and the mutant enzyme
(Fig. 2B) closely resembles the spectrum of enzyme-
bound MTHF [30].
Both the blue radical form of wild-type and mutant
protein could be converted into the catalytically active
form by photoreduction [15]. The photobleached wild-
type and mutant protein forms were both devoid of
significant absorbance at wavelengths above 500 nm
(Fig. 2). In the short-wavelength range, the absorbance
of the mutant protein was again substantially lower
than that of the wild-type enzyme (Fig. 2A), and the
absorbance difference between the proteins under
study was again similar to the spectrum of MTHF
(Fig. 2B). These data show that the mutant protein is
devoid of MTHF, and its long-wavelength absorption
is exclusively due to the flavin chromophore. All subse-
quent experiments were performed with the catalyti-
cally active mutant protein [catalytic activity was
measured by absorbance changes of UV-irradiated
oligo-(dT)
18
DNA at 260 nm (data not shown)] which
appears as a valid model for the study of the DNA
photorepair process.
Photoactivation of the catalytically blue radical
form of DNA photolyase
Overexpression strains of E. coli can generate large
amounts of recombinant DNA photolyase in the cata-
lytically active dihydroflavin form, but the typical iso-
lation procedures are conducive to the conversion of
the enzyme into a catalytically inactive form character-
ized by strong optical absorption in the range 400–
650 nm. That blue-coloured species contains the flavin
chromophore in the neutral radical form as shown in
some detail by EPR analyses [20,29,31]. The catalyti-
cally active pale yellow dihydroflavin form can be
easily regenerated by photoreduction of the radical
form in the presence of an appropriate electron donor
such as dithiothreitol (see Fig. 3).
With regard to its electronic state, the stable but cata-
lytically inactive blue radical form of the enzyme
appears as a valid model of the transient flavin radical
species that is believed to be involved in the catalytic
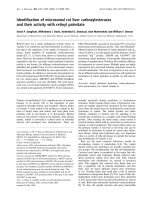
Fig. 2. UV ⁄ vis spectra of E. coli DNA photolyase at different redox
states. (A) Dashed line, wild-type DNA photolyase in the blue radi-
cal form; dotted line, wild-type DNA photolyase in the reduced
form; solid line, E109A DNA photolyase in the blue radical form;
short dotted line, E109A DNA photolyase in the reduced form. (B)
Solid line, difference spectrum of wild-type and E109A DNA photo-
lyase both in the radical form; dashed line, difference spectrum of
wild type and E109A DNA photolyase both in the fully reduced
form.
Fig. 3. Schematic photoreduction of the flavin semiquinone radical.
E. Schleicher et al. FT-IR on DNA photolyase
FEBS Journal 272 (2005) 1855–1866 ª 2005 FEBS 1857
DNA-repair cycle (Fig. 1). Furthermore, a flavin radical
is also involved in the light-driven photoreduction of the
blue radical enzyme species. We therefore decided to
study this photoreduction of the stable blue radical form
of the enzyme to the catalytically competent FADH
)
form by FT-IR spectroscopy.
Infrared spectra of 1.2-mm solutions of blue radical
enzyme were measured at 4 °C in the dark. The
enzyme samples were then irradiated for 3 min with
red light (k > 530 nm). Infrared spectra were again
obtained and were subtracted from the respective pre-
irradiation spectra affording the difference spectrum
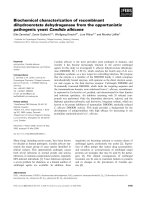
shown in Fig. 4A. Positive as well as negative differ-
ence bands with relative intensities up to 0.1% were
observed. Positive signals represent vibrational transi-
tions characteristic of the enzymatically active FADH
)
form, and negative bands indicate vibrational transi-
tions of the blue radical form.
The reproducibility of the measurements was excel-
lent. As an example, the traces A and A¢ in Fig. 4 were
obtained with independently prepared enzyme batches.
The close similarity between the infrared characteristics
of the two samples is illustrated by subtraction of trace
A¢ from trace A affording the double difference spec-
trum shown as trace D in Fig. 4.
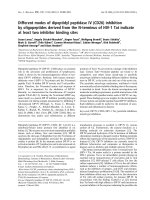
The most salient features in the difference spectra
(Fig. 4A) were bands at 1532 and 1396 cm
)1
, and
changes in the amide-I (1600–1700 cm
)1
) region.
The frequencies of infrared bands can be modulated
by isotope substitution. Growth of the recombinant
E. coli strain used for production of photolyase on
minimal medium supplemented with
15
NH
4
Cl as the
sole source of nitrogen afforded enzyme with
15
N sub-
stitution of most amino acids (with the exception of
tryptophan, lysine, threonine and methionine which
were added to the culture medium in unlabelled form;
whereas they may be partially
15
N-labelled by reversi-
ble transamination, their
15
N abundance has not been
determined). Moreover, since the production strain is
autotrophic with respect to riboflavin biosynthesis,
the flavin chromophore of the biosynthetically labelled
enzyme is also rendered universally
15
N labelled.
Photoreduction of the
15
N-labelled blue radical
enzyme afforded difference infrared spectra with a sig-
nificantly modified pattern of absorption bands attrib-
uted to the blue radical form (negative bands of trace
B in Fig. 4) and to the catalytically active FADH
)
form obtained after photoreduction (positive bands of
trace B in Fig. 4). The difference spectrum is qualita-
tively similar to trace A, but the intense negative band
at 1532 cm
)1
in trace A is shifted to 1524 cm
)1
and
the positive band at 1396 cm
)1
in trace A has disap-
peared.
A more detailed assessment of the impact of
15
N
substitution is possible by inspection of the double dif-
ference in trace E which is obtained by subtraction of
trace B from trace A in Fig. 4. In contrast to trace D
in Fig. 4, the difference bands do not cancel out. This
indicates that numerous vibration bands have shifted
as a consequence of the universal
15
N labelling. Major
differences are especially observed in the region
between 1500 and 1700 cm
)1
.
Acidic protons in the protein can easily be
exchanged by dialysis against D
2
O. The photoreduc-
tion of such treated enzyme sample afforded difference
infrared spectra indicating frequency modulation of a
considerable number of vibration modes. The photo-
Fig. 4. FT-IR difference spectra of DNA photolyase. (A, A¢) Photore-
duction of DNA photolyase (two different batches of protein). (B)
Photoreduction of [U-
15
N]-DNA photolyase. (C) Photoreduction of
DNA photolyase in D
2
O-containing buffer; double differences are
shown in lanes D–F. (D) Subtraction of A¢ from A. (E) Subtraction
of (B) from (A). (F) Subtraction of (C) from (A). (DA ¼ absorbance
difference [absorbance units], DDA ¼ double absorbance difference
[absorbance units]).
FT-IR on DNA photolyase E. Schleicher et al.
1858 FEBS Journal 272 (2005) 1855–1866 ª 2005 FEBS
reduction of the radical form in D
2
O buffer is shown
in trace C in Fig. 4, which is again qualitatively similar
to trace A, but the negative band at 1532 cm
)1
has
shifted to 1530 cm
)1
, and the band at 1396 cm
)1
in
trace A appears with substantially reduced intensity.
The residual intensity at this frequency (trace C of
Fig. 4) can be attributed to incomplete H«D
exchange.
Again, the impact of deuterium replacement of
acidic protons is best observed after subtraction of
trace C from trace A affording the double-difference
spectrum shown as trace F in Fig. 4. As in the case
with
15
N substitution, the partial deuteration has
affected the frequencies of numerous signals, notably
in the range between 1500 and 1700 cm
)1
.
Photodamaging of thymidine oligonucleotides
Oligo-(dT)
18
DNA was used to monitor the formation
of thymidine dimers by difference FT-IR spectrometry.
An excimer laser with its emission at 308 nm was used
to irradiate a 4-mm solution of oligothymidine placed
inside the infrared spectrometer. The subtraction of an
infrared spectrum acquired prior to UV-irradiation
from a spectrum obtained after irradiation afforded
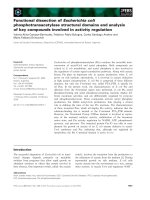
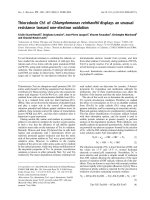
the difference spectrum shown as trace A in Fig. 5.
The photoreaction results in positive difference bands
at 1464, 1396 and 1302 cm
)1
which belong to the
photodamaged form of DNA. Negative difference
bands are observed at 1483, 1424 and 1289 cm
)1
and
belong to undamaged DNA. In summary, photodam-
age afforded highly characteristic and reproducible
changes in the vibrational spectrum of DNA.
Photodamaging of 5-fluoro-uridine
oligonucleotides
Similar irradiation experiments were performed with
dodecameric deoxyoligonucleotide where the methyl
group is replaced by fluorine (deoxy-5-fluoro-uridine).
The difference spectrum observed with this oligo-
nucleotide (Fig. 5B) is similar to that observed for the
photodamage of oligo-deoxythymidine. The spectrum
of the irradiated deoxy-5-fluorouridine oligonucleotide
shows major positive difference bands at 1741, 1460
and 1392 cm
)1
and negative bands at 1715, 1410, 1364
and 1274 cm
)1
.
DNA photorepair
The subsequent experiments addressed the enzyme-
mediated repair of UV-damaged DNA which had been
prepared by broadband ultraviolet irradiation of the
oligo-(dT) DNA substrate. Permanganate titration of
the irradiated DNA showed that about 50% of the
bases had been converted to dimers (data not shown).
Samples containing a mixture of photodamaged DNA
and blue radical enzyme at an approximate fourfold
excess of thymidine dimers with respect to enzyme
molecules were irradiated in a two-step procedure.
Initially, the enzyme was photoreduced to the catalyti-
cally active form by irradiation with red light
(> 530 nm). This reaction was followed by difference
FT-IR spectrometry which afforded a difference spec-
trum closely similar to that shown as trace A in Fig. 4
(data not shown) and confirmed that photorepair of
DNA had not occurred. This is in agreement with
published data indicating that photorepair requires
irradiation in the wavelength range below 530 nm [32].
The sample was then irradiated with white light for
a period of 2 min. During this irradiation period,
infrared spectra were recorded at intervals. Subtracting
the spectrum obtained before the white-light irradia-
tion from each of the subsequent spectra afforded a
series of difference spectra shown in Fig. 6A. These
difference spectra comprise numerous positive as well
as negative bands.
A plot at various amplitudes vs. time indicates that
absorption differences at specific wavelengths progress
with significantly different kinetics (Fig. 6B). More
specifically, a number of bands reach saturation levels
within a period of about 10 min (e.g. bands at 1464,
1396, 1302 and 1244 cm
)1
, whereas other bands
Fig. 5. FT-IR difference spectra of DNA. (A) Oligo-(dT)
18
DNA
photodamage with UV radiation in the absence of photolyase. (B)
Oligo-(deoxy-5-fluorouracil)
12
DNA photodamage with UV radiation
in the absence of photolyase (DA ¼ absorbance difference [absor-
bance units]).
E. Schleicher et al. FT-IR on DNA photolyase
FEBS Journal 272 (2005) 1855–1866 ª 2005 FEBS 1859
required up to about twice as much time to reach
saturation levels (e.g. bands at 1540 and 1520 cm
)1
).
For a preliminary interpretation of the infrared dif-
ference bands accompanying the light-driven enzymatic
repair of photodamaged DNA, the traces in Fig. 6A
can be compared with the difference spectrum describ-
ing the UV-light driven formation of thymidine dimers
(trace A in Fig. 5). For ease of viewing, trace A of
Fig. 5 is depicted again in Fig. 7 as trace A, and the
time trace after 20 min of white-light illumination in
Fig. 6A is depicted again in Fig. 7 as trace B. It is
obvious that a number of difference bands appear in
these traces with opposite signs and essentially cancel
out upon summation of traces A and B affording trace
C. Notably, the bands that cancel out in this way are
essentially those that reach saturation at early times in
the photorepair experiments shown in Fig. 6B. This
suggests that these bands are characteristic of thymi-
dine dimers which are either formed by UV radiation
or consumed in the enzyme-mediated photorepair
experiments.
Discussion
The study of presteady-state kinetics has been pre-
dominantly the domain of absorption and fluorescence
spectroscopy in the visible and ultraviolet ranges.
These methods combine high sensitivity and selectivity
with excellent time resolution down to the level of fem-
toseconds. However, many enzyme substrates and
reaction intermediates are devoid of appropriate chro-
mophoric groups. Moreover, it is difficult to assign
optical transients to specific intermediate structures
due to the paucity of structural information in the visi-
ble and ultraviolet frequency ranges.
Infrared spectroscopy combines the advantages of
sensitivity and high time resolution with a wealth of
spectroscopic information on the reacting species and
can be applied to virtually any reactant. However, the
interpretation is hampered by the fact that virtually all
Fig. 6. Repair FT-IR difference spectra measured at time intervals
of 2 min (A). The relative change of selected bands with time (B)
(DA ¼ absorbance difference [absorbance units]).
Fig. 7. FT-IR difference spectra of DNA photolyase and DNA. (A)
Oligo-(dT)
18
DNA photodamage with UV radiation in the absence of
photolyase. (B) Photoreactivation of DNA photolyase followed by
DNA photorepair (after 20 min white-light irradiation). Addition of
spectra A and B is shown in lane C (DA ¼ absorbance difference
[absorbance units]).
FT-IR on DNA photolyase E. Schleicher et al.
1860 FEBS Journal 272 (2005) 1855–1866 ª 2005 FEBS
components of the reaction mixture contribute to the
infrared absorption. This lack of selectivity in the
vibration frequency range can be addressed in different
ways. Notably, selective stable-isotope labelling can be
used as a basis for band assignments.
Several aspects of DNA photolyase are favourable
for an in depth presteady-state kinetic analysis. (a) By
ultra-short laser pulses the enzyme reaction can be
triggered with a high quantum yield. (b) The FAD
cofactor and the DNA substrate can be observed in
the visible and ⁄ or ultraviolet ranges as well as in the
IR range. (c) Selective stable-isotope labelling is feasi-
ble for the FAD chromophore, the apoenzyme and the
DNA substrate.
This study was designed to explore the potential of
infrared spectroscopy for this enzymatic system. The
data show that several chemical processes can be
observed with high reproducibility in the infrared fre-
quency range. Most notably, we were able to monitor
the enzymatic repair of DNA. Moreover, it was shown
that stable-isotope labelling can be used for the pur-
pose of signal assignment to specific molecular vibra-
tions. Clearly, selective labelling of the flavin cofactor,
the substrate and of specific amino acid types in the
apoenzyme should be able to generate a wealth of
information at a molecular level.
Although all molecular components present in the
samples used in this work are expected to contribute
to the infrared envelope, the photochemical processes
studied influence predominantly the structures of the
flavin chromophore and the pyrimidine moiety of
DNA. Changes in these structural motifs are therefore
more likely to afford difference infrared bands of sig-
nificant intensity as compared to the apoprotein. With
these assumptions, some tentative signal assignments
can be made. These are discussed below.
Photoactivation of DNA photolyase
Red-light irradiation selectively induced the one-elec-
tron reduction of the blue radical enzyme and did not
cause any changes in the DNA (neither photodamage
nor photorepair). The accompanying 1532 cm
)1
differ-
ence band was not affected by the presence of intact
or photodamaged DNA (data not shown). Universal
15
N labelling or replacement of acidic protons by deu-
terium caused bathochromic shifts of this band of 8
and 2 cm
)1
, respectively (traces B and C in Fig. 4).
Previous resonance Raman experiments on E. coli
DNA photolyase [33] showed an intense band at
1528 cm
)1
which experienced bathochromic shifts of 8
or 2 cm
)1
in samples which were labelled with
15
Nor
which have been treated with D
2
O, respectively. This
band was also observed in more recent resonance
Raman experiments [34]. Albeit located at 1529 cm
)1
,
no significant shift was observed after D
2
O treatment.
Assuming that the slight offset between the Raman
and infrared bands (1528 ⁄ 1529 cm
)1
vs. 1532 cm
)1
)is
due to calibration uncertainties, we propose that this
band can be attributed to the flavin chromophore in
the blue radical form on the basis of the resonance
Raman activity.
In photoreduction experiments with photolyase in
buffer containing D
2
O (trace C in Fig. 4), the absorp-
tion signal at 1396 cm
)1
(attributed to the FADH
)
form) showed significantly reduced intensity; the resi-
dual intensity at 1396 cm
)1
was attributed to incom-
plete H«D exchange. This band can be tentatively
assigned to H(5) in plain rocking mode of FADH
)
.
Deuterium substitution of the chromophore would be
expected to shift this band to the frequency range
around 900 cm
)1
; however, the detection of the
hypothetical band was not possible due to the insuffi-
cient transparency of the sample in this frequency
range. A new difference band observed after H«D
exchange at 1423 cm
)1
is indicative of a coupled vibra-
tion mode at 1396 cm
)1
. Additional support for this
assumption comes from uniform isotopic
15
N labelling
of DNA photolyase. Photoreduction results in a split-
ting of the former absorbance at 1396 cm
)1
into two
new lines at 1382 and 1405 cm
)1
indicating the contri-
bution of at least two modes (Fig. 4B). We find dis-
tinct absorbance changes in the range of amide-I
vibrations (1675 ⁄ 1660 ⁄ 1644 ⁄ 1625 cm
)1
) showing some
variation in their relative intensity. As no absorbance
change is observed above 1700 cm
)1
, the C¼O stretch-
ing range of protonated carbonyls, a protonation or
environmental change of carbonyl groups during
photoreduction is excluded.
Photodamage of DNA
The ultraviolet irradiation of DNA afforded
several positive as well as negative difference bands
which can be attributed to the consumption (negative
difference bands at 1425, 1326 and 1289 cm
)1
) and the
formation (positive difference bands at 1464, 1396 and
1302 cm
)1
) of thymidine dimers, respectively.
An experiment with DNA carrying fluorouracil
instead of thymidine afforded a qualitatively similar
difference spectrum, but minor shifts in the bands
appeared that are qualitatively reproduced by model
calculations of the vibration modes of thymidine as
compared to fluorouridine: Tavan and coworkers have
recently calculated an approximate 20-cm
)1
blue shift
both of the C(2)¼O(2) and C(4)¼O(4) carbonyl-stretch
E. Schleicher et al. FT-IR on DNA photolyase
FEBS Journal 272 (2005) 1855–1866 ª 2005 FEBS 1861
vibrations due to replacement of fluorouracil with thy-
midine [35]. Hence, this shift is required to disentangle
the carbonyl stretch vibrations of the thymidine dimer
from those of carbonyl vibrations from the protein
and dominant water vibrations. By exploiting this fre-
quency shift, the strong vibration band at 1741 cm
)1
is
assigned to the C(4)¼O(4) carbonyl-stretch vibration
of the fluorouracil dimer and the strong vibration
band at 1715 cm
)1
to the C(4)¼O(4) carbonyl-stretch
vibration of fluorouracil monomer. The examination
of fluorouracil-containing substrate therefore provides
an important tool for the investigation of carbonyl
vibrations involved in the DNA-repair process.
Enzyme-catalysed photorepair of photodamaged
DNA
For a preliminary interpretation of the infrared differ-
ence bands accompanying the light-driven enzymatic
repair of photodamaged DNA, the traces in Fig. 6A can
be compared with the difference spectrum describing the
UV-light driven formation of thymidine dimers (trace A
in Figs 5 and 7). The major difference bands between
1270 cm
)1
and 1470 cm
)1
(Figs 6A and 7B) can be asso-
ciated with thymidine-dimer repair under quasi-steady-
state conditions. Although experimental conditions vary
between data reported by Jorns and coworkers, the
overall rate for thymidine repair is in the same range
[36] and clearly shows the potential of FT-IR spectro-
scopy for direct measuring of kinetic rate constants.
However, the photorepair is also accompanied by
certain additional difference bands in the spectral
range of 1520–1540 cm
)1
. A preliminary kinetic analy-
sis shows that these bands appeared at a slower rate as
compared to those which can be clearly associated
with DNA repair. Hence, the bands in this range
represent a slower secondary process which cannot yet
be assigned to a specific molecular process on the basis
of the available data.
The antisymmetric PO
2
–
stretching vibration is a
characteristic marker for nucleic-acid backbone confor-
mation and is located between 1220 and 1240 cm
)1
,
depending on the helical conformation [37]. When irra-
diating oligo-(dT)
18
DNA, the conformation of the
backbone of a single-strand DNA is not expected to
change dramatically. It is well known from foot-
printing, crystallographic and NMR studies that the
backbone conformation is substantially distorted in
double-stranded DNA containing a single Pyr<>Pyr
[38–40]. However, this should be different in single-
stranded DNA, which is known to be much more
flexible in solution. Therefore, no major difference band
is expected in this frequency region (trace A in Fig. 5). If
thymidine dimer repair occurs, the conformation of
the backbone should, on the other hand, change while
the enzyme–product complex decays (or the enzyme–
substrate complex is formed), because the chemical
environment of the backbone phosphate is altered: In
an enzyme–DNA complex, electrostatic interaction of
backbone phosphate and basic residues of the DNA
photolyase significantly contribute to the DNA binding
of the enzyme [41–44]. Therefore, an additional
difference band at 1244 ⁄ 1224 cm
)1
can be detected in
Fig. 7B. Interestingly, the kinetics of the formation of
the positive band at 1224 cm
)1
, which can be assigned
to the formation of enzyme-unbound oligo-(dT)
18
DNA, are different to that of the bands assigned to
thymidine dimer repair (Fig. 6B).
Time constants under quasi-steady-state conditions
for photolyase binding to UV-damaged DNA in the
millisecond range have been reported by direct methods
using stopped-flow experiments [34]. They represent the
rate determining steps of substrate-to-enzyme binding,
which is expected to vary depending on the experimental
conditions used. Given the highly viscous buffer solu-
tion [50% (v ⁄ v) glycerol], the low temperature (4 °C) at
which our FT-IR experiments were carried out, and the
higher relative substrate concentration, it is not surpris-
ing that significantly longer time constants (approximate
350 s) are observed in our studies (Fig. 6B).
In summary, characteristic infrared bands assigned
to the enzyme as well as the DNA substrate can be
associated with DNA photorepair. These observations
can form the basis for time-resolved single turnover
experiments, which require time-resolved FT-IR
experiments on a picosecond timescale.
Experimental procedures
Materials
Restriction enzymes and DNA ligase were from New Eng-
land BioLabs (Frankfurt am Main, Germany) and from
Roche Diagnostics (Mannheim, Germany). Taq DNA poly-
merase was from Eurogentec (Seraing, Belgium). Dithio-
threitol was from Sigma. Oligonucleotides were custom-
synthesized by MWG Biotech (Ebersberg, Germany).
15
NH
4
Cl was from Cambridge Isotope Laboratories (And-
over, MA, USA). Microorganisms and plasmids are sum-
marized in Table 1.
Site directed mutagenesis
A procedure modified after Marini et al. [45] was used for
site-directed mutagenesis. Plasmid pEPHR [29] was used as
template. All primers used are shown in Table 1.
FT-IR on DNA photolyase E. Schleicher et al.
1862 FEBS Journal 272 (2005) 1855–1866 ª 2005 FEBS
The general scheme of mutagenic PCR involved two
rounds of amplification cycles using one mismatch and two
flanking primers (primers M1, Rct and Ply5, Table 1). Dur-
ing the first round, five amplification cycles were carried
out with the respective mismatch primer and with one of
the flanking primers. The second flanking primer was then
added and the reaction was continued for 10 additional
cycles. The PCR fragment was cleaved with the restriction
endonucleases EcoRI and BamHI and was then ligated into
the expression vector pNCO113 yielding the plasmid
pE109A. For methylation of DNA, this construct was
electroporated into the E. coli strain XL1-Blue and plated
on Luria–Bertani (LB) agar containing 150 mgÆL
)1
ampicil-
lin. The plasmid was reisolated and electroporated into the
expression strain M15[pREP4], which was then plated on
LB agar containing 150 mgÆL
)1
ampicillin and 15 mgÆL
)1
kanamycin. Transformants were monitored for expression
of DNA photolyase.
Construction of an expression plasmid
Plasmid pE109A was digested with restriction endonu-
cleases EcoRI and BamHI. The resulting 1416-bp fragment
was isolated and was ligated into the vector p602-CAT.
The resulting plasmid p602E109A was electrotransformed
into E. coli M15[pGB3] cells, which were plated on LB agar
containing 150 mgÆL
)1
ampicillin and 15 mgÆL
)1
kanamy-
cin. The plasmid p602E109A was reisolated and electro-
transformed into B. subtilis BR151 cells [46] which were
plated on LB agar containing 15 mgÆL
)1
kanamycin and
10 mg L
)1
erythromycin.
Cultivation of bacterial cells
The recombinant B. subtilis strain harbouring plasmids
p602E109A and pBL1 was cultured in baffled 2-L Erlen-
meyer flasks containing 700 mL LB medium supplemented
with 15 mg L
)1
kanamycin and 10 mg L
)1
erythromycin.
The cultures were incubated at 32 °C with shaking. At
an optical density of 0.7 (600 nm), isopropylthio-b-d-
galactopyranoside was added to a final concentration of
1mm, and incubation was continued overnight. The cells
were harvested by centrifugation and stored at )20 °C.
Preparation of
15
N-labelled DNA photolyase
The recombinant B. subtilis strain harbouring the plasmids
p602E109A and pBL1 was cultured in baffled 2-L
Erlenmeyer flasks with 700 mL mineral medium containing
(L
)1
), 6 g Tris, 0.35 g K
2
HPO
4
, 5 g glucose, 0.138 g
MgSO
4
,1g
15
NH
4
Cl, 5.55 mg CaCl
2
, 4 mL vitamin con-
centrate, 1 mL trace metal mix, 40 mg tryptophan, 40 mg
threonine, 40 mg lysine, 40 mg methionine, 15 mg kana-
mycin, 10 mg erythromycin. The pH was adjusted to 7.4 by
the addition of 2 m hydrochloric acid. Vitamin concentrate
contained (per L) 20 mg pyridoxamine hydrochloride, 10 mg
thiamine hydrochloride, 20 mg p-aminobenzoic acid, 20 mg
calcium pantothenate, 5 mg biotin, 10 mg folic acid, 15 mg
nicotinic acid, 100 lg cyanocobalamine. Trace metal mix
contained (per L) 16.0 g MnCl
2
Æ4H
2
O, 1.5 g CuCl
2
Æ2H
2
O,
27.0 g of CoCl
2
Æ6H
2
O, 37.5 g FeCl
3
Æ6H
2
O, 3.3 g H
3
BO
3
,
8.4 g zinc acetate, 40.8 g sodium citrate, 5 g EDTA.
Cultures were incubated at 32 °C with shaking. At an
optical density of 0.7–0.9 at 600 nm, isopropylthio-
b-d-galactopyranoside was added to a final concentration of
1mm, and incubation was continued for 10 h. The cells were
then harvested by centrifugation and stored at )20 °C.
Isolation of DNA photolyase
DNA photolyase was prepared essentially as described pre-
viously [29]. The ammonium sulphate precipitation step
was performed after chromatography on Heparin Sephar-
ose. Enzyme concentration was monitored photometrically
(e
580
¼ 4800 m
)1
cm
)1
) [47].
Buffer exchange
Samples were transferred into the desired buffer [usually
containing 50 mm Hepes pH 7.0, 100 mm NaCl, 10 mm
dithiothreitol, 50% (v ⁄ v) glycerol] by repeated dilution and
ultrafiltration through C30 microconcentrators (Pall Gel-
man, Dreieich, Germany) at 4 °C. Experiments in D
2
O
Table 1. Bacterial strains, plasmids and primers.
Strain or
plasmid
Genotype or relevant
characteristic Reference
E. coli
M15[pREP4] lac,ara,gal,mtl,recIA
+
,uvr
+
[pREP4,lacI, kan
r
]
[49]
M15[pGB3] lac,ara,gal,mtl,recIA
+
,uvr
+
[pGB3,lacI, bla
r
]
[50]
XL1-Blue recA1, endA1, gyrA96, thi-1, hsdR17,
supE44, relA1, lac[F¢, proAB,
lacI
q
Z?M15, Tn10 (tet
r
)]
[51]
B. subtilis
BR151[pBL1] trpC2,lys-3,metB10 [pBL1,lacI,ery
r
][46]
Plasmids
pNCO113 expression vector for E. coli [50,52]
pEPHR pNCO113 with the phr gene of E. coli [29]
pE109A pNCO113 with the phr gene of E. coli
with mutation Glu109Ala
This study
p602-CAT expression vector for B. subtilis [53]
p602E109A p602-CAT with the phr gene of
E. coli with mutation Glu109Ala
This study
Primers (5¢-3¢)
M1 (forward) GAGCGGATAACAATTTCACACAG
Rct (reverse) ACAGGAGTCCAAGCTCAGCTAATT
Ply5 (mismatch) CCCGGGCCCGCGCATTCACTTCATACTG
E. Schleicher et al. FT-IR on DNA photolyase
FEBS Journal 272 (2005) 1855–1866 ª 2005 FEBS 1863
were carried out at pH 7.0 (uncorrected glass electrode
reading). The dilution ⁄ concentration cycle was repeated five
times to give a final D
2
O enrichment of 95–99%.
Preparation of substrate
A 4-mm solution of single-strand oligo-(dT)
18
DNA was irra-
diated for 45 min using a 254 nm G8W UV-lamp (Sylvania,
Cordes, Delmenhorst, Germany) placed at a distance of
5 cm. The reaction was monitored photometrically (260 nm).
Monitoring of enzyme activity
Following the procedure developed by Jorns et al. [36], the
enzyme activity was measured by monitoring the repair of
cyclobutane pyrimidine dimers by DNA photolyase as a
function of time by using UV–vis spectroscopy. UV-irra-
diated single-strand oligo-(dT)
18
DNA was used as a sub-
strate. The photorepair was performed by illuminating the
mixture with 365-nm light from a dual wavelength UV
lamp, and the repair of the cyclobutane pyrimidine dimers
by DNA photolyase was followed by changes of the
absorption at 260 nm.
Monitoring of irradiation damage
Aliquots (2–10 lL) of solutions containing photodamaged
oligothymidine in water were mixed with 6 lL1m potassium
phosphate buffer pH 7.0 and 30 lL20mm KMnO
4
[48] and
water was added to a final volume of 600 lL under an inert
atmosphere at room temperature. After 5 min, the reaction
mixture was centrifuged at 10 000 g for 1 min. The inte-
grated absorbance of the supernatant was monitored in the
range 460–590 nm. Reaction mixtures containing no oligonu-
cleotide (100% yield) and undamaged DNA (0% yield) were
used as references. The consumption of KMnO
4
is equivalent
to undamaged thymidine. Typically, about 50% of the bases
were damaged as analysed by this method.
FT-IR sample preparation
Stock solutions contained 1.2 mm DNA photolyase and
4mm DNA (native or damaged), respectively. Equal
volumes of the stock solutions were mixed as required for
experiments. Reaction mixtures were transferred into a cuv-
ette equipped with calcium fluoride windows and a 5-lm
spacer under a nitrogen atmosphere in the dark. Prior to
measurements, the samples were thermally equilibrated in
the spectrometer.
FT-IR instrumentation
FT-IR spectra were recorded with infrared spectrometers
(IFS 66, 66 V, 66 VS or 88) from Bruker Instruments
(Bremen, Germany). These instruments were all equipped
with highly sensitive MCT-detectors and are similar in their
optical layout, but are equipped with different light sources
for irradiation of samples with visible or UV light. Red-
light irradiation was performed with a 100-W halogen lamp
(Spindler & Hoyer, Go
¨
ttingen, Germany) using an optical
OG 530 filter (Schott, Mainz, Germany). Pulsed excimer
lasers (LPX 240i, LPX 305, Lambda Physik, Go
¨
ttingen,
Germany) were used for irradiation at 308 nm in the evacu-
ated IFS 66VS and 66 V spectrometers. Sample irradiation
was invariably performed inside the spectrometer in order
to avoid physical handling of the cuvettes during IR experi-
ments.
All spectra were recorded with a bandwidth of 2 cm
)1
.
Typically, 100 scans were accumulated and Fourier-trans-
formed with the apodization function Happ–Genzel weak.
Acknowledgements
This work was supported by the Deutsche Forschungs-
gemeinschaft (SFB-533, TP A5 and SFB-498, TP A2),
by the Fonds der Chemischen Industrie and by the
Hans-Fischer-Gesellschaft. We thank Dr Chris Kay
for stimulating discussions and Richard Feicht for
excellent technical assistance.
References
1 Friedberg EC (1995) DNA Repair and Mutagenesis.
ASM Press, Washington, D.C.
2 Sancar GB (1990) DNA photolyases–physical-proper-
ties, action mechanism, and roles in dark repair. Muta-
tion Res 236, 147–160.
3 Blackburn GM & Davies RJH (1966) Structure of
DNA-derived thymine dimer. Biochem Biophys Res
Commun 22, 704–706.
4 Blackburn GM & Davies RJH (1965) Structure of thy-
mine photo-dimer. Chem Commun 215–216.
5 Otoshi E, Yagi T, Mori T, Matsunaga T, Nikaido O,
Kim ST, Hitomi K, Ikenaga M & Todo T (2000)
Respective roles of cyclobutane pyrimidine dimers, (6–4)
photoproducts, and minor photoproducts in ultraviolet
mutagenesis of repair-deficient xeroderma pigmentosum
A cells. Cancer Res 60, 1729–1735.
6 Todo T, Takemori H, Ryo H, Ihara M, Matsunaga T,
Nikaido O, Sato K & Nomura T (1993) A new photo-
reactivating enzyme that specifically repairs ultraviolet
light-induced (6–4) photoproducts. Nature 361, 371–374.
7 Nakajima S, Sugiyama M, Iwai S, Hitomi K, Otoshi
E, Kim ST, Jiang CZ, Todo T, Britt AB & Yama-
moto K (1998) Cloning and characterization of a gene
(UVR3) required for photorepair of 6–4 photopro-
ducts in Arabidopsis thaliana. Nucleic Acids Research
26, 638–644.
FT-IR on DNA photolyase E. Schleicher et al.
1864 FEBS Journal 272 (2005) 1855–1866 ª 2005 FEBS
8 Todo T (1999) Functional diversity of the DNA photo-
lyase blue light receptor family. Mutation Res-DNA
Repair 434, 89–97.
9 Miyamoto Y & Sancar A (1998) Vitamin B2-based
blue-light photoreceptors in the retinohypothalamic
tract as the photoactive pigments for setting the circa-
dian clock in mammals. Proc Natl Acad Sci USA 95,
6097–6102.
10 Zhao SY & Sancar A (1997) Human blue-light photo-
receptor hCRY2 specifically interacts with protein seri-
ne ⁄ threonine phosphatase 5 and modulates its activity.
Photochem Photobiol 66, 727–731.
11 Malhotra K, Kim ST, Batschauer A, Dawut L & San-
car A (1995) Putative blue-light photoreceptors from
Arabidopsis thaliana and Sinapis alba with a high-degree
of sequence homology to DNA photolyase contain the
2 photolyase cofactors but lack DNA-repair activity.
Biochemistry 34, 6892–6899.
12 Park HW, Kim ST, Sancar A & Deisenhofer J (1995)
Crystal-structure of DNA photolyase from Escherichia
coli. Science 268, 1866–1872.
13 Tamada T, Kitadokoro K, Higuchi Y, Inaka K, Yasui
A, deRuiter PE, Eker APM & Miki K (1997) Crystal
structure of DNA photolyase from Anacystis nidulans.
Nat Struct Biol 4, 887–891.
14 Komori H, Masui R, Kuramitsu S, Yokoyama S, Shi-
bata T, Inoue Y & Miki K (2001) Crystal structure of
thermostable DNA photolyase: Pyrimidine-dimer recog-
nition mechanism. Proc Natl Acad Sci USA 98, 13560–
13565.
15 Jorns MS, Baldwin ET, Sancar GB & Sancar A (1987)
Action mechanism of Escherichia coli DNA photolyase.
2. Role of the chromophores in catalysis. J Biol Chem
262, 486–491.
16 Sancar GB, Jorns MS, Payne G, Fluke DJ, Rupert CS
& Sancar A (1987) Action mechanism of Escherichia
coli DNA photolyase. 3. Photolysis of the enzyme-sub-
strate complex and the absolute action spectrum. J Biol
Chem 262, 492–498.
17 Payne G, Heelis PF, Rohrs BR & Sancar A (1987)
The active Form of Escherichia coli DNA photolyase
contains a fully reduced flavin and not a flavin radi-
cal, both in vivo and in vitro. Biochemistry 26, 7121–
7127.
18 Sancar A (1996) No ‘end of history’ for photolyases.
Science 272, 48–49.
19 Sancar A (2003) Structure and function of DNA photo-
lyase and cryptochrome blue-light photoreceptors. Chem
Rev 103, 2203–2237.
20 Weber S (2005) Light-driven enzymatic catalysis of
DNA repair: a review of recent biophysical studies on
photolyase. Biochim Biophys Acta 1707, 1–23.
21 Li YF, Heelis PF & Sancar A (1991) Active-site of
DNA photolyase – tryptophan-306 is the intrinsic
hydrogen-atom donor essential for flavin radical photo-
reduction and DNA-repair in vitro. Biochemistry 30,
6322–6329.
22 Kim ST, Sancar A, Essenmacher C & Babcock GT
(1993) Time-resolved EPR studies with DNA photolyase
– excited-state FADH (0) abstracts an electron from
Trp-306 to generate FADH
–
, the catalytically active
form of the cofactor. Proc Natl Acad Sci USA 90,
8023–8027.
23 Heelis PF, Okamura T & Sancar A (1990) Excited-state
properties of Escherichia coli DNA photolyase in the
picosecond to millisecond time-scale. Biochemistry 29,
5694–5698.
24 Sancar GB, Smith FW & Sancar A (1985) Binding of
Escherichia coli DNA photolyase to UV-irradiated
DNA. Biochemistry 24, 1849–1855.
25 Kim ST & Sancar A (1991) Effect of base, pentose, and
phosphodiester backbone structures on binding and
repair of pyrimidine dimers by Escherichia coli DNA
photolyase. Biochemistry 30, 8623–8630.
26 Kim ST, Heelis PF, Okamura T, Hirata Y, Mataga N
& Sancar A (1991) Determination of rates and yields of
interchromophore (folate fi flavin) energy-transfer and
intermolecular (flavin fi DNA) electron-transfer in
Escherichia coli photolyase by time-resolved fluorescence
and absorption-spectroscopy. Biochemistry 30, 11262–
11270.
27 Kim ST & Sancar A (1993) Photochemistry, photophy-
sics, and mechanism of pyrimidine dimer repair by
DNA photolyase. Photochem Photobiol 57, 895–904.
28 Hamm-Alvarez S, Sancar A & Rajagopalan KV (1990)
The folate cofactor of Escherichia coli DNA photolyase
acts catalytically. J Biol Chem 265, 18656–18662.
29 Kay CWM, Feicht R, Schulz K, Sadewater P, Sancar
A, Bacher A, Mo
¨
bius K, Richter G & Weber S (1999)
EPR, ENDOR, and TRIPLE resonance spectroscopy
on the neutral flavin radical in Escherichia coli DNA
photolyase. Biochemistry 38, 16740–16748.
30 Jorns MS, Wang BY, Jordan SP & Chanderkar LP
(1990) Chromophore Function and interaction in
Escherichia coli DNA photolyase – Reconstitution of
the apoenzyme with pterin and or flavin derivatives.
Biochemistry 29, 552–561.
31 Weber S, Richter G, Schleicher E, Bacher A, Mo
¨
bius K
& Kay CWM (2001) Substrate binding to DNA photo-
lyase studied by electron paramagnetic resonance spec-
troscopy. Biophys J 81, 1195–1204.
32 Payne G & Sancar A (1990) Absolute action spectrum
of E-FADH
2
and E-FADH
2
-MTHF forms of Escheri-
chia coli DNA photolyase. Biochemistry 29, 7715–
7727.
33 Murgida DH, Schleicher E, Bacher A, Richter G & Hil-
debrandt P (2001) Resonance Raman spectroscopic
study of the neutral flavin radical complex of DNA
photolyase from Escherichia coli. J Raman Spectroscopy
32, 551–556.
E. Schleicher et al. FT-IR on DNA photolyase
FEBS Journal 272 (2005) 1855–1866 ª 2005 FEBS 1865
34 Schelvis JPM, Ramsey M, Sokolova O, Tavares C,
Cecala C, Connell K, Wagner S & Gindt YM (2003)
Resonance Raman and UV-Vis spectroscopic charac-
terization of FADH in the complex of photolyase
with UV-damaged DNA. J Phys Chem B 107, 12352–
12362.
35 Schmitz M, Tavan P & Nonella M (2001) Vibrational
analysis of carbonyl modes in different stages of light-
induced cyclopyrimidine dimer repair reactions. Chem
Physics Lett 349 , 342–348.
36 Jorns MS, Sancar GB & Sancar A (1985) Identification
of Oligothymidylates as new simple substrates for
Escherichia coli DNA photolyase and their use in a
rapid spectrophotometric enzyme assay. Biochemistry
24, 1856–1861.
37 Banyay M, Sarkar M & Graslund A (2003) A library of
IR bands of nucleic acids in solution. Biophys Chem
104, 477–488.
38 Husain I, Griffith J & Sancar A (1988) Thymine
dimers bend DNA. Proc Natl Acad Sci USA 85,
2558–2562.
39 McAteer K, Jing Y, Kao J, Taylor JS & Kennedy MA
(1998) Solution-state structure of a DNA dodecamer
duplex containing a cis-syn thymine cyclobutane dimer,
the major UV photoproduct of DNA. J Mol Biol 282,
1013–1032.
40 Park H, Zhang K, Ren Y, Nadji S, Sinha N, Taylor JS
& Kang C (2002) Crystal structure of a DNA decamer
containing a cis-syn thymine dimer. Proc Natl Acad Sci
USA 99, 15965–15970.
41 Husain I, Sancar GB, Holbrook SR & Sancar A (1987)
Mechanism of damage recognition by Escherichia coli
DNA photolyase. J Biol Chem 262, 13188–13197.
42 Vande Berg BJ & Sancar GB (1998) Evidence for dinu-
cleotide flipping by DNA photolyase. J Biol Chem 273,
20276–20284.
43 Torizawa T, Ueda T, Kuramitsu S, Hitomi K, Todo T,
Iwai S, Morikawa K & Shimada I (2004) Investigation
of the cyclobutane pyrimidine dimer (CPD) photolyase
DNA recognition mechanism by NMR analyses. J Biol
Chem 279, 32950–32956.
44 Mees A, Klar T, Gnau P, Hennecke U, Eker APM,
Carell T & Essen L-O (2004) Crystal structure of a
photolyase bound to a CPD-like DNA lesion after in
situ repair. Science 306, 1789–1793.
45 Marini F III, Naeem A & Lapeyre JN (1993) An effi-
cient 1-tube PCR method for internal site-directed
mutagenesis of large amplified molecules. Nucleic Acids
Research 21, 2277–2278.
46 Williams DM, Duvall EJ & Lovett PS (1981) Cloning
restriction fragments that promote expression of a gene
in Bacillus subtilis. J Bacteriol 146, 1162–1165.
47 Wang BY & Jorns MS (1989) Reconstitution of Escheri-
chia coli DNA photolyase with various folate deriva-
tives. Biochemistry 28, 1148–1152.
48 Ramaiah D, Koch T, Orum H & Schuster GB (1998)
Detection of thymine [2+2] photodimer repair in DNA:
selective reaction of KMnO
4
. Nucleic Acids Research 26,
3940–3943.
49 Zamenhof PJ & Villarej. M (1972) Construction and
properties of Escherichia coli strains exhibiting alpha-
complementation of beta-galactosidase fragments
in vivo. J Bacteriol 110, 171–178.
50 Stu
¨
ber D, Matile H & Garotta G (1990) System for
high-level production in Escherichia coli and rapid puri-
fication of recombinant proteins: application to epitope
mapping, preparation of antibodies, and structure-func-
tion analysis. In Immunological Methods IV (Lefkovits,
I & Pernis, P, eds), pp. 121–152. Academic Press,
Orlando, Florida.
51 Bullock WO, Fernandez JM & Short JM (1987) Xl1-
Blue–a high-efficiency plasmid transforming RecA
Escherichia coli strain with beta-galactosidase selection.
BioTechniques 5, 376–380.
52 Richter G, Fischer M, Krieger C, Eberhardt S, Luttgen
H, Gerstenschlager I & Bacher A (1997) Biosynthesis of
riboflavin: Characterization of the bifunctional deami-
nase-reductase of Escherichia coli and Bacillus subtilis.
J Bacteriol 179, 2022–2028.
53 Le Grice SF (1990) Regulated promoter for high-level
expression of heterologous genes in Bacillus subtilis.
Methods Enzymol 185, 201–214.
FT-IR on DNA photolyase E. Schleicher et al.
1866 FEBS Journal 272 (2005) 1855–1866 ª 2005 FEBS