A Comparison of Event Models for Naive Bayes Text Classi cation potx
Bạn đang xem bản rút gọn của tài liệu. Xem và tải ngay bản đầy đủ của tài liệu tại đây (322.45 KB, 8 trang )
A Comparison of Event Models for Naive Bayes Text Classification
Andrew McCallum
‡†
Kamal Nigam
†
‡
Just Research
4616 Henry Street
Pittsburgh, PA 15213
†
School of Computer Science
Carnegie Mellon University
Pittsburgh, PA 15213
Abstract
Recent approaches to text classification have used two
different first-order probabilistic models for classifica-
tion, both of which make the naive Bayes assumption.
Some use a multi-variate Bernoulli model, that is, a
Bayesian Network with no dependencies between words
and binary word features (e.g. Larkey and Croft 1996;
Koller and Sahami 1997). Others use a multinomial
model, that is, a uni-gram language model with integer
word counts (e.g. Lewis and Gale 1994; Mitchell 1997).
This paper aims to clarify the confusion by describing
the differences and details of these two models, and by
empirically comparing their classification performance
on five text corpora. We find that the multi-variate
Bernoulli performs well with small vocabulary sizes,
but that the multinomial performs usually performs
even better at larger vocabulary sizes—providing on
average a 27% reduction in error over the multi-variate
Bernoulli model at any vocabulary size.
Introduction
Simple Bayesian classifiers have been gaining popularity
lately, and have been found to perform surprisingly well
(Friedman 1997; Friedman et al. 1997; Sahami 1996;
Langley et al. 1992). These probabilistic approaches
make strong assumptions about how the data is gen-
erated, and posit a probabilistic model that embodies
these assumptions; then they use a collection of labeled
training examples to estimate the parameters of the
generative model. Classification on new examples is
performed with Bayes’ rule by selecting the class that
is most likely to have generated the example.
The naive Bayes classifier is the simplest of these
models, in that it assumes that all attributes of the
examples are independent of each other given the con-
text of the class. This is the so-called “naive Bayes
assumption.” While this assumption is clearly false
in most real-world tasks, naive Bayes often performs
classification very well. This paradox is explained by
the fact that classification estimation is only a function
of the sign (in binary cases) of the function estima-
tion; the function approximation can still be poor while
classification accuracy remains high (Friedman 1997;
Domingos and Pazzani 1997). Because of the indepen-
dence assumption, the parameters for each attribute
can be learned separately, and this greatly simplifies
learning, especially when the number of attributes is
large.
Document classification is just such a domain with
a large number of attributes. The attributes of the
examples to be classified are words, and the number
of different words can be quite large indeed. While
some simple document classification tasks can be ac-
curately performed with vocabulary sizes less than one
hundred, many complex tasks on real-world data from
the Web, UseNet and newswire articles do best with vo-
cabulary sizes in the thousands. Naive Bayes has been
successfully applied to document classification in many
research efforts (see references below).
Despite its popularity, there has been some confu-
sion in the document classification community about
the “naive Bayes” classifier because there are two dif-
ferent generative models in common use, both of which
make the “naive Bayes assumption.” Both are called
“naive Bayes” by their practitioners.
One model specifies that a document is represented
by a vector of binary attributes indicating which words
occur and do not occur in the document. The number
of times a word occurs in a document is not captured.
When calculating the probability of a document, one
multiplies the probability of all the attribute values,
including the probability of non-occurrence for words
that do not occur in the document. Here we can un-
derstand the document to be the “event,” and the ab-
sence or presence of words to be attributes of the event.
This describes a distribution based on a multi-variate
Bernoulli event model. This approach is more tradi-
tional in the field of Bayesian networks, and is appro-
priate for tasks that have a fixed number of attributes.
The approach has been used for text classification by
numerous people (Robertson and Sparck-Jones 1976;
Lewis 1992; Kalt and Croft 1996; Larkey and Croft
1996; Koller and Sahami 1997; Sahami 1996).
The second model specifies that a document is rep-
resented by the set of word occurrences from the doc-
ument. As above, the order of the words is lost, how-
ever, the number of occurrences of each word in the
document is captured. When calculating the proba-
bility of a document, one multiplies the probability of
the words that occur. Here we can understand the in-
dividual word occurrences to be the “events” and the
document to be the collection of word events. We call
this the multinomial event model. This approach is
more traditional in statistical language modeling for
speech recognition, where it would be called a “uni-
gram language model.” This approach has also been
used for text classification by numerous people (Lewis
and Gale 1994; Kalt and Croft 1996; Joachims 1997;
Guthrie and Walker 1994; Li and Yamanishi 1997;
Mitchell 1997; Nigam et al. 1998; McCallum et al.
1998).
This paper aims to clarify the confusion between
these two approaches by explaining both models in
detail. We present an extensive empirical compari-
son on five corpora, including Web pages, UseNet ar-
ticles and Reuters newswire articles. Our results indi-
cate that the multi-variate Bernoulli model sometimes
performs better than the multinomial at small vocab-
ulary sizes. However, the multinomial usually out-
performs the multi-variate Bernoulli at large vocabu-
lary sizes, and almost always beats the multi-variate
Bernoulli when vocabulary size is chosen optimally for
both. While sometimes the difference in performance is
not great, on average across data sets, the multinomial
provides a 27% reduction in error over the multi-variate
Bernoulli.
Probabilistic Framework of Naive Bayes
This section presents the generative model for both
cases of the naive Bayes classifier. First we explain
the mechanisms they have in common, then, where the
event models diverge, the assumptions and formulations
of each are presented.
Consider the task of text classification in a Bayesian
learning framework. This approach assumes that the
text data was generated by a parametric model, and
uses training data to calculate Bayes-optimal estimates
of the model parameters. Then, equipped with these
estimates, it classifies new test documents using Bayes’
rule to turn the generative model around and calculate
the posterior probability that a class would have gener-
ated the test document in question. Classification then
becomes a simple matter of selecting the most probable
class.
Both scenarios assume that text documents are gen-
erated by a mixture model parameterized by θ.The
mixture model consists of mixture components c
j
∈
C = {c
1
, , c
|C|
}. Each component is parameterized by
a disjoint subset of θ. Thus a document, d
i
,iscreated
by (1) selecting a component according to the priors,
P(c
j
|θ), then (2) having the mixture component gener-
ate a document according to its own parameters, with
distribution P(d
i
|c
j
; θ). We can characterize the like-
lihood of a document with a sum of total probability
over all mixture components:
P(d
i
|θ)=
|C|
j=1
P(c
j
|θ)P(d
i
|c
j
; θ). (1)
Each document has a class label. We assume that
there is a one-to-one correspondence between classes
and mixture model components, and thus use c
j
to in-
dicate both the jth mixture component and the jth
class.
1
In this setting, (supervised learning from la-
beled training examples), the typically “hidden” indica-
tor variables for a mixture model are provided as these
class labels.
Multi-variate Bernoulli Model
In the multi-variate Bernoulli event model, a document
is a binary vector over the space of words. Given
a vocabulary V , each dimension of the space t, t ∈
{1, ,|V |}, corresponds to word w
t
from the vocabu-
lary. Dimension t of the vector for document d
i
is writ-
ten B
it
, and is either 0 or 1, indicating whether word
w
t
occurs at least once in the document. With such
a document representation, we make the naive Bayes
assumption: that the probability of each word occur-
ring in a document is independent of the occurrence of
other words in a document. Then, the probability of a
document given its class from Equation 1 is simply the
product of the probability of the attribute values over
all word attributes:
P(d
i
|c
j
; θ)=
|V |
t=1
(B
it
P(w
t
|c
j
; θ)+ (2)
(1 − B
it
)(1 − P(w
t
|c
j
; θ))).
Thus given a generating component, a document can
be seen as a collection of multiple independent Bernoulli
experiments, one for each word in the vocabulary, with
the probabilities for each of these word events defined
by each component, P(w
t
|c
j
; θ). This is equivalent to
viewing the distribution over documents as being de-
scribed by a Bayesian network, where the absence or
presence of each word is dependent only on the class of
the document.
Given a set of labeled training documents, D =
{d
1
, ,d
|D|
}, learning the parameters of a probabilis-
tic classification model corresponds to estimating each
of these class-conditional word probabilities. The pa-
rameters of a mixture component are written θ
w
t
|c
j
=
P(w
t
|c
j
; θ), where 0 ≤ θ
w
t
|c
j
≤ 1. We can calcu-
late Bayes-optimal estimates for these probabilities by
straightforward counting of events, supplemented by a
prior (Vapnik 1982). We use the Laplacean prior, prim-
ing each word’s count with a count of one to avoid prob-
abilities of zero or one. Define P(c
j
|d
i
) ∈{0, 1} as given
by the document’s class label. Then, we estimate the
probability of word w
t
in class c
j
with:
ˆ
θ
w
t
|c
j
=P(w
t
|c
j
; θ)=
1+
|D|
i=1
B
it
P(c
j
|d
i
)
2+
|D|
i=1
P(c
j
|d
i
)
. (3)
1
In a more general setting, this one-to-one correspon-
dence can be avoided (Li and Yamanishi 1997; Nigam et al.
1998).
The class prior parameters, θ
c
j
, are set by the maxi-
mum likelihood estimate:
ˆ
θ
c
j
=P(c
j
|
ˆ
θ)=
|D|
i=1
P(c
j
|d
i
)
|D|
. (4)
Note that this model does not capture the number of
times each word occurs, and that it explicitly includes
the non-occurrence probability of words that do not ap-
pear in the document.
Multinomial Model
In contrast to the multi-variate Bernoulli event model,
the multinomial model captures word frequency infor-
mation in documents. Consider, for example, the oc-
currence of numbers in the Reuters newswire articles;
our tokenization maps all strings of digits to a com-
mon token. Since every news article is dated, and thus
has a number, the number token in the multi-variate
Bernoulli event model is uninformative. However, news
articles about earnings tend to have a lot of numbers
compared to general news articles. Thus, capturing fre-
quency information of this token can help classification.
In the multinomial model, a document is an ordered
sequence of word events, drawn from the same vocab-
ulary V . We assume that the lengths of documents
are independent of class.
2
We again make a similar
naive Bayes assumption: that the probability of each
word event in a document is independent of the word’s
context and position in the document. Thus, each doc-
ument d
i
is drawn from a multinomial distribution of
words with as many independent trials as the length
of d
i
. This yields the familiar “bag of words” repre-
sentation for documents. Define N
it
to be the count
of the number of times word w
t
occurs in document d
i
.
Then, the probability of a document given its class from
Equation 1 is simply the multinomial distribution:
P(d
i
|c
j
; θ)=P(|d
i
|)|d
i
|!
|V |
t=1
P(w
t
|c
j
; θ)
N
it
N
it
!
. (5)
The parameters of the generative component for
each class are the probabilities for each word, writ-
ten θ
w
t
|c
j
=P(w
t
|c
j
; θ), where 0 ≤ θ
w
t
|c
j
≤ 1and
t
θ
w
t
|c
j
=1.
Again, we can calculate Bayes-optimal estimates for
these parameters from a set of labeled training data.
Here, the estimate of the probability of word w
t
in class
c
j
is:
2
Many previous formalizations of the multinomial model
have omitted document length. Including document length
is necessary because document length specifies the number
of draws from the multinomial. Our the assumption that
document length contains no class information is a simpli-
fication only. In practice document length may be class de-
pendent, and a more general formalization should capture
this.
ˆ
θ
w
t
|c
j
=P(w
t
|c
j
;
ˆ
θ
j
)=
1+
|D|
i=1
N
it
P(c
j
|d
i
)
|V | +
|V |
s=1
|D|
i=1
N
is
P(c
j
|d
i
)
.
(6)
The class prior parameters are calculated as before
accordingtoEquation4.
Classification
Given estimates of these parameters calculated from the
training documents, classification can be performed on
test documents by calculating the posterior probability
of each class given the evidence of the test document,
and selecting the class with the highest probability. We
formulate this by applying Bayes’ rule:
P(c
j
|d
i
;
ˆ
θ)=
P(c
j
|
ˆ
θ)P(d
i
|c
j
;
ˆ
θ
j
)
P(d
i
|
ˆ
θ)
. (7)
The right hand side may be expanded by first substi-
tuting using Equations 1 and 4. Then the expansion
of individual terms for this equation are dependent on
the event model used. Use Equations 2 and 3 for the
multi-variate Bernoulli event model. Use Equations 5
and 6 for the multinomial
Feature Selection
When reducing the vocabulary size, feature selection
is done by selecting words that have highest average
mutual information with the class variable (Cover and
Thomas 1991). This method works well with text and
has been used often (Yang and Pederson 1997; Joachims
1997; Craven et al. 1998).
In all previous work of which we are aware, this is
done by calculating the average mutual information be-
tween the (1) class of a document and (2) the absence
or presence of a word in the document, i.e. using a
document event model, the multi-variate Bernoulli. We
write C for a random variable over all classes, and write
W
t
for a random variable over the absence or presence
of word w
t
in a document, where W
t
takes on values
f
t
∈{0, 1},andf
t
= 0 indicates the absence of w
t
,
and f
t
= 1 indicates the presence of w
t
. Average mu-
tual information is the difference between the entropy
of the class variable, H(C), and the entropy of the class
variable conditioned on the absence or presence of the
word, H(C|W
t
) (Cover and Thomas 1991):
I(C; W
t
)=H(C) − H(C|W
t
)(8)
= −
c∈C
P(c)log(P(c))
+
f
t
∈{0,1}
P(f
t
)
c∈C
P(c|f
t
) log(P(c|f
t
))
=
c∈C
f
t
∈{0,1}
P(c, f
t
)log
P(c, f
t
)
P(c)P(f
t
)
,
where P(c), P(f
t
)andP(c, f
t
) are calculated by sums
over all documents—that is P(c) is the number of docu-
ments with class label c divided by the total number of
documents; P(f
t
) is the number of documents contain-
ing one or more occurrences of word w
t
divided by the
total number of documents; and P(c, f
t
)isthenumber
of documents with class label c that also contain word
w
t
, divided by the total number of documents.
We experimented with this method, as well as an
event model that corresponds to the multinomial: cal-
culating the mutual information between (1) the class of
the document from which a word occurrence is drawn,
and (2) a random variable over all word occurrences.
Here the word occurrences are the events. This calcu-
lation also uses Equation 8, but calculates the values
of the terms by sums over word occurrences instead of
over documents—that is P(c)isthenumberofword
occurrences appearing in documents with class label c
divided by the total number of word occurrences; P(f
t
)
is the number of occurrences of word w
t
divided by the
total number of word occurrences; and P(c, f
t
)isthe
number of word occurrences of word w
t
that also ap-
pear in documents with class label c, divided by the
total number of word occurrences.
Our preliminary experiments comparing these two
feature selection methods on the Newsgroups data set
with the multinomial event model showed little differ-
ence in classification accuracy. The results reported in
this paper use the feature selection event model that
corresponds to the event model used for classification.
Experimental Results
This section provides empirical evidence that the multi-
nomial event model usually performs better than the
multi-variate Bernoulli. The results are based on five
different data sets.
3
Data Sets and Protocol
The web pages pointed to by the Yahoo! ‘Science’ hi-
erarchy were gathered in July 1997. The web pages are
divided into 95 disjoint classes containing 13589 pages
as the result of coalescing classes of hierarchy-depth
greater than two, and removing those classes with fewer
than 40 documents. After tokenizing as above and re-
moving stopwords and words that occur only once, the
corpus has a vocabulary size of 44383 (McCallum et al.
1998).
The Industry Sector hierarchy, made available by Mar-
ket Guide Inc. (www.marketguide.com) consists of
company web pages classified in a hierarchy of industry
sectors (McCallum et al. 1998). There are 6440 web
pages partitioned into the 71 classes that are two levels
deep in the hierarchy. In tokenizing the data we do not
stem. After removing tokens that occur only once or
3
These data sets are all available on the Inter-
net. See and
/>are on a stoplist, the corpus has a vocabulary of size
29964.
The Newsgroups data set, collected by Ken Lang,
contains about 20,000 articles evenly divided among
20 UseNet discussion groups (Joachims 1997). Many
of the categories fall into confusable clusters; for ex-
ample, five of them are comp.* discussion groups, and
three of them discuss religion. When tokenizing this
data, we skip the UseNet headers (thereby discarding
the subject line); tokens are formed from contiguous al-
phabetic characters with no stemming. The resulting
vocabulary, after removing words that occur only once
or on a stoplist, has 42191 words.
The WebKB data set (Craven et al. 1998) contains
web pages gathered from university computer science
departments. The pages are divided into seven cate-
gories: student, faculty, staff, course, project, department
and other. In this paper, we use the four most populous
entity-representing categories: student, faculty, course
and project, all together containing 4199 pages. We
did not use stemming or a stoplist; we found that us-
ing a stoplist actually hurt performance because, for
example, “my” is the fourth-ranked word by mutual
information, and is an excellent indicator of a student
homepage. The resulting vocabulary has 23830 words.
The ‘ModApte’ train/test split of the Reuters 21578
Distribution 1.0 data set consists of 12902 Reuters
newswire articles in 135 overlapping topic categories.
Following several other studies (Joachims 1998; Liere
and Tadepalli 1997) we build binary classifiers for each
of the 10 most populous classes. We ignore words on
a stoplist, but do not use stemming. The resulting vo-
cabulary has 19371 words.
For all data sets except Reuters, naive Bayes is per-
formed with randomly selected train-test splits. The
Industry Sector and Newsgroups data sets use five tri-
als with 20% of the data held out for testing; Yahoo
uses five trials with a 30% test data, and WebKB uses
ten trials with a 30% test data. Results are reported
as average classification accuracy across trials. In all
experiments with multiple trials graphs show small er-
ror bars twice the width of the standard error; however
they are often hard to see since they are often quite nar-
row. For Reuters, results on the Mod-Apte test set are
shown as precision-recall breakeven points, a standard
information retrieval measure for binary classification.
Recall and Precision are defined as:
Recall =
# of correct positive predictions
# of positive examples
(9)
Precision =
# of correct positive predictions
# of positive predictions
(10)
The precision-recall breakeven point is the value at
which precision and recall are equal (Joachims 1998).
Results
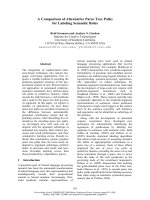
Figure 1 shows results on the Yahoo data set. The
multinomial event model reaches a maximum of 54%
0
20
40
60
80
100
10 100 1000 10000 100000
Classification Accuracy
Vocabulary Size
Yahoo Science
Multinomial
Multi-variate Bernoulli
Figure 1: A comparison of event models for different
vocabulary sizes on the Yaho o data set. Note that the
multi-variate Bernoulli performs best with a small vo-
cabulary and that the multinomial performs best with
a larger vocabulary. The multinomial achieves higher
accuracy overall.
0
20
40
60
80
100
10 100 1000 10000 100000
Classification Accuracy
Vocabulary Size
Industry Sector 71
Multinomial
Multi-variate Bernoulli
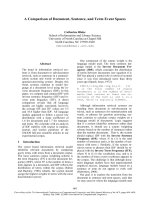
Figure 2: A comparison of event models for different
vocabulary sizes on the Industry Sector data set. Note
the same trends as seen in the previous figure.
accuracy at a vocabulary size of 1000 words. The multi-
variate Bernoulli event model reaches a maximum of
41% accuracy with only 200 words. Note that the multi-
variate Bernoulli shows its best results at a smaller vo-
cabulary than the multinomial, and that the multino-
mial has best performance at a larger vocabulary size.
The same pattern is seen in the Industry Sector data set,
displayed in Figure 2. Here, multinomial has the high-
est accuracy of 74% at 20000 words, and multi-variate
Bernoulli is best with 46% accuracy at 1000 words.
4
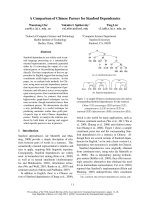
Figure 3 shows results for the Newsgroups data set.
Here, both event models do best at the maximum vo-
cabulary sizes. Multinomial achieves 85% accuracy and
4
Accuracies are higher here than reported in (McCallum
et al. 1998) because here more training data was provided
to this classifier (70% of the data used for training here,
versus only 50% in the other work).
0
20
40
60
80
100
10 100 1000 10000 100000
Classification Accuracy
Vocabulary Size
Newsgroups
Multinomial
Multi-variate Bernoulli
Figure 3: A comparison of event models for different vo-
cabulary sizes on the Newsgroups data set. Here, both
data sets perform best at the full vocabulary, but multi-
nomial achieves higher accuracy.
0
20
40
60
80
100
10 100 1000 10000 100000
Classification Accuracy
Vocabulary Size
WebKB 4
Multinomial
Multi-variate Bernoulli
Figure 4: A comparison of event models for different
vocabulary sizes on the WebKB data set. Here the two
event models achieve nearly equivalent accuracies, but
the multi-variate Bernoulli achieves this with a smaller
vocabulary.
multi-variate Bernoulli achieves 74% accuracy. Previ-
ous results in this domain are consistent in that best
results were with the full vocabulary (Joachims 1997;
Nigam et al. 1998). For the WebKB data, shown in Fig-
ure 4, the multi-variate Bernoulli has marginally higher
accuracy than the multinomial, 87% accuracy at 100
words versus 86% accuracy at 5000 words. In ongoing
work we are exploring the reasons that this data set
shows results different from the others.
Figures 5 and 6 show breakeven point results for the
ten Reuters categories. Again, the trends are distinc-
tive. The multi-variate Bernoulli achieves a slightly
higher breakeven point in one case, but on average
across categories, its best performance is 4.8 percent-
age points less than the multinomial. The multi-variate
Bernoulli has a rapid decrease in performance as the
vocabulary size grows, where the multinomial perfor-
mance is more even across vocabulary size. Results by
0
20
40
60
80
100
10 100 1000 10000 100000
Precision/Recall Breakeven Point
Vocabulary Size
interest
Multinomial
Multi-variate Bernoulli
0
20
40
60
80
100
10 100 1000 10000 100000
Precision/Recall Breakeven Point
Vocabulary Size
ship
Multinomial
Multi-variate Bernoulli
Figure 5: Two of the classification tasks from Reuters.
Multinomial event models do an average of 4.8% points
better. This domain tends to require smaller vocabular-
ies for best performance. See Figure 6 for the remaining
Reuters results.
Joachims (1998) found performance was highest in this
domain with the full vocabulary (no feature selection).
However, in contrast to our results, this work uses the
multi-variate Bernoulli event model for feature selection
and the multinomial for classification. In future work
we plan to investigate these feature selection methods
more closely because we note that our results are con-
sistently higher than those found in that work.
Discussion
For easy classification tasks, a small vocabulary is suffi-
cient for high performance. The Reuters categorization
tasks are examples of these—it is well-known that in
several of the categories, high accuracy can be obtained
with only a handful of words, sometimes even the single
word that is the title of the category (Joachims 1998).
Our results are consistent with this, in that best per-
formance is often achieved with small vocabulary sizes.
Many real-world classification tasks do not share this
attribute (i.e. that all documents in a category are
about a single narrow subject with limited vocabulary),
but instead, a category consists of diverse subject mat-
ters with overlapping vocabularies. In such tasks large
vocabularies are required for adequate classification ac-
curacy. Since our results show that the multi-variate
Bernoulli handles large vocabularies poorly, the multi-
nomial event model is more appropriate for these chal-
lenging classification tasks.
It would be incorrect to argue that multi-variate
Bernoulli has the advantage of counting evidence for
words that do not occur. Multinomials implicitly en-
code this information in the probability distributions
of words for each class. For example, if the word “pro-
fessor” is the most likely word for faculty home pages, it
will have a large probability for the faculty class, and all
other words will be less probable. If the word “profes-
sor” does not then occur in a document, that document
will be less likely to be a faculty document, because the
words in that document will be lower frequency in the
faculty class and higher frequency in others.
Another point to consider is that the multinomial
event model should be a more accurate classifier for
data sets that have a large variance in document length.
The multinomial event model naturally handles docu-
ments of varying length by incorporating the evidence
of each appearing word. The multi-variate Bernoulli
model is a somewhat poor fit for data with varying
length, in that it is more likely for a word to occur in a
long document regardless of the class. Thus, the vari-
ance of the classification should be large for documents
of varying lengths. Testing this hypothesis is a topic
of future work. Lewis also discusses difficulties with
document-length in the multi-variate Bernoulli model.
When adding non-text features to the classifier, (such
as whether or not an email message has more than
one recipient), such features can be included exactly
as the word features are when using the multi-variate
Bernoulli model (Sahami et al. 1998). However, in
the multinomial model more care must be taken. The
non-text features should not be added to the vocabu-
lary because then the event spaces for the different fea-
tures would compete for the same probability mass even
though they are not mutually exclusive. Non-text fea-
tures could be added as additional Bernoulli variables
to be included in conjunction with the multinomial over
words. This approach could also allow for a weighting
factor between the word features and the other features.
It is also more clear in the multi-variate Bernoulli
model how to relax the independence assumption
by adding a limited number of dependencies to the
Bayesian network (Sahami 1996; Friedman et al. 1997).
Related Work
Kalt and Croft (1996) previously compared the multi-
nomial model to the “binary independence model,” the
information retrieval terminology for our multi-variate
Bernoulli model. Their theoretical analysis of the multi-
nomial does not properly address document length as-
sumptions. Their experiments use a single data set
with extremely small vocabularies. Also, by normal-
izing document length, their event model is no longer
strictly a multinomial.
Lewis (1998) discusses the history of naive Bayes
in information retrieval, and presents a theoretical
comparison of the multinomial and the multi-variate
Bernoulli (again called the binary independence model).
Conclusions
This paper has compared the theory and practice of
two different first-order probabilistic classifiers, both of
which make the “naive Bayes assumption.” The multi-
nomial model is found to be almost uniformly better
than the multi-variate Bernoulli model. In empirical
results on five real-world corpora we find that the multi-
nomial model reduces error by an average of 27%, and
sometimes by more than 50%.
In future work we will investigate the role of doc-
ument length in classification, looking for correspon-
dence between variations in document length and the
comparative performance of multi-variate Bernoulli and
multinomial. We will also investigate event models that
normalize the word occurrence counts in a document by
document length, and work with more complex models
that model document length explicitly on a per-class
basis.
We also plan experiments with varying amounts of
training data because we hypothesize that that optimal
vocabulary size may change with the size of the training
set.
Acknowledgments
We thank Doug Baker for help formatting the Reuters
data set. We thank Market Guide, Inc. for permission
to use their Industry Sector hierarchy, and Mark Craven
for gathering its data from the Web. We thank Ya-
hoo! for permission to use their data. We thank Tom
Mitchell for helpful and enlightening discussions. This
research was supported in part by the Darpa HPKB
program under contract F30602-97-1-0215.
References
Thomas M. Cover and Joy A. Thomas. Elements of Infor-
mation Theory. John Wiley, 1991.
M. Craven, D. DiPasquo, D. Freitag, A. McCallum,
T. Mitchell, K. Nigam, and S. Slattery. Learning to ex-
tract symbolic knowledge from the World Wide Web. In
AAAI-98, 1998.
P. Domingos and M. Pazzani. On the optimality of the
simple Bayesian classifier under zero-one loss. Machine
Learning, 29:103–130, 1997.
Nir Friedman, Dan Geiger, and Moises Goldszmidt.
Bayesian network classifiers. Machine Learning, 29:131–
163, 1997.
Jerome H. Friedman. On bias, variance, 0/1 - loss, and
the curse-of-dimensionality. Data Mining and Knowledge
Discovery, 1:55–77, 1997.
Louise Guthrie and Elbert Walker. Document classifica-
tion by machine: Theory and practice. In Proceedings of
COLING-94, 1994.
Thorsten Joachims. A probabilistic analysis of the Rocchio
algorithm with TFIDF for text categorization. In ICML-
97, 1997.
Thorsten Joachims. Text categorization with Support Vec-
tor Machines: Learning with many relevant features. In
ECML-98, 1998.
T. Kalt and W. B. Croft. A new probabilistic model of
text classifica-
tion and retrieval. Technical Report IR-78, University of
Massachusetts Center for Intelligent Information Retrieval,
1996. />Daphne Koller and Mehran Sahami. Hierarchically clas-
sifying documents using very few words. In Proceedings
of the Fourteenth International Conference on Machine
Learning, 1997.
Pat Langley, Wayne Iba, and Kevin Thompson. An anal-
ysis of Bayesian classifiers. In AAAI-92, 1992.
Leah S. Larkey and W. Bruce Croft. Combining classifiers
in text categorization. In SIGIR-96, 1996.
D. Lewis and W. Gale. A sequential algorithm for training
text classifiers. In SIGIR-94, 1994.
David D. Lewis. An evaluation of phrasal and clustered
representations on a text categorization task. In SIGIR-
92, 1992.
David Lewis. Naive (bayes) at forty: The independence
asssumption in information retrieval. In ECML’98: Tenth
European Conference On Machine Learning, 1998.
Hang Li and Kenji Yamanishi. Document classification
using a finite mixture model. In Proceedings of the 35th
Annual Meeting of the Association for Computational Lin-
guistics, 1997.
Ray Liere and Prasad Tadepalli. Active learning with com-
mittees for text categorization. In AAAI-97, 1997.
Andrew McCallum, Ronald Rosenfeld, Tom Mitchell, and
Andrew Ng. Improving text clasification by shrinkage in a
hierarchy of classes. In ICML-98, 1998.
Tom M. Mitchell. Machine Learning. WCB/McGraw-Hill,
1997.
Kamal Nigam, Andrew McCallum, Sebastian Thrun, and
Tom Mitchell. Learning to classify text from labeled and
unlabeled documents. In AAAI-98, 1998.
S. E. Robertson and K. Sparck-Jones. Relevance weight-
ing of search terms. Journal of the American Society for
Information Science, 27:129–146, 1976.
Mehran Sahami, Susan Dumais, David Heckerman, and
Eric Horvitz. A bayesian approach to filtering junk e-mail.
In AAAI-98 Workshop on Learning for Text Categoriza-
tion, 1998.
Mehran Sahami. Learning limited dependence Bayesian
classifiers. In KDD-96: Proceedings of the Second Interna-
tional Conference on Knowledge Discovery and Data Min-
ing, pages 335–338. AAAI Press, 1996.
V. Vapnik. Estimations of dependences based on statistical
data. Springer Publisher, 1982.
Yiming Yang and Jan Pederson. Feature selection in sta-
tistical learning of text categorization. In ICML-97, 1997.
0
20
40
60
80
100
10 100 1000 10000 100000
Precision/Recall Breakeven Point
Vocabulary Size
acq
Multinomial
Multi-variate Bernoulli
0
20
40
60
80
100
10 100 1000 10000 100000
Precision/Recall Breakeven Point
Vocabulary Size
corn
Multinomial
Multi-variate Bernoulli
0
20
40
60
80
100
10 100 1000 10000 100000
Precision/Recall Breakeven Point
Vocabulary Size
crude
Multinomial
Multi-variate Bernoulli
0
20
40
60
80
100
10 100 1000 10000 100000
Precision/Recall Breakeven Point
Vocabulary Size
earn
Multinomial
Multi-variate Bernoulli
0
20
40
60
80
100
10 100 1000 10000 100000
Precision/Recall Breakeven Point
Vocabulary Size
grain
Multinomial
Multi-variate Bernoulli
0
20
40
60
80
100
10 100 1000 10000 100000
Precision/Recall Breakeven Point
Vocabulary Size
money-fx
Multinomial
Multi-variate Bernoulli
0
20
40
60
80
100
10 100 1000 10000 100000
Precision/Recall Breakeven Point
Vocabulary Size
trade
Multinomial
Multi-variate Bernoulli
0
20
40
60
80
100
10 100 1000 10000 100000
Precision/Recall Breakeven Point
Vocabulary Size
wheat
Multinomial
Multi-variate Bernoulli
Figure 6: The continuation of the Reuters results from Figure 5.