The 2002 Report on the Findings of Rating The Utah/Missouri ICD-9-CM Adverse Event Codes potx
Bạn đang xem bản rút gọn của tài liệu. Xem và tải ngay bản đầy đủ của tài liệu tại đây (145.63 KB, 11 trang )
1
The 2002 Report on the Findings of Rating
The Utah/Missouri ICD-9-CM Adverse Event Codes
The Expert Panel for Classification of Adverse Event ICD-9-CM Codes
UT/MO Patient Safety Project
AHRQ Patient Safety Grant #U18 HS11885
March 25, 2002
[Note: Please Contact Wu Xu at 801-538-7072 or
for use or citation of this
document and the ICD-9-CM Adverse Event Classification]
I. Purpose of Establishing an expert panel:
To refine and finalize the classification of adverse events identified by ICD-9-CM N- and
E-codes for the Utah/Missouri Patient Safety Project. This classification will be used as part of
project’s chart review criteria, training materials for participating hospitals in Utah and
references for other interested organizations that have statewide hospital discharge databases.
The panel is fully aware of the limitations of using the ICD-9-CM to detect adverse
events. However, since the ICD-9-CM is the only available coding scheme for all hospitals, the
panel believes that this classification effort has its practical merit.
II. Definitions of Adverse Events:
We will focus on hospital-detected adverse events. Injury caused by previous hospitalization will
be tracked for detecting and surveillance purposes. Intervention will only focus on injuries that
occurred during the current admission. The ICD classification will not be able to capture near
misses.
Adverse event: In the UT/MO patient safety project-the expert panel rating, an adverse event
(AE) is defined as an undesirable and unintended injury resulting from a medical intervention (an
act of care provided by the hospital or by the omission of necessary care), rather than from
patient’s underlying disease process; and where such injury occurs during an inpatient hospital
stay (i.e., subsequent to admission) and results in or leads to patient harm.
Patient harm: death, prolonged hospital stay, or temporary or permanent impairment of body
function or structure to a patient. Potential harm will not be measured in this project. The
seriousness of harm should require interventions such as (1) a change in monitoring the patient’s
condition; (2) a change in therapy; or (3) active medical or surgical treatment or attention, if an
intervention is feasible or possible.
Preventability: The panel has had heated debate on this issue. No commonly agreeable
definition has been formulated.
Panelists’ discussion on the concepts and definitions will be summarized in the report later.
2
III. Sources for the Initial List of ICD-9-CM Codes and Sub-Lists
The initial list of 974 codes representing potential AEs was assembled based on the following
literature and researches in progress. This list was split into smaller sub-lists with each list
containing a majority of codes in one of the following areas – codes representing medical events,
surgery related events, and adverse drug events.
An additional 118 codes, primarily representing OB/GYN and its procedure related events, were
proposed to be added to the initial list. As such, another sub-list, containing codes related to
these areas, was compiled.
Sources for the Selected ICD-9 Codes as Adverse Events
1. Utah Department of Health. 2001. Adverse Events Related to Medical Care, Utah: 1995-99.
(Robert Rolfs’ list) (AHRQ Grantee).
2. Jonathan Nebeker and John Hurley, Internal research list for potential adverse drug event
codes, VA Medical Center in Salt Lake City, Utah. (VA grantee).
3. Wisconsin Employers Alliance. Quality Counts Technical Report on the Safety of Hospital
Care Report
TM
(consists of data for 1999 and 2000 from the Bureau of Health
Information’s (BHI) inpatient public use data sets) (Internal Document).
4. Peter Layde. Forthcoming. Wisconsin Medical Injury Reporting System (WMIRS)
Categorization. Medical College of Wisconsin (AHRQ grantee) (Research in Progress.
Internal Document)
5. UCSF-Stanford Evidence-Based Practice Center, Forthcoming. Evidence Report for Measures
of Patient Safety based on Hospital Administrative Data – The Patient Safety Indicators
(Draft report under review. Internal Document) (AHRQ grantee)
6. Matthew Samore, List of ICD-9 Adverse Device Event Codes. University of Utah. (Research
in Progress. Internal Document) (FDA grantee).
7. Missouri Department of Health Patient Safety Team. Proposed ICD-9 Adverse Event Codes
(AHRQ grantee).
8. McCarthy EP, Iezzoni LI, Davis RB, Palmer RH, Cahalane M, Hamel MB, et al. Does
Clinical Evidence Support ICD-9-CM Diagnosis Coding of Complications? MedCare
2000;38(8):868-876.
9. Lawthers AG, McCarthy EP, Davis RB, Peterson LE, Palmer RH and Iezzoni LI.
Identification of In-Hospital Complications from Claims Data: Is It Valid? MedCare
2000; 38(8):785-795.
10. Geraci JM, Ashton CM, Kuykendall DH, Johnson ML and Wu L. International
Classification of Diseases, 9th Revision, Clinical Modification Codes in Discharge
3
Abstracts are Poor Measures of Complication Occurrence in Medical Inpatients.
MedCare 1997; 35(6):589-602.
11. Tpouzis F, Yu F, Coleman AL. Factors associated with elevated rates of adverse outcomes
after cyclodestructive procedures vs. drainage device procedures. Ophthalmology. 1998,
105(12):2276-81.
IV. Background on the Expert Raters
Twenty-three expert raters completed and returned the lists. This group consisted of fifteen
physicians, four medical record coders, three pharm D’s, and one attorney. The physicians’
breakdown by specialty was as follows:
Three family practice
Two epidemiologists
Two cardiologists
Two obstetrician/gynecologists
One internist
One pathologist
One surgeon
One geriatric physician
One critical care pediatrician
One psychiatrist
In addition to the above panelists there were three non-responders.
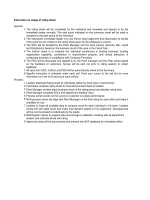
Each panelist received a ninety-minute telephone orientation at one of five orientation sessions.
Each panelist was asked to rate each code on three scales – medical care/causality, harm, and
preventability. The definition and rating instruction were discussed at the orientations. Following
is the one page ratings reference sheet that accompanied each list.
*********************
Quick Reference for Rating ICD-9-CM Codes
Adverse event: an undesirable and unintended injury resulting from a medical intervention (an act of
care provided by the hospital or by the omission of necessary care),
rather than from patient’s underlying
disease process; and where such injury occurs during an inpatient hospital stay (i.e., subsequent to
admission) and results in or leads to patient harm.
Patient harm: death, prolonged hospital stay, or temporary or permanent impairment of body function or
structure to a patient. Potential harm will not be measured in this project.
When evaluating a code, assume it is a secondary diagnosis code.
Dimension One - Medical Care/Causality:
· Rate each ICD-9-CM code as a possible adverse event due to medical care (or omission of care) as
follows:
5 = Very likely an AE due to care rather than underlying disease
4
4 = Likely an AE due to care rather than underlying disease
3 = Care and disease equally likely as cause of AE
2 = Likely not an AE (rather, caused by underlying disease) (enter this number and skip to next
ICD-9-CM code)
1 = Very likely not an AE (rather, caused by underlying disease) (enter this number and skip to
next ICD-9-CM code)
9 = Outside area of expertise (enter this number and skip to next ICD-9-CM code)
Dimension Two - Patient Harm:
· If the rating score for Medical Care is 1 or 2, skip this rating
· Rate the likelihood that this adverse event would lead to patient harm (death, prolonged hospital stay, or
impairment of body function or structure to a patient requiring some intervention):
5 = Very likely
4 = Likely
3 = Possibly
2 = Unlikely
1 = Very unlikely
9 = Outside area of expertise
Dimension Three - Preventability:
· If the rating score for Medical Care is 1 or 2, skip this rating.
· Rate the likelihood that this adverse event could be prevented given currently available medical
therapies and care processes:
5 = Very likely
4 = Likely
3 = Possibly
2 = Unlikely
1 = Very unlikely
9 = Outside area of expertise
************************
V.
Analysis of Panelists’ Ratings
Overview:
• The codes were rated on each axis on a 1 to 5 scale, with 9 available to indicate outside
the panelist’s area of expertise.
• Each code was rated by at least three or maximum nine panelists.
• Out-range rating scores were verified and edited. There were two types of patterns where
panelists deviated from the rating instructions:
1) Isolated mistakes (occurring in four codes or less).
2) Systematic skipping issues (The Medical Care field was rated 1, 2 or 9 and instead of
skipping to the next ICD-9 code, the Harm and/or Preventability fields were rated as
well)
5
• The panel chair, vice chair, and two expert panelists provided advice to staff in the
analysis.
• Median, Mean, and Range for Medical Care, Harm, and Preventability are calculated for
each code.
• Table 1 reports the descriptive statistics for Median scores for each axis.
Table 1. Descriptive Statistics on Ratings’ Median of Medical Care, Harm, and Preventability
N Range Minimum Maximum Mean Std.
Deviation
Skewness
Statistic Statistic Statistic Statistic Statistic Statistic Statistic Std. Error
Medical
Care
Median
1091 4.00 1.00 5.00 3.9675 1.23912 717 .074
Harm
Median
1069 2.00 3.00 5.00 4.0702 .69794 160 .075
Prevent
Median
1069 3.00 2.00 5.00 3.4677 .57665 .911 .075
Valid N 1069
Medical Care Rating as the Key Screening Criterion:
• Initial analysis focused on median of medical care/causality for each code.
• There were 863 codes with median of medical care/causality of 3.0 or greater. These
codes were kept on the list.
• There were 26 codes with median of medical care/causality less than 2.0. These codes
were removed from the list.
• There were 202 codes with median of medical care/causality greater than or equal to 2.0
but less than 3.0. These codes remain under consideration.
• Advised by four panelists in the verification group, approximately 138 codes with a median
under 3.0 are currently kept on the list.
For detailed lists of the codes, along with the analysis of the expert panelists’ ratings for each
code, please see the two excel files:
AE_Keep_032502 Codes proposed to remain on the list
AE_NotKeep_032502 Codes proposed to be removed from the list
6
Analysis of Median for Patient Harm by Likelihood of Adverse Event Due to Medical Care
Table 2. Distribution of Median for Patient Harm by Level of AEs Due to Medical Care
Median for Due to
Medical Care
Median
For Patient Harm Ratings
Count %
1.00= Very unlikely 5.00 13 1.2%
1.50 4.75 15 1.4%
2.00=Unlikely 5.00 175 16.0%
2.50 4.00 27 2.5%
3.00=Equally Likely 4.00 133 12.2%
3.50 4.00 16 1.5%
4.00=Likely 4.00 127 11.6%
4.50 4.50 25 2.3%
5.00=Very Likely 4.00 560 51.3%
Total 4.00 1091 100.0%
• Regardless the likelihood of medical care as a cause, panelists rated the likelihood of
harm for patient as “likely (score=4)” or higher.
Analysis of Median for Preventability by Likelihood of Adverse Event Due to Medical Care
Table 3. Distribution of Median for Patient Harm by Level of AEs Due to Medical Care
Median for Due to
Medical Care
Median
For Preventability
Count %
1.00= Very unlikely 5.00 13 1.2%
1.50 4.75 15 1.4%
2.00=Unlikely 4.50 175 16.0%
2.50 4.00 27 2.5%
3.00=Equally Likely 4.00 133 12.2%
3.50 3.90 16 1.5%
4.00=Likely 4.30 127 11.6%
4.50 4.30 25 2.3%
5.00=Very Likely 4.00 560 51.3%
Total 4.00 1091 100.0%
Total 4.00 1091 100.0%
• Regardless the likelihood of medical care as a cause, panelists rated preventability of
an AE as “likely (score=3.9)” or higher.
VI. Codes that were removed from list for reasons other than panelists’
ratings:
• Ventilation pneumonitis: 495.7 – This code represents pneumonitis due to air conditioning
organisms (rather than pneumonitis associated with a ventilator). This code was removed
from the list.
7
• Two four digit codes were included along with their five digit counterparts. As these four
digit codes can not be used since a more specific code is available, they were removed from
the list. These codes were:
• 283.1 Non-autoimmune hemolytic anemias
• 787.0 Nausea and vomiting
VII. Panelist Comments on the Specific Codes
• Streptococcal septicemia (038.0)– not necessarily starting as inpatient problem
• Hypoglycemic coma (251.0), drug induced diagnoses (292.11, 292.12, 292.2, 292.81, 292.83,
292.84, 292.89, 292.9), neuroleptic malignant syndrome (333.92), reaction to spinal/lumbar
puncture (349.0), polyneuropathy due to drugs (357.6) – equal likelihood of outpatient
treatment as cause
• Cushing’s syndrome (255.0) – not due to hospital care
• Infection of tracheosotomy – developing before on after hospitalization?
• Infection of gastrosotomy – Was gastrostomy done this admit?
• Closure of laceration of liver (50.61) – Likely to be external trauma
• Iatrogenic pulmonary embolism and infarction vs other pulmonary embolism and infarction
(415.11, 415.19) – how do you know it is iatrogenic vs not?
• Complications from devices, procedures (60 codes) - Just don't treat the patient and it
cannot happen
• Other specified complications (999.89), Unspecified complication of procedure, not
elsewhere classified (998.9), Accidental cut, puncture, perforation, or hemorrhage during
other specified medical care (E870.8), Accidental cut, puncture, perforation, or hemorrhage
during unspecified medical care (E870.9) –
What magnitude?
• Nausea and vomiting (787.0) - not a complete code needs a 5th digit: see next three codes
[This code was subsequently removed from the proposed list.]
• Accidental poisoning (E850-E858) - assumes these are accidental (eg a child gets into a
bottle) or intentional and that such actions are beyond the scope of the health care
system: a point that is quite debatable.
• Suicide and self-inflicted poisoning (E950) - How does this differ from accidental
poisoning? It is a debatable point, but many people would consider these unavoidable,
as they occur outside the scope of the health care system. Others, however, would argue
8
that an effective health care system should be able to pre-identify these situations and
take steps (eg child-proof caps) that prevent or mitigate them.
VIII. Adverse Event Classes
There will be two samples of charts during chart review: the flagged sample (each chart will
have at least one potential AE code) and the unflagged sample. For each sample, 1800 charts will
be pulled.
As the preliminary list of codes numbered almost 1100, pulling charts at the individual code
level (as well as reporting results of the chart review solely at the code level) did not seem
feasible.
As such, the adverse event codes have been grouped into classes of similar codes for sampling,
analysis, and reporting.
Below is the analysis of panelists’ medical care rating for codes grouped into the proposed AE
classes. For more detailed descriptions of the classes along with the codes included in each class,
please see the excel file named “listofAEclasses”.
Table 4. Descriptive Statistics of Median for Medical Care by AE Class
AE Class Count Median of
M_care
Median
Mean of
M_care
Median
Standard
Deviation
Range of
M_care
Median
Col %
1 Reopening of surgical site, control of
post-procedure hemorrhage
14 3.5 3.75 0.64 2 1.40%
2 Infections 65 2 2.56 0.73 2 6.50%
3 Perforation or laceration 20 4 4.03 0.92 3 2.00%
4 Endocrine disorders 7 2.5 2.21 0.7 2 0.70%
5 Metabolic/immunity disorders 10 2.5 2.7 0.54 1.5 1.00%
6 Anemias, coagulation defects,
hemorrhagic conditions
8 2 2.25 0.38 1 0.80%
7 Drug psychoses 10 4.5 4.35 0.91 3 1.00%
8 Disorders of nervous system 10 3.25 3.55 0.64 1.5 1.00%
9 Acute myocardial infarction 20 2 2 0 0 2.00%
10 Pulmonary embolism 2 4 4 1.41 2 0.20%
11 Heart disease 3 3 3 1 2 0.30%
12 Diseases of veins and lymphatics 11 3 3.32 0.6 2 1.10%
13 Respiratory system diseases 12 3 3 0.88 3 1.20%
14 GI system diseases 49 2 2.44 0.73 2 4.90%
15 Urinary system disorders 6 3 3 0 0 0.60%
16 Labor and delivery complications 97 4 3.59 0.61 2 9.70%
17 Complications of puerperium 24 3 2.63 0.65 2 2.40%
18 Dermatitis 5 4.5 4.3 0.84 2 0.50%
19 Decubitus ulcer 1 2.5 2.5 . 0 0.10%
20 Urticaria 4 3 3 0 0 0.40%
9
21 Maternal causes of perinatal harm,
newborn drug reactions
4 55000.40%
22 Mental status alterations 5 2 2 0 0 0.50%
23 Rash, ecchymoses 2 2.5 2.5 0.71 1 0.20%
24 Epistaxis, throat hemorrhage 2 3 3 0 0 0.20%
25 Shock 3 3 3 0 0 0.30%
26 Hemoptysis 1 3 3 . 0 0.10%
27 Sudden death 2 3 3 0 0 0.20%
28 Respiratory arrest 1 3 3 . 0 0.10%
29 Poisoning by antibiotics 22 5 5 0 0 2.20%
30 Poisoning by hormones 11 5 5 0 0 1.10%
31 Poisoning by primarily systemic
agents
9 55000.90%
32 Poisoning by agents affecting blood
constituents
11 5 5 0 0 1.10%
33 Poisoning by analgesics, antipyretics,
antirheumatics
20 5 5 0 0 2.00%
34 Poisoning by anticonvulsant, anti-
Parkinsonian drugs
7 55000.70%
35 Poisoning by sedatives and hypnotics 18 5 5 0 0 1.80%
36 Poisoning by other CNS depressants,
stimulants, nervous system agents
16 5 5 0 0 1.60%
37 Poisoning by psychotropic agents 20 5 5 0 0 2.00%
38 Poisoning by other agents 90 5 5 0 0 9.00%
39 Certain adverse effects not elsewhere
classified
6 4.25 4.08 0.92 2 0.60%
40 Complications peculiar to specified
procedures
57 5 4.7 0.46 1 5.70%
41 Complications affecting specified
body systems
13 5 4.35 0.88 2.5 1.30%
42 Other complications of procedures 13 4 4.04 0.52 2 1.30%
43 Complications of medical care, not
elsewhere classified
10 5 5 0 0 1.00%
44 Accidental cut, puncture, perforation,
or hemorrhage
11 5 5 0 0 1.10%
45 Other misadventures of surgical and
medical care
51 5 5 0 0 5.10%
46 Surgical operation/procedure as
cause of abnormal reaction/complication
9 4 4.06 0.39 1.5 0.90%
47 Other procedures without mention of
misadventures
10 4.5 4.5 0 0 1.00%
48 Accidental falls 8 4 4.06 0.18 0.5 0.80%
49 Adverse effects of antibiotics 20 5 5 0 0 2.00%
50 Adverse effects of hormones 10 5 5 0 0 1.00%
51 Adverse effects of primarily systemic
agents
8 55000.80%
52 Adverse effects of agents affecting
blood constituents
10 5 5 0 0 1.00%
10
53 Adverse effects of analgesics,
antipyretics, antirheumatics
10 5 5 0 0 1.00%
54 Adverse effects of anticonvulsant,
anti-Parkinsonian drugs
5 55000.50%
55 Adverse effects of sedatives and
hypnotics
9 55000.90%
56 Adverse effects of other CNS
depressants, stimulants, agents
18 5 5 0 0 1.80%
57 Adverse effects of psychotropic
agents
10 5 5 0 0 1.00%
58 Adverse effects of agents affecting
the cardiovascular system
10 5 5 0 0 1.00%
59 Adverse effects of other agents 61 5 5 0 0 6.10%
60 Suicide and self-inflicted injury 13 4 4.46 0.52 1 1.30%
61 Homicide, injury purposely inflicted by
other persons
2 55000.20%
62 Poisoning (undetermined whether
accidental or purposeful)
7 55000.70%
Total 1003 5 3.96 1.24 4 100.00%
APPENDIX A: Membership for the Expert Panel
Utah/Missouri Patient Safety Project (AHRQ #U18 HS11885)
Principal Investigator: Scott D. Williams, MD, MPH, Utah Dept. of Health
Project Officer: James Battles, PhD, AHRQ
The Subject Expert Panel:
Panel Members:
Robert T. Rolfs, MD, MPH, Utah Department of Health, UT (Chair)
Jonathan Nebeker, MD, Salt Lake City VA hospital, UT (Vice Chair)
Byron Bair, MD, Salt Lake City VA hospital, UT
Cathleen Barnes, RHIA, CCS, the MEDSTAT Group, CA
Kim Bateman, MD, HealthInsight, UT
Dave Bestenlehner, PharmD., Ashley Valley Medical Center, UT
Steven L. Clark, MD, University of Utah School of Medicine, UT
J. Michael Dean, MD, MBA, University of Utah School of Medicine, UT
Scott Evans, PhD, LDS Hospital, Intermountain Health Care, UT
Jeffrey Geppert, JD, Stanford University School of Medicine, CA
Jan Haug, Medical Records Expert, HealthInsight, UT
Paul Hougland, MD, Utah Department of Health, UT
Stanley M. Huff, MD, University of Utah and Intermountain Health Care, UT
Brent C. James, MD, IHC Institute of Health Care Delivery Research, UT
Kevin B. Johnson, MD, Jordan Valley Hospital, UT
Gregg Laiben, MD, Missouri Patient Care Review Foundation, MO
Joseph Malone, MD, Missouri Department of Health and Senior Services, MO
11
Steven Meisel, PharmD., Fairview Southdale Hospital, Minnesota
Marlene Miller, MD, AHRQ, Quality Improvement and Patient Safety, D.C.
Brent Peterson, PharmD., Sanpete Valley Hospital, UT
Michael Pine, MD, Michael Pine & Associates, Inc. Chicago, IL
Matthew Samore, MD, University of Utah School of Medicine, UT
William Sangster, MD, FACS, University of Missouri – Columbia, MO
Eduardo J. Simoes, MD, Missouri Department of Health, MO
Steve Solomon, MD, Div. Healthcare Quality Improvement, CDC, GA
Mary L. Staub, RHIA, Intermountain Health Care, UT
Rosalyn Steck, RHIA, CCS, Capital Region Medical Center, MO
Maxine Tate, RHIA, Missouri Patient Care Review Foundation, MO
Michael Varner, MD, University of Utah School of Medicine, UT
Panel Staff:
Wu Xu, PhD, Utah Department of Health, UT
Paul Hougland, MD, Utah Department of Health, UT
Carol Masheter, Ph.D. Utah Department of Health, UT
Mike Silver, MPH, HealthInsight, UT
Susan Elder, MA, Missouri Department of Health, MO
John Song, Missouri Department of Health, MO
Mark Van Tuinen, Missouri Department of Health, MO
Tracey Pritchett, Missouri Patient Care Review Foundation, MO
Project Evaluator:
Dan Longo, ScD, University of Missouri – Columbus, MO
Report outline and rating information sheets are prepared by Paul Hougland, Carol
Masheter, and Wu Xu.