Comparing the Auditability of Optical Scan, Voter Verified Paper Audit Trail (VVPAT) and Video (VVVAT) Ballot Systems potx
Bạn đang xem bản rút gọn của tài liệu. Xem và tải ngay bản đầy đủ của tài liệu tại đây (1.62 MB, 7 trang )
Comparing the Auditability of Optical Scan, Voter Verified Paper
Audit Trail (VVPAT) and Video (VVVAT) Ballot Systems
Stephen N. Goggin and Michael D. Byrne
Department of Psychology
Rice University, MS-25
Houston, TX 77005-1892 USA
{goggin, byrne}@rice.edu
Juan E. Gilbert, Gregory Rogers, and Jerome
McClendon
Department of Computer Science and Software
Engineering
Auburn University
Auburn, AL 36849-5347 USA
{gilbert, rogergd, mccleje}@auburn.edu
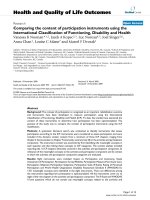
ABSTRACT
With many states beginning to require manual audits of election ballots, comparing the auditability of different types
of ballot systems has become an important issue. Because the majority of counties in the United States are now
using either Direct Recording Electronic (DRE) voting systems equipped with Voter Verified Paper Audit Trail
(VVPAT) modules or optical scan ballot systems, we examined the usability of an audit or recount on these two
systems, and compared it with the usability of a prototype Voter Verified Video Audit Trail (VVVAT) system. Error
rates, time, satisfaction, and confidence in each recount were measured. For the VVPAT, Optical Scan, and Video
systems, only 45.0%, 65.0% and 23.7% of participants provided the correct vote counts, respectively. VVPATs were
slowest to audit. However, there were no meaningful differences in subjective satisfaction between the three
methods. Furthermore, confidence in count accuracy was uncorrelated with objective accuracy. These results
suggest that redundant or error-correcting count procedures are vital to ensure audit accuracy.
INTRODUCTION
Since the Help America Vote Act (HAVA) of 2002,
many jurisdictions in the United States have used
federal funds intended to help modernize their voting
systems by purchasing newer Direct Recording
Electronic (DRE) voting machines. With security
concerns mounting over purely electronic election
results, 37 states have chosen to require physical
copies of every ballot cast on an electronic system.
The requirement for physical copies of ballots cast is
usually met by a voting machine vendor’s
implementation of a Voter Verified Paper Audit Trail
(VVPAT) system.
VVPAT systems usually consist of a thermal printer
attached to a DRE voting system with a spool of
ballots enclosed within the machine. Each voter is to
inspect his or her paper ballot to verify it matches the
electronic record before casting the ballot. These
paper records can also be used for a recount. While
VVPAT implementations are common, 40.8% of
voters in the 2006 election used some type of optical
scan voting system (Election Data Services, 2006).
These optical scan ballots could also be used in
manual auditing procedures. New technologies are
being developed as well, such as both Audio
(VVAAT) and Video (VVVAT) audit systems.
Currently, 19 states require at least some ballots to be
recounted in every election (Verified Voting
Foundation, 2008). Of these states, 17 mandate
recounts of VVPAT systems, while 2 only mandate
recounts of summary results, not individual ballots.
As the auditing of elections by manual recounts
becomes mandated by more states, it is necessary to
examine usability issues in conducting these
recounts.
In addition, the draft revision of the federal Voluntary
Voting System Guidelines (2007) contains
recommendations regarding the manual audit
capacity of ballots. Specifically, requirements 4.4.1-
A.2 and A.3 in the document specify an Independent
Voter-Verifiable Record (IVVR) must have the
capacity for a software-independent, manual audit by
election officials. While the VVSG requires this, it
does not preclude the possibility of machine-assisted
auditing, through optical scan and optical character
recognition (OCR). In fact, both the original VVSG
(2005) and the rewrite specifically demand that
IVVR records must contain the ballot information in
a machine-readable form.
While Goggin and Byrne (2007) and the Georgia
Secretary of State’s Office (2006) have previously
examined the auditability of VVPAT ballots, we
know of no other research examining human
performance with auditing or recounting election
records. With states beginning to require auditing of
all systems, it is important to examine the impact of
different ballot systems in their ability to support a
manual audit. While hand audits in studies such as
Ansolabehere and Reeves (2004) have usually been
considered the “gold standard” against which other
vote counts are compared, the way in which election
officials can manually audit different types of ballots
should also be studied.
While VVPAT and VVVAT systems are both
designed primarily for audit purposes, the actual
implementation of VVPAT auditing has not been free
from problems. For example, the Election Science
Institute (ESI) examined all aspects of election
administration in Cuyahoga County, Ohio during the
May 2006 primary election. The ESI report found
that 10% of VVPAT spools were unreadable or
missing, while 19% of the spools indicated
discrepancies with the reported counts (ESI, 2006).
Alternatives like VVVAT systems are still currently
under development.
Optical scan ballot systems, while also providing a
paper record of a voter’s ballot, are not designed
simply for audits; an optical scan ballot is the primary
record of the voter’s intentions, which is then read by
an optical scan machine. Because a voter interacts
with an optical scan ballot by hand using a marking
device, most commonly a pencil, this also places the
additional burden of not just conducting a recount of
computer-printed ballots, but interpreting the marks
made by voters on the ballot. Unfortunately, the
accuracy and time cost of conducting a manual audit
of optical scan ballots after an election has never
been systematically examined.
Naturally, the most important characteristic of an
audit system should be accuracy, but that should not
be the only consideration. The U.S. National Institute
of Standards and Technology (Laskowski, et al.,
2004) has recommended that voting systems be
evaluated on the ISO criteria of effectiveness,
efficiency, and satisfaction. While effectiveness can
be equated to auditability in that it is a measure of
accuracy, it is also important to include the other two
metrics in the analysis. If an audit system is not
efficient, it may pose unnecessary costs to counties
and states that implement it. Furthermore, if auditors
are not satisfied with the system they are using, they
may lack confidence in the results and undesired and
unnecessary strain may be placed on those
conducting the audit.
In an important sense, our study represents a best-
case audit scenario. All the ballots provided to
participants were accurately completed and marked,
and in ideal physical condition. While our study does
differ from actual auditing in that real audits often
use multiple counters for the same ballots to improve
accuracy, we sought to establish a base rate of error
in auditing that this redundancy guards against.
METHOD
Participants
Twenty-eight adults participated in the study on a
volunteer basis. One participant declined to provide
their demographic information and complete the
second part of the experiment. There were 11 male
and 16 female participants (1 declined to report
gender), with an average age of 73 years old (SD =
7.5). All participants were fluent English speakers,
and all had normal or corrected to normal vision.
Eight participants had previously worked as election
officials; those that had worked in elections had
worked in an average of 16. The sample was quite
well-educated, with 4 participants completing some
college, 5 with bachelor’s degrees, and 18 holding
advanced educational degrees. While this sample is
obviously not representative of the overall voting
population, it is a reasonable representation of the
poll worker population.
Design
Three independent variables were manipulated in the
current study, two between-subjects and one within.
The first between-subjects factor was technology:
participants counted either a spool of 120 VVPAT
ballots, 120 optical scan ballots, or 120 video ballots.
The second between-subjects variable was the
rejection rate, or the number of invalid ballots in the
VVPAT spools or the optical-scan ballots. Due to the
nature of the Video ballots, no “rejected” ballots
could be included in this condition. There were two
levels of the rejection rate; high, in which 8 of 120
ballots (6.6%) were invalid, and low, where only 4
ballots (3.3%) were invalid. The within-subjects
variable was the closeness of the counted races. In
the close condition, the margin of victory was
roughly 5% of the total vote, while in the lopsided
condition, the margin of victory was roughly 30% of
the total vote.
There were three dependent variables measured in the
study, each corresponding to one of the three
usability metrics: effectiveness, efficiency, and
satisfaction. For effectiveness, error rates in the
counted totals were used. These were calculated in
multiple ways, which will be discussed within the
results section. Next, for efficiency, simply the time
participants took to count all 120 ballots for one of
the races was used. Finally, for satisfaction, the
common System Usability Scale (SUS), developed
by Brooke (1996) was used. This common, 10-
question, standardized subjective scale was used to
assess participant’s reactions to the different audit
systems; the scores range from 0-100, with a score of
100 representing an ideal technology in terms of
usability. Additionally, participants were asked to
rate their confidence in the accuracy of their counts
on a 5-point Likert scale. To supplement the
quantitative results, several open-ended questions
were asked of participants about their confidence in
the accuracy of their counts and for comments and
suggestions regarding problems encountered with the
audit system.
Materials
All ballots counted were cast based on a fictional, 27-
race ballot, originally prepared by Everett, Byrne and
Greene (2006). The ballot contained 21 political
races and 6 propositions; only 2 of the 27 races were
counted by participants. To make the ballots appear
similar to those that might be cast in a real election,
the ballot roll-off rate, or the rate of abstention as a
function of ballot position, was made higher for those
races further down the ballot based on the findings of
Nichols and Strizek (1995). Specifically, the
abstention rate for the upper race audited, the US
House of Representatives contest, was set at 9%
while for the lower race, County District Attorney,
was set at 15%.
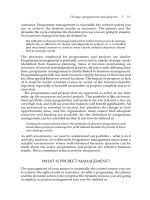
The VVPAT ballot spools, identical to those used by
Goggin and Byrne (2007), met both the 2005 VVSG
standards regarding VVPAT usability in section 7.9.6
(pp. 143-144) and the draft VVSG standards released
in 2007. These VVPATs were prepared to appear as
similar as possible to those stored in actual DRE
machines manufactured by major voting machine
vendors (See Figure 1). During an election, these
VVPAT ballots are wound onto a secondary spool
inside the DRE, after which they are removed and
counted. A ballot bore a “rejected” notation at the
bottom if it was invalidated by the voter during the
verification process, as suggested by the 2005 VVSG
in paragraph 7.9.2 (p. 137). Although not all counties
use an audit procedure in which the VVPATs are
manually separated, participants were allowed to
separate the ballots using a scissors during the study
to make them easier to count.
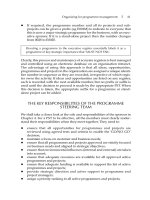
The optical-scan ballots were printed on legal-sized
paper, and were identical to those first used by
Everett, Byrne and Greene (2006) (See Figure 2).
The ballots were completed prior to the study in
pencil, as they would normally be filled out by
voters. In order to match the “rejected” status of
ballots for VVPAT’s, some ballots were intentionally
over-voted to render them invalid.
Figure 1. Partial VVPAT ballot
Figure 2. Partial optical scan ballot
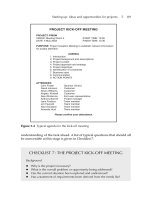
The video ballots were created using the Prime III
system (Cross, et. al., 2007; McMillian, et. al., 2007).
The Prime III system uses video surveillance to
monitor the voting machines. The voter can review
the video screen capture of their own voting process
to verify accuracy. This produces a voter-verified
video audit trail (VVVAT). During a recount or
audit, the video and audio ballots are played back on
a video player. The review screen was designed with
a yellow background to contrast against the other
video frames that contain a neutral background. The
yellow background enables the auditor to easily find
the ballot frames. In the lower right hand corner of
the video ballot, the video player places a number
that represents the ballots in sequence from 1 to N,
where N is the total number of ballots on the video.
Also notice that the video text on the video ballot
alternates in color from black to blue. This color
scheme was implemented to make the ballots easier
to read. The video player is currently under
development; therefore, the video player was
simulated using Microsoft Powerpoint. An image of
the ballot was captured from the video with its
corresponding audio to produce a video ballot (See
Figure 3). The audio read the ballot. The study
participants would simply advance the images using
Powerpoint to hear the ballot and conduct the audit.
Each slide was a ballot with audio.
Figure 3. Video Ballot
Procedures
Participants completed both a short demographic
survey before beginning the counting procedure, and
a longer, detailed questionnaire about the counting
procedure after completing the counting tasks.
Participants were given detailed written instructions
for the counting procedure, including visual diagrams
of important aspects of the ballot to examine. The
instructions, although concise, provided a step-by-
step procedure for counting the ballots.
For the VVPAT condition, the instructions were
similar to those given by Goggin and Byrne (2007),
instructing participants to first separate the ballots
from the spool using scissors, discarding all
“rejected”, and therefore invalid ballots. Next,
participants were instructed to count one of the two
selected races on the ballot using a provided tally
sheet, on which participants could write the counted
totals. After the count of one race was complete,
participants were given a second tally sheet for the
second race, and were asked to count the ballots
again; because the ballots were already separated,
this task was not present in the second race that was
audited in the VVPAT condition.
For the optical-scan ballots, the instructions asked the
participants to tally the marked votes on the stack of
ballots. Because the ballots were carefully and clearly
marked, there were no ambiguous or stray marks that
could cause problems with interpretation and optical-
scan readers. Some ballots, however, were over-voted
in the specific races that were audited. Participants
were instructed to treat these ballots as invalid –
neither an under-vote nor a valid vote for either
candidate.
For the video ballot condition, participants were
instructed to tally the votes using the video player
simulation tool, Powerpoint. They were given
instructions on how to advance from ballot to ballot
using the arrow keys and the space bar. They were
also instructed to count only the indicated race and
mark their totals on their tally sheet.
RESULTS
Effectiveness
This is clearly the most important metric for auditing
or recounting. Because there are two candidates per
each race counted, there are several different
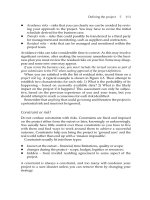
calculations that could quantify error rates. We first
calculated error on the level of each individual
candidate, using signed differences to account for
both over- and under-counts. As is apparent in Figure
4, the optical scan ballots tended to produce over-
counts for each candidate while the video ballots
tended to produce undercounts. The effect of
technology was statistically reliable, F(2, 22) = 7.95,
p = .003. Posthoc tests reveal the Video to be reliably
different from the others, but no reliable difference
was found between VVPAT and Optical Scan. (The
Ryan-Einot-Gabriel-Welsch test was used for all
posthocs.) We found no reliable effects of the rate of
rejected ballots or the closeness of the race that was
counted.
Taking the absolute values of the error measures
above, that is, treating an undercount the same as an
overcount, produces the data shown in Table 1.
While the VVVAT produced the highest error rate,
this difference, while suggestive, is not significant at
conventional alpha levels, F(2, 22) = 2.60, p = .097.
Figure 4. Signed error rate by technology
Technology
Error Rate
95% Confidence
Interval
Optical Scan
0.9%
0% to 2.1%
VVPAT
1.4%
0.2% to 2.6%
Video
2.7%
1.5% to 4.0%
Table 1. Absolute error rates as a percent of
candidate’s votes by technology
Technology
Lopsided
Race
Close Race
Optical Scan
60%
70%
VVPAT
50%
40%
Video
33%
11%
Table 2. Percentage of perfectly-counted races by
technology and race closeness.
We also calculated whether participants had correctly
counted each race, which produced two dichotomous
variables for each participant, one for the lopsided
race counted by each participant and one for the close
race. These results are summarized in Table 2. For
the close race, logistic regression revealed that
Optical Scan was reliably better than VVPAT (β =
1.56, w = 5.14, p = .02) and Video was reliably worse
than VVPAT (β = -1.67, w = 4.09, p = .04). The
differences in the lopsided race were not reliable.
Efficiency
One participant was excluded from the efficiency
analysis due to extreme counting times on both races;
we believe this participant did not accurately report
not-fully-corrected low vision. Results for counting
time are presented in Figure 5. Obviously, VVPATs
suffered from an extremely slow first count; this is
due to the need to physically separate the ballots from
the spool in the first count. (This difference is
reliable; interaction F(2, 24) = 45.20, p < .001.)
However, simple main effects analysis showed a
reliable effect of technology in both the first race,
F(2, 25) = 33.59, p < .001, and the second race, F(2,
24) = 4.53, p = .02. In the first race posthocs revealed
that VVPAT counting was slower than both other
types, but in the second race VVPATs could only be
discriminated from Video, with Optical Scan being
indistinguishable from both other technologies.
Figure 5. Counting time by count order and
technology
Satisfaction and Subjective Measures
The mean SUS score for Optical Scan was 67.2, for
VVPAT was 70.3 and for Video was 82.5; however,
there was enormous variability in satisfaction and so
this difference was not statistically reliable, F(2, 21)
= 2.08, p = .15. Mean confidence ratings for the three
groups were 4.0, 4.6, and 4.3, which was also not a
reliable difference, F(2, 21) = 0.85, p = .44.
Interestingly, the ratings of confidence in the
accuracy of their counts were not significantly
correlated with any of the measures of effectiveness
above; the largest absolute correlation was with the
signed error rate for the second candidate in the
lopsided race, r = .36, p = .07. While this is
somewhat suggestive, one has to keep in mind that
the average correlation across all measures was
statistically indistinguishable from zero. People’s
sense of their own accuracy is not related to objective
accuracy.
DISCUSSION
Clearly, individuals auditing or counting ballots is an
error-prone process. Overall, no technology fared
particularly well in terms of producing perfect
counts. Our results suggest that people count optical
scan ballots somewhat more accurately than VVPAT
paper tapes or video records. VVPATs also have the
drawback of being slower to count than other ballot
types. Interestingly, these performance differences
did not manifest themselves in the subjective ratings.
This dissociation between subjective and objective
measures is similar to those found by Everett, et al.
(2008) except in reverse; they found strong
differences in preference associated with essentially
no difference in performance. It seems clear that in
the election domain preference and performance are
not strongly linked, counter to many people’s
intuitions. This also manifested itself in the fact that
people’s subjective sense of confidence in the count
is not a predictor of objective count accuracy.
Of course, the inaccuracies in individual counts
should not be taken to mean that all audits are suspect
(though it is not encouraging, either). Instead, they
point to the need for election officials to make sure
counts are double-checked. And, in fact, our
procedure does differ from the actual procedure used
by many election officials around the United States in
that we did not use multiple auditors to check the
counts for accuracy. However, we did pilot group
counting procedures with all three technologies. Our
experience with this strongly suggested that clear
standardization of the group procedures, particularly
how to reconcile disparities, is likely to have a far
more substantial impact on both time and accuracy
than is the underlying technology.
This raises a difficult research issue. Group counting
methods range from having two individuals count
and recount until they both agree to larger groups
where every group member is supposed to agree on
the count as every ballot passes through the process,
and mostly likely many other variants we have never
seen. Presumably all such methods have the goal of
mitigating individual inaccuracy, but as far as we
know no group counting procedure has been
empirically validated. The question, then, for follow-
up research is “Which group procedure to measure”?
Furthermore, even if one selects a handful of group
procedures to measure, the results will have limited
generality, since any particular method only
represents a small fraction of the methods actually in
use today.
Our results suggest that whatever safeguards are in
place need to be particularly well-employed if optical
scan ballots are replaced by VVPATs or video
systems because such systems can have substantially
greater needs for error mitigation. In the best-case
scenario for these two technologies a mere half the
counts were actually correct, this seems like a great
deal of error for any redundancy or other procedural
solution to address.
Of course, these results apply only to the particular
video system tested; our results do not imply that a
video-based system cannot be the equal of paper-
based systems, only that this one presently is not, at
least in terms of effectiveness. There are hints in the
data that the video system may be able to outperform
the others on speed and satisfaction, thus if the video
system could be equated on accuracy it might be an
important advance. Perhaps changes in screen design
or other user interface features of the video system
can close the accuracy gap; clearly, more research
will be necessary to produce better systems.
Regardless of the underlying technology, it is clear
that individual counts are neither rapid nor especially
accurate. This in and of itself is not particularly
surprising. However, the extent of this phenomenon
has not been well documented. Furthermore, the fact
that reported confidence in a count does not predict
the actual accuracy of the count suggests that checks
need to be based only on objective counts and not
reports from auditors about how well they thought
the count went.
ACKNOWLEDGMENTS
This research was supported by the National Science
Foundation under grants #CNS-0524211 (the
ACCURATE center) and #IIS-0738175. The views
and conclusions contained herein are those of the
authors and should not be interpreted as representing
the official policies or endorsements, either expressed
or implied, of the NSF, the U.S. Government, or any
other organization.
REFERENCES
Ansolabehere, S. & Reeves, A. (2004). Using
Recounts to Measure the Accuracy of Vote
Tabulations: Evidence from New Hampshire
Elections 1946-2002.
< />p_wp11.pdf>
Brooke, J. (1996) SUS: a “quick and dirty” usability
scale. In P. W. Jordan, B. Thomas, B. A.
Weerdmeester & A. L. McClelland (Eds.)
Usability Evaluation in Industry. London: Taylor
and Francis.
Cross, E.V., Rogers, G., McClendon, J., Mitchell,
W., Rouse, K., Gupta, P., Williams, P., Mkpong-
Ruffin, I., McMillian, Y., Neely, E., Lane, J.,
Blunt, H. & Gilbert, J.E. (2007) Prime III: One
Machine, One Vote for Everyone. VoComp
2007, Portland, OR, July 16, 2007.
Election Assistance Commission. (2005, December
15). Voluntary Voting System Guidelines.
< />system-certification/2005-vvsg/>
Election Assistance Commission. (2007, October 31).
Draft of Voluntary Voting System Guidelines.
<
Election Data Services. (2006, February 6). 69
Million Voters will use Optical Scan Ballots in
2006; 66 Million Voters will use Electronic
Equipment. Election Data Services Press
Release.
< />VEStudy2006.pdf>
Election Science Institute. (2006). DRE Analysis for
May 2006 Primary Cuyahoga County, Ohio. San
Fransisco, CA.
< />yahoga_final.pdf>
Everett, S. P., Byrne, M. D., & Greene, K. K. (2006).
Measuring the usability of paper ballots:
Efficiency, effectiveness, and satisfaction.
Proceedings of the Human Factors and
Ergonomics Society 50th Annual Meeting. Santa
Monica, CA: Human Factors and Ergonomics
Society.
Everett, S. P., Greene, K. K., Byrne, M. D., Wallach,
D. S., Derr, K., Sandler, D., & Torous, T. (2008,
in press). Electronic voting machines versus tra-
ditional methods: Improved preference, similar
performance. To appear in Human Factors in
Computing Systems: Proceedings of CHI 2008.
New York: ACM.
Georgia Secretary of State, Elections Division.
(2007). Voter Verified Paper Audit Trail: Pilot
Project Report, SB500 2006 Georgia Accuracy
in Elections Act.
< />ort.pdf>
Goggin, S. N. & Byrne, M. D. (2007). An
Examination of the Auditability of Voter
Verified Paper Audit Trail (VVPAT) Ballots.
Proceedings of the 2007 USENIX/ACCURATE
Electronic Voting Technology Workshop.
Boston, MA.
Laskowski, S. J., Autry, M., Cugini, J., Killam, W.,
& Yen, J. (2004). Improving the usability and
accessibility of voting systems and products.
NIST Special Publication 500-256.
McMillian, Y., Williams, P., Cross, E.V., Mkpong-
Ruffin, I., Nobles, K., Gupta, P. & Gilbert, J.E.
(2007) Prime III: Where Usable Security &
Electronic Voting Meet. Usable Security (USEC
’07), Lowlands, Scarborough, Trinidad/Tobago,
February 15-16, 2007.
Nichols, S.M. & Strizek, G.A. (1995). Electronic
Voting Machines and Ballot Roll-Off. American
Politics Quarterly. 23(3), 300-318.
Verified Voting Foundation. (2008). Manual Audit
Requirements.
< />udits0108.pdf>