Báo cáo khoa học: "A System for Real-time Twitter Sentiment Analysis of 2012 U.S" pdf
Bạn đang xem bản rút gọn của tài liệu. Xem và tải ngay bản đầy đủ của tài liệu tại đây (708.07 KB, 6 trang )
Proceedings of the 50th Annual Meeting of the Association for Computational Linguistics, pages 115–120,
Jeju, Republic of Korea, 8-14 July 2012.
c
2012 Association for Computational Linguistics
A System for Real-time Twitter Sentiment Analysis of
2012 U.S. Presidential Election Cycle
Hao Wang*, Dogan Can**, Abe Kazemzadeh**,
François Bar* and Shrikanth Narayanan**
Annenberg Innovation Laboratory (AIL)*
Signal Analysis and Interpretation Laboratory (SAIL)**
University of Southern California, Los Angeles, CA
{haowang@, dogancan@, kazemzad@, fbar@, shri@sipi}.usc.edu
Abstract
This paper describes a system for real-time
analysis of public sentiment toward
presidential candidates in the 2012 U.S.
election as expressed on Twitter, a micro-
blogging service. Twitter has become a
central site where people express their
opinions and views on political parties and
candidates. Emerging events or news are
often followed almost instantly by a burst
in Twitter volume, providing a unique
opportunity to gauge the relation between
expressed public sentiment and electoral
events. In addition, sentiment analysis can
help explore how these events affect public
opinion. While traditional content analysis
takes days or weeks to complete, the
system demonstrated here analyzes
sentiment in the entire Twitter traffic about
the election, delivering results instantly and
continuously. It offers the public, the
media, politicians and scholars a new and
timely perspective on the dynamics of the
electoral process and public opinion.
1 Introduction
Social media platforms have become an important
site for political conversations throughout the
world. In the year leading up to the November
2012 presidential election in the United States, we
have developed a tool for real-time analysis of
sentiment expressed through Twitter, a micro-
blogging service, toward the incumbent President,
Barack Obama, and the nine republican
challengers - four of whom remain in the running
as of this writing. With this analysis, we seek to
explore whether Twitter provides insights into the
unfolding of the campaigns and indications of
shifts in public opinion.
Twitter allows users to post tweets, messages of
up to 140 characters, on its social network. Twitter
usage is growing rapidly. The company reports
over 100 million active users worldwide, together
sending over 250 million tweets each day (Twitter,
2012). It was actively used by 13% of on-line
American adults as of May 2011, up from 8% a
year prior (Pew Research Center, 2011). More than
two thirds of U.S. congress members have created
a Twitter account and many are actively using
Twitter to reach their constituents (Lassen &
Brown, 2010; TweetCongress, 2012). Since
October 12, 2012, we have gathered over 36
million tweets about the 2012 U.S. presidential
candidates, a quarter million per day on average.
During one of the key political events, the Dec 15,
2011 primary debate in Iowa, we collected more
than half a million relevant tweets in just a few
hours. This kind of ‘big data’ vastly outpaces the
capacity of traditional content analysis approaches,
calling for novel computational approaches.
Most work to date has focused on post-facto
analysis of tweets, with results coming days or
even months after the collection time. However,
115
because tweets are short and easy to send, they
lend themselves to quick and dynamic expression
of instant reactions to current events. We expect
automated real-time sentiment analysis of this
user-generated data can provide fast indications of
changes in opinion, showing for example how an
audience reacts to particular candidate’s statements
during a political debate. The system we present
here, along with the dashboards displaying analysis
results with drill-down ability, is precisely aimed at
generating real-time insights as events unfold.
Beyond the sheer scale of the task and the need
to keep up with a rapid flow of tweets, we had to
address two additional issues. First, the vernacular
used on Twitter differs significantly from common
language and we have trained our sentiment model
on its idiosyncrasies. Second, tweets in general,
and political tweets in particular, tend to be quite
sarcastic, presenting significant challenges for
computer models (González-Ibáñez et al., 2011).
We will present our approaches to these issues in a
separate publication. Here, we focus on presenting
the overall system and the visualization dashboards
we have built. In section 2, we begin with a review
of related work; we then turn in section 3 to a
description of our system’s architecture and its
components (input, preprocessing, sentiment
model, result aggregation, and visualization); in
sections 4 and 5 we evaluate our early experience
with this system and discuss next steps.
2 Related Work
In the last decade, interest in mining sentiment and
opinions in text has grown rapidly, due in part to
the large increase of the availability of documents
and messages expressing personal opinions (Pang
& Lee, 2008). In particular, sentiment in Twitter
data has been used for prediction or measurement
in a variety of domains, such as stock market,
politics and social movements (Bollen et al., 2011;
Choy et al., 2011; Tumasjan et al., 2010; Zeitzoff,
2011). For example, Tumasjan (2010) found tweet
volume about the political parties to be a good
predictor for the outcome of the 2009 German
election, while Choy et al. (2011) failed to predict
with Twitter sentiment the ranking of the four
candidates in Singapore’s 2011 presidential election.
Past studies of political sentiment on social
networks have been either post-hoc and/or carried
out on small and static samples. To address these
issues, we built a unique infrastructure and
sentiment model to analyze in real-time public
sentiment on Twitter toward the 2012 U.S.
presidential candidates. Our effort to gauge
political sentiment is based on bringing together
social science scholarship with advanced
computational methodology: our approach
combines real-time data processing and statistical
sentiment modeling informed by, and contributing
to, an understanding of the cultural and political
practices at work through the use of Twitter.
3 The System
For accuracy and speed, we built our real-time data
processing infrastructure on the IBM’s InfoSphere
Streams platform (IBM, 2012), which enables us to
write our own analysis and visualization modules
and assemble them into a real-time processing
pipeline. Streams applications are highly scalable
so we can adjust our system to handle higher
volume of data by adding more servers and by
distributing processing tasks. Twitter traffic often
balloons during big events (e.g. televised debates
or primary election days) and stays low between
events, making high scalability strongly desirable.
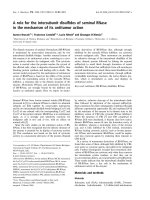
Figure 1 shows our system’s architecture and its
modules. Next, we introduce our data source and
each individual module.
Figure 1. The system architecture for real-time processing Twitter data
Preprocessing
e.g.,Tokenization
Match Tweet
to Candidate
Real-time
Twitter data
Throttle
Sentiment
Model
Aggregate by
Candidate
Visualization
Online
Human
Annotation
Recorded
data
116
3.1 Input/Data Source
We chose the micro-blogging service Twitter as
our data source because it is a major source of
online political commentary and discussion in the
U.S. People comment on and discuss politics by
posting messages and ‘re-tweeting’ others’
messages. It played a significant role in political
events worldwide, such as the Arab Spring
Movement and the Moldovian protests in 2009. In
response to events, Twitter volume goes up sharply
and significantly. For example, during a republican
debate, we receive several hundred thousand to a
million tweets in just a few hours for all the
candidates combined.
Twitter’s public API provides only 1% or less of
its entire traffic (the “firehose”), without control
over the sampling procedure, which is likely
insufficient for accurate analysis of public
sentiment. Instead, we collect all relevant tweets in
real-time from the entire Twitter traffic via Gnip
Power Track, a commercial Twitter data provider.
To cope with this challenge during the later stages
of the campaign, when larger Twitter traffic is
expected, our system can handle huge traffic bursts
over short time periods by distributing the
processing to more servers, even though most of
the times its processing load is minimal.
Since our application targets the political
domain (specifically the current Presidential
election cycle), we manually construct rules that
are simple logical keyword combinations to
retrieve relevant tweets – those about candidates
and events (including common typos in candidate
names). For example, our rules for Mitt Romney
include Romney, @MittRomney, @PlanetRomney,
@MittNews, @believeinromney, #romney, #mitt,
#mittromney, and #mitt2012. Our system is
tracking the tweets for nine Republican candidates
(some of whom have suspended their campaign)
and Barack Obama using about 200 rules in total.
3.2 Preprocessing
The text of tweets differs from the text in articles,
books, or even spoken language. It includes many
idiosyncratic uses, such as emoticons, URLs, RT
for re-tweet, @ for user mentions, # for hashtags,
and repetitions. It is necessary to preprocess and
normalize the text.
As standard in NLP practices, the text is
tokenized for later processing. We use certain rules
to handle the special cases in tweets. We compared
several Twitter-specific tokenizers, such as
TweetMotif (O'Connor et al., 2010) and found
Christopher Potts’ basic Twitter tokenizer best
suited as our base. In summary, our tokenizer
correctly handles URLs, common emoticons,
phone numbers, HTML tags, twitter mentions and
hashtags, numbers with fractions and decimals,
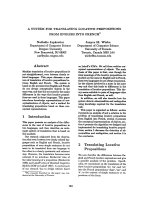
repetition of symbols and Unicode characters (see
Figure 2 for an example).
3.3 Sentiment Model
The design of the sentiment model used in our
system was based on the assumption that the
opinions expressed would be highly subjective and
contextualized. Therefore, for generating data for
model training and testing, we used a crowd-
sourcing approach to do sentiment annotation on
in-domain political data.
To create a baseline sentiment model, we used
Amazon Mechanical Turk (AMT) to get as varied
a population of annotators as possible. We
designed an interface that allowed annotators to
perform the annotations outside of AMT so that
they could participate anonymously. The Turkers
were asked their age, gender, and to describe their
political orientation. Then they were shown a
series of tweets and asked to annotate the tweets'
sentiment (positive, negative, neutral, or unsure),
whether the tweet was sarcastic or humorous, the
sentiment on a scale from positive to negative, and
the tweet author's political orientation on a slider
scale from conservative to liberal. Our sentiment
model is based on the sentiment label and the
sarcasm and humor labels. Our training data
consists of nearly 17000 tweets (16% positive,
56% negative, 18% neutral, 10% unsure),
including nearly 2000 that were multiply annotated
Tweet
WAAAAAH!!! RT @politico: Romney: Santorum's 'dirty tricks' could steal Michigan:
#MIprimary #tcot #teaparty #GOP
Tokens
WAAAAAH !!! RT @politico : Romney : Santorum's ' dirty tricks ' could steal
Michigan : #MIprimary #tcot #teaparty #GOP
Figure 2. The output tokens of a sample tweet from our tokenizer
117
to calculate inter-annotator agreement. About 800
Turkers contributed to our annotation.
The statistical classifier we use for sentiment
analysis is a naïve Bayes model on unigram
features. Our features are calculated from
tokenization of the tweets that attempts to preserve
punctuation that may signify sentiment (e.g.,
emoticons and exclamation points) as well as
twitter specific phenomena (e.g., extracting intact
URLs). Based on the data we collected our
classifier performs at 59% accuracy on the four
category classification of negative, positive,
neutral, or unsure. These results exceed the
baseline of classifying all the data as negative, the
most prevalent sentiment category (56%). The
choice of our model was not strictly motivated by
global accuracy, but took into account class-wise
performance so that the model performed well on
each sentiment category.
3.4 Aggregation
Because our system receives tweets continuously
and uses multiple rules to track each candidate’s
tweets, our display must aggregate sentiment and
tweet volume within each time period for each
candidate. For volume, the system outputs the
number of tweets every minute for each candidate.
For sentiment, the system outputs the number of
positive, negative, neutral and unsure tweets in a
sliding five-minute window.
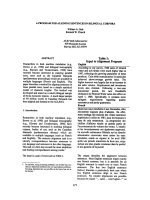
3.5 Display and Visualization
We designed an Ajax-based HTML dashboard
(Figure 3) to display volume and sentiment by
candidate as well as trending words and system
statistics. The dashboard pulls updated data from a
web server and refreshes its display every 30
seconds. In Figure 3, the top-left bar graph shows
the number of positive and negative tweets about
each candidate (right and left bars, respectively) in
the last five minutes as an indicator of sentiment
towards the candidates. We chose to display both
positive and negative sentiment, instead of the
difference between these two, because events
typically trigger sharp variations in both positive
and negative tweet volume. The top-right chart
displays the number of tweets for each candidate
every minute in the last two hours. We chose this
time window because a live-broadcast primary
debate usually lasts about two hours. The bottom-
left shows system statistics, including the total
number of tweets, the number of seconds since
system start and the average data rate. The bottom-
right table shows trending words of the last five
minutes, computed using TF-IDF measure as
follows: tweets about all candidates in a minute are
treated as a single “document”; trending words are
the tokens from the current minute with the highest
TF-IDF weights when using the last two hours as a
corpus (i.e., 120 “documents”). Qualitative
examination suggests that the simple TF-IDF
metric effectively identifies the most prominent
words when an event occurs.
The dashboard gives a synthetic overview of
volume and sentiment for the candidates, but it is
often desirable to view selected tweets and their
sentiments. The dashboard includes another page
Figure 3. Dashboard for volume, sentiment and trending words
118
(Figure 4) that displays the most positive, negative
and frequent tweets, as well as some random
neutral tweets. It also shows the total volume over
time and a tag cloud of the most frequent words in
the last five minutes across all candidates. Another
crucial feature of this page is that clicking on one
of the tweets brings up an annotation interface, so
the user can provide his/her own assessment of the
sentiment expressed in the tweet. The next section
describes the annotation interface.
3.6 Annotation Interface
The online annotation interface shown in Figure 5
lets dashboard (Figure 4) users provide their own
judgment of a tweet. The tweet’s text is displayed
at the top, and users can rate the sentiment toward
the candidate mentioned in the tweet as positive,
negative or neutral or mark it as unsure. There are
also two options to specify whether a tweet is
sarcastic and/or funny. This interface is a
simplified version of the one we used to collect
annotations from Amazon Mechanical Turk so that
annotation can be performed quickly on a single
tweet. The online interface is designed to be used
while watching a campaign event and can be
displayed on a tablet or smart phone.
The feedback from users allows annotation of
recent data as well as the ability to correct
misclassifications. As a future step, we plan to
establish an online feedback loop between users
and the sentiment model, so users’ judgment serves
to train the model actively and iteratively.
4 System Evaluation
In Section 3.3, we described our preliminary
sentiment model that automatically classifies
tweets into four categories: positive, negative,
neutral or unsure. It copes well with the negative
bias in political tweets. In addition to evaluating
Figure 5. Dashboard for most positive, negative and frequent tweets
Figure 4. Online sentiment annotation interface
119
the model using annotated data, we have also
begun conducting correlational analysis of
aggregated sentiment with political events and
news, as well as indicators such as poll and
election results. We are exploring whether
variations in twitter sentiment and tweet volume
are predictive or reflective of real-world events and
news. While this quantitative analysis is part of
ongoing work, we present below some quantitative
and qualitative expert observations indicative of
promising research directions.
One finding is that tweet volume is largely
driven by campaign events. Of the 50 top hourly
intervals between Oct 12, 2011 and Feb 29, 2012,
ranked by tweet volume, all but two correspond
either to President Obama’s State of the Union
address, televised primary debates or moments
when caucus or primary election results were
released. Out of the 100 top hourly intervals, all
but 18 correspond to such events. The 2012 State
of the Union address on Jan 24 is another good
example. It caused the biggest volume we have
seen in a single day since last October, 1.37
million tweets in total for that day. Both positive
and negative tweets for President Obama increased
three to four times comparing to an average day.
During the Republican Primary debate on Jan 19,
2012 in Charleston, NC one of the Republican
candidates, Newt Gingrich, was asked about his
ex-wife at the beginning of the debate. Within
minutes, our dashboard showed his negative
sentiment increase rapidly – it became three times
more negative in just two minutes. This illustrates
how tweet volume and sentiment are extremely
responsive to emerging events in the real world
(Vergeer et al., 2011).
These examples confirm our assessment that it
is especially relevant to offer a system that can
provide real-time analysis during key moments in
the election cycle. As the election continues and
culminates with the presidential vote this
November, we hope that our system will provide
rich insights into the evolution of public sentiment
toward the contenders.
5 Conclusion
We presented a system for real-time Twitter
sentiment analysis of the ongoing 2012 U.S.
presidential election. We use the Twitter “firehose”
and expert-curated rules and keywords to get a full
and accurate picture of the online political
landscape. Our real-time data processing
infrastructure and statistical sentiment model
evaluates public sentiment changes in response to
emerging political events and news as they unfold.
The architecture and method are generic, and can
be easily adopted and extended to other domains
(for instance, we used the system for gauging
sentiments about films and actors surrounding
Oscar nomination and selection).
References
Bollen, J., Mao, H., & Zeng, X. (2011). Twitter mood
predicts the stock market. Journal of Computational
Science, 2(1), 1-8. doi: 10.1016/j.jocs.2010.12.007
Choy, M., Cheong, L. F. M., Ma, N. L., & Koo, P. S.
(2011). A sentiment analysis of Singapore Presidential
Election 2011 using Twitter data with census correction.
González-Ibáñez, R., Muresan, S., & Wacholder, N.
(2011). Identifying Sarcasm in Twitter: A Closer Look.
In Proceedings of the 49th Annual Meeting of the
Association for Computational Linguistics.
IBM. (2012). InfoSphere Streams, from http://www-
01.ibm.com/software/data/infosphere/streams/
Lassen, D. S., & Brown, A. R. (2010). Twitter: The
Electoral Connection? Social Science Computer Review.
O'Connor, B., Krieger, M., & Ahn, D. (2010). TweetMotif:
Exploratory Search and Topic Summarization for
Twitter. In Proceedings of the the Fourth International
AAAI Conference on Weblogs and Social Media,
Washington, DC.
Pang, B., & Lee, L. (2008). Opinion Mining and Sentiment
Analysis. Foundations and Trends in Information
Retrieval, 2(1-2), 1-135. doi: 10.1561/1500000011
Pew Research Center. (2011). 13% of online adults use
Twitter. Retrieved from
~/media//Files/Reports/2011/Twitter%20Update%2020
11.pdf
Tumasjan, A., Sprenger, T. O., Sandner, P. G., & Welpe, I.
M. (2010). Predicting Elections with Twitter: What 140
Characters Reveal about Political Sentiment.
TweetCongress. (2012). Congress Members on Twitter
Retrieved Mar 18, 2012, from
Twitter. (2012). What is Twitter Retrieved Mar 18, 2012,
from />twitter/
Vergeer, M., Hermans, L., & Sams, S. (2011). Is the voter
only a tweet away? Micro blogging during the 2009
European Parliament election campaign in the
Netherlands. First Monday [Online], 16(8).
Zeitzoff, T. (2011). Using Social Media to Measure
Conflict Dynamics. Journal of Conflict Resolution,
55(6), 938-969. doi: 10.1177/0022002711408014
120