Mobile bed numerical modeling of the red river
Bạn đang xem bản rút gọn của tài liệu. Xem và tải ngay bản đầy đủ của tài liệu tại đây (264.78 KB, 3 trang )
Tuyển tập Hội nghị Khoa học thường niên năm 2018. ISBN: 978-604-82-2548-3
MOBILE BED NUMERICAL MODELING OF THE RED RIVER
Dinh Nhat Quang, Vu Van Kien
Thuyloi University, email:
1. INTRODUCTION
The big reservoirs in the upstream
catchments constructed for hydroelectricity
production, also act as flood control
structures, and significantly alter sediment
supply downstream and consequently river
equilibrium [1, 2]. Additionally, instream
sand mining is also deeply affecting river
morphology enhancing the bed incision
process. The noticeable acceleration in river
bed degradation is a danger for agriculture
water supply as well as for infrastructure
stability.
In
this
research,
a
numerical
hydrodynamic and sediment transport model
is developed for the analysis of reach-scale
morphological evolution of the large sandy
Red – Thai Binh river. This model can
nowadays provide valuable information
about the river evolution to river system
managers.
supply to the large and populated agricultural
districts of the low-lying delta area, as well as
infrastructure stability.
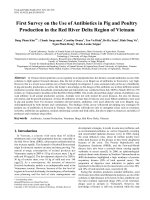
Figure 1. Model scheme.
Collected data include: i) 75 surveyed
cross section along the reach of interest in
2000 and 2009; ii) daily discharge and water
level from 1960-2015 at Son Tay, Ha Noi,
Thuong Cat and Hung Yen gauging stations;
and iii) daily suspended solids concentration.
3. METHODOLOGY
The choice of a one-dimensional model
permits to represent the main geomorphic
The study is focused on the 82 km lower processes of interest in our case study (i.e.
course of Red River, downstream the river bed aggradation-degradation for river
confluence of the three main tributaries (Da, reaches 100 km long).
Thao, Lo) at Viet Tri and upstream the
1. Governing equations:
bifurcation located at Hung Yen (see Figure
1). This reach includes the important
The model is based on a set of three
bifurcation with Duong river, few km differential equations, stating mass and
upstream Hanoi. In this stretch from the early momentum conservation for the liquid phase
2000s the river is suffering from a bed and mass conservation of the solid
degradation process, whose natural and phase along the main stream direction [3].
anthropogenic drivers (instream sediment
In the equations t is the time, x is the
mining, dams, climatic and land use longitudinal stream coordinate, A is the
changes). Continuous decrease of the water cross-section wetted area, Q is the liquid
level during dry season endangers water discharge, g is the gravity acceleration,
2. CASE STUDY AND DATA
600
Tuyển tập Hội nghị Khoa học thường niên năm 2018. ISBN: 978-604-82-2548-3
I1 is the static moment of the wetted area A
Finally, the local bed elevation variation
with respect to the water surface, Sf is due to erosion or deposition is calculated
the friction slope, A b is the sediment volume directly by Δs = k.h.
per unit length of the stream subject
to erosion or deposition (“sediment area”), Qs
is the solid discharge, q and qs are
the liquid and solid lateral inflows (or
outflows) per unit length, respectively.
The sediment discharge can be computed
with different formulae and is calculated as
sediment transport capacity. The choice fell
on Engelund-Hansen total load formula
(Equation 4, [4]). In this equation, B is the
channel width, ρ and ρs are the densities of
water and sediments, respectively; s is the
relative density ρs /ρ; ds is the sediment
representative diameter; U is the water
average velocity; τ0 is the bed shear stress.
3 /2
Qs 0.05 s gBU
2
ds
0
g( s 1) g( s 1 )
(4)
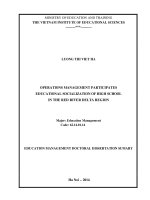
2. The bed evolution model
The solution of the balance eqn. (3)
updates the value of sediment area A b at
every time step. This value has to be
converted into a bed elevation variation, Δs,
for every wetted point of the cross section. It
is assumed herein that this variation
Δs is proportional to bed shear stress, which
in turn is related to the local water
depth h through a proportionality constant k
(Δs = k.h). The variation of sediment area
ΔAb , at every time step, is given by
integrating Δs along the wetted perimeter P:
(5)
sdp Ab
P
Integration of k.h along P gives the wetted
area A, and it follows that:
k
Ab
A
Figure 2. Example of cross section change
(start – end of a simulation)
3. RESULTS
The validation of the model is performed
taking as initial conditions the cross section
survey of 2000, and running 10-year long
simulation runs with the recorded discharge
series in Son Tay (2000-2009) as upstream
boundary condition. Two alternative erosion
trends of Duong river initial section are
considered, which drive the conveyance ratio
and the flow distribution. The trends are
inferred from recorded minimum water levels
in the cross section of Thuong Cat on Duong
River, just downstream the bifurcation. Bed
roughness in the reach is assumed as
invariant. The results of these runs (codes
VD1 and VD2) are compared with the
recorded time series of discharge of the
Duong river at the bifurcation, and of water
level in Ha Noi.
The agreement between simulated and
recorded data series in 2000-2009 is
analyzed. Concerning bifurcation, flow in
Duong distributary is slightly overestimated
during dry season (Figure 3). In VD1, the
Duong bed lowering follows a power-law
decrease, with faster lowering at the
beginning of the run, while in VD2 the
lowering follows a S-shape curve, with faster
lowering in the middle years. The total
601
Tuyển tập Hội nghị Khoa học thường niên năm 2018. ISBN: 978-604-82-2548-3
decrease is 2 m for both simulation runs.
Moreover, we tried to calibrate a distinct
friction slope ratio for dry and wet seasons,
following once again the observed data. On
the other hand, peak flow in the Duong is
slightly underestimated by the model. The
overestimation of flow in the distributary
leads to an underestimation of water level in
Hanoi (Figure 4) during the first three - four
years. Maximum levels provided by the
model are in excellent agreement with
recorded data.
5. CONCLUSIONS
A finite-volume mobile bed hydrodynamic
model was developed, which suitable for the
analysis of the morphological evolution of
the Red River. A first validation in the period
2000-2009 was carried on which shows the
good agreement between simulated and
recorded data series. This model will be
further validated using observed data and
sand mining rate and then is adopted to
forecast river bed incision in the future under
different simulated scenarios.
REFERENCES
Figure 3. Discharge in Duong distributary,
simulation runs VD1 and VD2
Figure 4. Water level in Hanoi, simulation
runs VD1 and VD2
[1] Kondolf G. M. 1997. Hungry water: effects
of dams and gravel mining on river
channels. Environmental management,
21(4), 533-551.
[2] Dang T. H., Coynel A., Orange D., Blanc G.,
Etcheber H., Anh Le L.. 2010. Long term
monitoring of the river sediment trans port
in the Red River watershed (Vietnam):
temporal
variability
and
dam-reservoir impact. Science of the Total
Environment, 408, 4654-4664.
[3] Schippa, L. and Pavan, S.. 2009. Bed
evolution numerical model for rapidly
varying flow in natural streams. Computers
& Geosciences, 35, pp. 390–402.
[4] Engelund F., Hansen E. 1967. A monograph
on sediment transport in alluvial streams,
Teknisk Forlag, Copenhagen.
602