Báo cáo khoa học: Levels of mTOR and its downstream targets 4E-BP1, eEF2, and eEF2 kinase in relationships with tau in Alzheimer’s disease brain doc
Bạn đang xem bản rút gọn của tài liệu. Xem và tải ngay bản đầy đủ của tài liệu tại đây (311.38 KB, 10 trang )
Levels of mTOR and its downstream targets 4E-BP1, eEF2,
and eEF2 kinase in relationships with tau in Alzheimer’s
disease brain
Xu Li
1
, Irina Alafuzoff
2
, Hilkka Soininen
3
, Bengt Winblad
1
and Jin-Jing Pei
1
1 Division of Experimental Geriatrics, Department of Neurotec, Karolinska Institutet, Huddinge, Sweden
2 Department of Neuroscience and Neurology, Kuopio University Hospital, Kuopio University, Finland
3 Department of Neurology and Neuroscience and Neurology, Kuopio University Hospital, Kuopio University, Finland
Neurofibrillary tangles (NFTs) is one of the major
neuropathological hallmarks in Alzheimer’s disease
(AD). NFTs are large, nonmembrane-bound bundles
of abnormal fibres that occupy much of the peri-
nuclear cytoplasm of affected neurons. These fibres
consist of paired helical filaments (PHFs), composed
of a hyperphosphorylated form of the microtubule-
associated protein tau (PHF-tau) [1–3]. Tau plays a
key role in cellular stabilization, however, when tau is
hyperphosphorylated it is less capable of binding to
tubulin, resulting in destabilization of microtubules
and eventually cell death [4].
Although total tau is markedly increased in the
hyperphosphorylated form, a significant amount of
normal tau still exists in AD brain [5–7]. This sugges-
ted that tau is continuously produced in order to com-
pensate those that have compromised their functions
by abnormal hyperphosphorylation in AD. It is known
that tau mRNA level is not changed in sporadic AD
brains [8,9]. However, one can not rule out the possi-
bility that translation of tau mRNAs is aberrantly
regulated in AD brains.
The evolutionarily conserved checkpoint protein
kinase, mammalian target of rapamycin (mTOR) has
Keywords
4E-BP1; Alzheimer’s disease; mTOR;
translation control; tau
Correspondence
J J. Pei, Karolinska Institutet, Department
of Neurotec, Division of Experimental
Geriatrics, KFC Plan 4, Novum, S-141 86,
Huddinge, Sweden
Fax: +46 858583880
Tel: +46 858583751
E-mail:
(Received 21 April 2005, revised 17 June
2005, accepted 24 June 2005)
doi:10.1111/j.1742-4658.2005.04833.x
The pathogenesis of formation of neurofibrillary tangles (NFTs) in Alzhei-
mer’s disease (AD) brains is unknown. One of the possibilities might be
that translation of tau mRNA is aberrantly regulated in AD brains. In the
current study, levels of various translation control elements including total
and phosphorylated (p) forms of mammalian target of rapamycin (mTOR),
eukaryotic initiation factor 4E binding protein 1 (4E-BP1), eukaryotic elon-
gation factor 2 (eEF2), and eEF2 kinase were investigated in relationship
with tau in homogenates of the medial temporal cortex from 20 AD and
10 control brains. We found that levels of p-mTOR (Ser2481), and p-4E-
BP1 (Thr70 and Ser65) dramatically increase in AD, and are positively sig-
nificantly correlated with total tau and p-tau. Levels of p-eEF2K were
significantly increased, and total eEF2 significantly decreased in AD, when
compared to controls. The changes of p-mTOR (2481), p-4E-BP1, and
p-eEF2 were immunohistochemically confirmed to be in neurons of AD
brains. This suggested that there are obvious abnormalities of elements
related with translation control in AD brain and their aberrant changes
may up-regulate the translation of tau mRNA, contributing to hyperphos-
phorylated tau accumulation in NFT-bearing neurons.
Abbreviations
AD, Alzheimer’s disease; eEF2, eukaryotic elongation factor 2; eEF2K, eEF2 kinase; eIF4E, eukaryotic initiation factor 4E; ERK, extracellular
signal regulated protein kinase; MAPK, mitogen activated protein kinase; mTOR, mammalian target of rapamycin; NFTs, neurofibrillary
tangles; PHFs, paired helical filaments; S6K, S6 kinase; 4E-BP, eIF4E-binding protein; 5¢TOP, 5¢-terminal oligopyrimidine tract; 5¢UTR,
5¢ untranslated region.
FEBS Journal 272 (2005) 4211–4220 ª 2005 FEBS 4211
emerged as a major effector of cell growth and prolif-
eration via the regulation of protein synthesis. mTOR
controls protein synthesis through a number of down-
stream targets. Several components of the ribosome
recruitment machinery as well as ribosomal compo-
nents are either direct or indirect targets of mTOR,
such as eukaryotic initiation factor 4E (eIF4E) and its
repressor eIF4E-binding protein (4E-BP), S6 kinase
(S6K) and its target ribosomal protein S6, and eukar-
yotic elongation factor 2 (eEF2).
Previously, we have found increased levels of phos-
phorylated (p) p70S6K [6] and p-eIF4E [10] in AD
brains. In the current study (Table 1), levels of total
and p-forms of mTOR, 4E-BP1, eEF2, and eEF2K
were investigated in relationship with tau in homogen-
ates of the medial temporal cortex from 20 AD and 10
control brains.
Results
Levels of total and phosphorylated mTOR
in AD and control brains
Levels of total mTOR did not show a significant
change between AD and control (Fig. 1A). Levels of
mTOR phosphorylated at the Ser2481 were signifi-
cantly increased (about threefold) in AD brains, as
compared with controls. No change was found for
p-mTOR (Ser2448) levels in AD brains. Consistently, a
significant correlation was only seen between p-mTOR
(Ser2481) levels and the progression of neurofibrillary
degeneration according to Braak and Braak criteria
(Fig. 1B). Antibodies to total mTOR and p-mTOR
(Ser2448, Ser2481) only showed one band correspond-
ing to its molecular mass at 289 kDa in AD homogen-
ates (60 lg per lane), suggesting these antibodies are
specific (Fig. 1).
Levels of p-mTOR (Ser2481) showed a significant
positive correlation with total tau (r ¼ 0.517 and P ¼
0.003 for Tau2, r ¼ 0.619 and P ¼ 0.000 for R134d),
PHF-tau (r ¼ 0.631 and P ¼ 0.000 for AT8; r ¼ 0.445
and P ¼ 0.014 for PHF-1) (Table 2). In contrast, a
negative but significant correlation was seen between
levels of p-mTOR (Ser2481) and nonphosphorylated
tau labeled by Tau1 (r ¼ –0.474, P ¼ 0.008) (Table 2).
Levels of p-mTOR (Ser2448) only showed a significant
correlation with PHF-tau (r ¼ 0.056 and P ¼ 0.001
for AT8; r ¼ 0.523 and P ¼ 0.003 for PHF-1), and
total tau labeled by R134d (r ¼ 0.394, P ¼ 0.031).
Total mTOR only showed a significant correlation
with PHF-tau labeled by AT8 (r ¼ 0.417, P ¼ 0.022).
Levels of total and phosphorylated 4E-BP1
in AD and control brains
As shown in panel A of Fig. 2, levels of total 4E-BP1
were about 50% decreased in AD brains, as compared
with controls. A significantly negative correlation was
observed between levels of total 4E-BP1 and the pro-
gression of neurofibrillary degeneration according to
Braak and Braak criteria (Fig. 2B). In contrast, levels
of 4E-BP1 phosphorylated at the Thr70 ( 20%) or
Ser65 ( 70%) site but not at Thr37 ⁄ 46 sites were sig-
nificantly increased. However, a significantly positive
correlation was observed only between levels of 4E-
BP1 phosphorylated at the Ser65 site but not at the
Thr70 site and the progression of neurofibrillary
degeneration according to Braak and Braak criteria
(Fig. 2B). Levels of p-4E-BP1 (Thr37 ⁄ 46) did not show
significant correlation with the progression of neuro-
fibrillary degeneration according to Braak and Braak
Table 1. Detailed information of cases used in this study.
F, female; M, male; NA, not available; PMD, postmortem delay;
AD, Alzheimer’s disease. Average age (years): control 82.40 ±
9.30; AD 81.50 ± 10.83 (P ¼ 0.824). Average postmortem delay
(h): control 6.50 ± 2.88; AD 5.95 ± 1.85 (P ¼ 0.592).
Case Gender Age
PMD
(Hours)
Clinical
Diagnosis
Braak’s
Neurofibrillary
Staging
1 M 67 NA Control I
2 M 76 3 Control III
3 F 96 10 Control IV
4 M 75 10 Control I
5 M 79 5 Control IV
6 F 84 7 Control IV
7 M 84 7 Control III
8 M 83 8 Control III
9 F 98 9 Control III
10 F 82 4 Control IV
11 M 86 7 AD III
12 M 71 7 AD III
13 F 54 3 AD VI
14 F 76 6 AD VI
15 M 88 7 AD V
16 F 73 7 AD V
17 F 82 6 AD V
18 F 100 6 AD V
19 F 90 10 AD IV
20 F 82 7 AD VI
21 F 74 6 AD VI
22 F 84 7 AD VI
23 F 92 6 AD VI
24 F 78 6 AD V
25 F 97 9 AD V
26 F 68 4 AD VI
27 F 91 4 AD V
38 F 84 4 AD V
39 F 74 4 AD VI
30 F 86 3 AD VI
Abnormal translation control in Alzheimer’s disease X. Li et al.
4212 FEBS Journal 272 (2005) 4211–4220 ª 2005 FEBS
criteria. Antibodies to total and p-4E-BP1 only showed
one band corresponding to its molecular mass at the
range of 15–20 kDa in AD homogenates (100 lg per
lane), suggesting these antibodies are specific (Fig. 2).
Levels of p-4E-BP1 but not total 4E-BP1 had
significant positive correlation with total tau as
follows: r ¼ 0.578 and P ¼ 0.001 for p-4E-BP1
(Ser65) ⁄ Tau2; r ¼ 0.396 and P ¼ 0.030 for p-4E-BP1
(Ser65) ⁄ R134d; r ¼ 0.426 and P ¼ 0.019 for p-4E-
BP1 (Thr70) ⁄ Tau2; r ¼ 0.528 and P ¼ 0.003 for
p-4E-BP1 (Thr70) ⁄ R134d (Table 2). Levels of p-4E-
BP1 at both Thr70 and Thr37 ⁄ 46 sites not the Ser65
site were significantly correlated to PHF-tau labelled
by AT8 or PHF-1. However, only p-4E-BP1 at the
Ser65 site showed a negative but significant correla-
tion with tau nonphosphorylated at Tau1 sites.
Total and phosphorylated levels of eEF2K and
eEF2 in AD and control brains
Levels of p-eEF2K were significantly increased
( 40%) in AD brains, as compared with controls
(Fig. 3A). A similar tendency of increase without signi-
ficance was observed for p-eEF2 (Thr56) and total
eEF2K. Levels of total eEF2 were significantly
decreased in AD as compared with control. In general,
the decrease of total eEF2 was significantly correlated
with the progression of neurofibrillary degeneration
Table 2. Relationships of 4E-BP1, mTOR, eEF2K, and eEF2 with tau in AD and control brains.
AT8 PHF-1 Tau2 R134d Tau1
rPrPrPrPrP
Total 4E-BP1 )0.216 0.251 )0.168 0.376 )0.389 0.034 )0.213 0.258 0.240 0.202
4E-BP1 (Thr70) 0.706 0.000 0.736 0.000 0.426 0.019 0.528 0.003 )0.265 0.158
4E-BP1 (Ser65) 0.336 0.070 0.149 0.433 0.578 0.001 0.396 0.030 )0.377 0.040
4E-BP1 (Thr37 ⁄ 46) 0.381 0.038 0.446 0.013 )0.094 0.621 0.289 0.121 )0.077 0.686
Total mTOR 0.417 0.022 0.291 0.119 0.196 0.298 0.343 0.063 )0.158 0.404
mTOR (Ser2448) 0.560 0.001 0.523 0.003 0.142 0.455 0.394 0.031 )0.287 0.124
mTOR (Ser2481) 0.631 0.000 0.445 0.014 0.517 0.003 0.619 0.000 )0.474 0.008
Total eEF2K 0.226 0.230 0.031 0.869 0.137 0.470 0.145 0.445 )0.576 0.001
eEF2K (Ser366) 0.360 0.051 0.250 0.183 0.337 0.069 0.367 0.046 )0.375 0.041
Total eEF2 )0.118 0.536 )0.163 0.389 )0.076 0.690 )0.153 0.421 )0.103 0.588
eEF2 (Thr56) 0.325 0.080 0.308 0.097 0.170 0.369 0.306 0.100 )0.058 0.760
AB
C
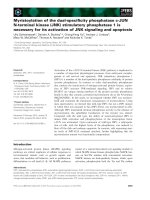
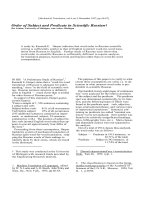
Fig. 1. Levels of total and phosphorylated (p) mTOR in AD and control brains. (A) When compared with controls, levels of p-mTOR
(Ser2481) significantly increased in AD brain by dot blot. Levels of total mTOR and p-mTOR (Ser2448) did not show any change between
AD and control. Filled bar, AD; unfilled bar, control. (B) Significantly increased trend of p-mTOR (Ser2481) with the progression of Braak neu-
rofibrillary stagings. (C) Antibodies to total mTOR and p-mTOR (Ser2448, Ser2481) only showed one band in AD homogenates (60 lgper
lane), respectively, corresponding to its molecular mass by western blots (6% SDS ⁄ PAGE). *P < 0.05; **P < 0.001.
X. Li et al. Abnormal translation control in Alzheimer’s disease
FEBS Journal 272 (2005) 4211–4220 ª 2005 FEBS 4213
according to Braak and Braak criteria, more dramatic
in brains with stages from IV to VI, as compared with
brains from stages I to III (Fig. 3B). Levels of eEF2
(Thr56) and levels of total and p-eEF2K (Ser366) (not
shown) did not show significant correlation with the
progression of neurofibrillary degeneration. Antibodies
to eEF2K and eEF2 showed only one band corres-
ponding to the molecular mass at 105 kDa and
100 kDa, respectively, in AD homogenates (eEF2K:
100 lg per lane; total eEF2: 60 lg per lane; p-eEF2:
12 lg per lane), suggesting these antibodies are specific
(Fig. 3).
Immunohistochemistry of AD and control brains
with antibodies to p-mTOR, p-4E-BP1, and p-eEF2
We used phosphospecific antibodies to p-mTOR, p-4E-
BP1, p-eEF2 and PHF-tau (PHF-1) to stain the sec-
tions of the medial temporal cortex from AD and
control brains. We observed that the stainings were
A
BC
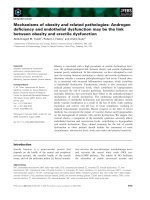
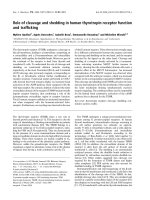
Fig. 2. Levels of total and phosphorylated (p) 4E-BP1 in AD and control brains. (A) When compared with controls, levels of total 4E-BP1 sig-
nificantly decreased in AD brain, while p-4E-BP1 (Thr70 and Ser65) significantly increased in AD brain by dot blot. Filled bar, AD; unfilled bar,
control. (B) A decreased trend of total 4E-BP1 with the progression of Braak neurofibrillary staging, and a significantly increased trend of
p-4E-BP1 (Ser65) are shown. (C) Antibodies to total and p-4E-BP1 only showed one band in AD homogenates (100 lg per lane), respectively,
corresponding to its molecular mass by western blots (15% SDS ⁄ PAGE). *P < 0.05; **P < 0.001.
AB
C
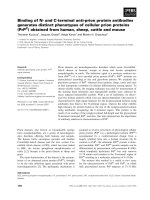
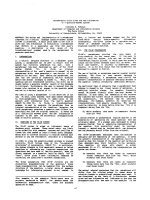
Fig. 3. Levels of total and phosphorylated (p) forms of eEF2K and eEF2 in AD and control brains. (A) When compared with controls, level of
p-eEF2K (Ser366) significantly increased, and levels of total eEF2 significantly decreased in AD brains. Filled bar, AD; unfilled bar, control. (B)
Only at the late stages V and VI, level of eEF2 showed an apparent decrease. (C) Antibodies to eEF2K and eEF2 showed only one band in
AD homogenates (eEF2K: 100 lg per lane; total eEF2: 60 lg per lane; p-eEF2: 12 lg per lane), respectively, corresponding to its molecular
mass by western blots (6% SDS ⁄ PAGE). *P < 0.05; **P < 0.001.
Abnormal translation control in Alzheimer’s disease X. Li et al.
4214 FEBS Journal 272 (2005) 4211–4220 ª 2005 FEBS
mainly found in neuronal cell bodies. For the antibody
to p-mTOR at Ser2448, there was no big difference
between AD and control cases (Fig. 4B,C). This
antibody strongly stained the pyramidal neurons of the
hippocampal CA1, CA2 and CA3 sectors, the subicu-
lum, and entorhinal regions. In the adjacent temporal
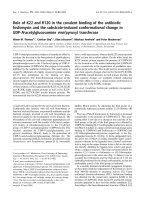
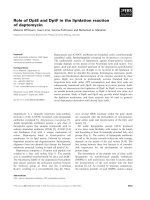
Fig. 4. Immunostainings of paraffin-embed-
ded sections from the medial temporal cor-
tex of AD and control brains using
antibodies to phosphorylated (p) mTOR,
p-4E-BP1, p-eEF2, and PHF-tau. p-mTOR
(Ser2481) in AD brain (A); p-mTOR
(Ser2448) in AD (B) and and control (C);
p-eEF2 (Ser56) in AD (D) and control (E);
p-4E-BP1 (Thr70) in AD brain (F) and phos-
phorylated tau ⁄ PHF-1 in AD brain (G). The
scale bar indicated 20 lm.
X. Li et al. Abnormal translation control in Alzheimer’s disease
FEBS Journal 272 (2005) 4211–4220 ª 2005 FEBS 4215
cortex, intensive staings were also found in the pyram-
idal cell bodies of layers III and V. CA4 sector and
granule layer of the dentate gyrus were moderately
stained by antibody to mTOR (Ser2448). The pattern
of immunostainings for p-mTOR at Ser2481 was sim-
ilar to that of Ser2448, but the immunoreactivities in
AD (Fig. 4A) were much stronger than controls (not
shown). The antibody against p-4E-BP1 intensively
stained the pyramidal neurons in the hippocampal
CA1, CA2 sectors, and the entorhinal regions, especi-
ally in some tangel-like neurons in AD brains. This
antibody moderately stained the pyramidal neurons of
the CA3 and CA4 sectors, and the granule layer of the
dentate gyrus (Fig. 4F), while in the control sections
processed in parallel, the corresponding stainings
were weak in all of these areas as compared with the
AD brain sections (data not shown). In AD brain,
immunostainings with the antibody against p-eEF2 at
Thr56 showed moderate to strong staining in the
pyramidal neurons of the hippocampal CA1, CA2,
CA3, CA4 sectors, and the entorhinal and temporal
cortice (Fig. 4D), but weak staining in the granule
layers of the dentate gyrus (not shown). In contrast, in
control brain slices there was weak stainings in the
pyramidal neurons of the CA1, CA2, CA3 and the
entorhinal cortex (Fig. 4E), but relatively more pro-
nounced immunostainings were seen in the granule
layer of the dentate gyrus (not shown).
Discussion
Depositions of PHF-tau form the pathological hall-
mark NFTs in AD brains. Although extensive studies
have been carried out to understand the pathogenesis
of the NFTs in AD in the past two decades, none has
ever analysed the possible changes of various control-
ling factors of protein translation such as mTOR,
4E-BP1, eEF2K, and eEF2 in relationship with tau in
AD brains.
mTOR acts as a sensor for ATP and amino acids,
balancing the availability of positive signals to p70S6K,
and participates in the inactivation of the eIF4E inhi-
bitor 4E-BP1. mTOR is autophosphorylated at the
Ser2481 site and phosphorylated at the Ser2448 site via
phosphoinositide-3 kinase (PI3K) signalling pathway
[13]. In the current study, we found: (a) an approx.
threefold increase of mTOR autophosphorylation
(Ser2481) in AD homogenates as compared with the
controls; (b) a clearly increased tendency of mTOR
autophosphorylation (Ser2481) following the progres-
sion of neurofibrillary degeneration according to Braak
and Braak criteria; (c) a significant correlation of
mTOR autophosphorylation (Ser2481) with PHF-tau
labelled by AT8 (r ¼ 0.631; P ¼ 0.000) and PHF-1
(r ¼ 0.445, P ¼ 0.014). These data suggested an exclu-
sive increase of mTOR autophosphorylation, which
correlates with PHF-tau associated pathologies. Levels
of mTOR phosphorylated at the Ser2448 site neither
showed significant change between AD and control
homogenates, nor did any significant correlation with
neurofibrillary degeneration according to Braak and
Braak criteria. However, a significant correlation was
seen between levels of p-mTOR (Ser2448) and PHF-tau
labelled by AT8 (r ¼ 0.560, P ¼ 0.001) and PHF-1
(r ¼ 0.523, P ¼ 0.003). Most recently, levels of
p-mTOR (Ser2448) was obviously increased in 6 of 9
cases of the medial temporal cortex staged at IV, V and
VI according to Braak and Braak criteria as compared
with 7 cases staged at 0, I and II [18]. Taken together,
aberrant regulation of mTOR phosphorylation in AD
brain might be not only predominantly mediated by its
autophosphorylation at the Ser2481 site, but also medi-
ated by its phosphorylation at the Ser2448 regulated by
PI3K pathway, the aberrant activation of which exists
in AD [6,7,14–18]. The implication of the disordered
mTOR phosphorylation, in particular its autophospho-
rylation, remains to be clarified.
Induction of 4E-BP1 hyperphosphorylation is medi-
ated primarily by rapamycin-sensitive mTOR-depend-
ent pathway, while some evidence also suggested an
extracellular signal regulated protein kinase (ERK)-
dependent modulation of its phosphorylation at the
Ser65 site [19,20]. Phosphorylation at Ser65 and Thr70
sites showed a relatively higher degree of rapamycin
sensitivity than Thr37 and Thr46 suggested that
mTOR plays a more important regulatory role in the
phosphorylation of Ser65 and Thr70 sites [21–24].
Interestingly, in AD brain, the significant increase of
4E-BP1 phosphorylated at Ser65 and Thr70 but not at
Thr37 ⁄ 46 sites coincided with the significant increase
of mTOR autophosphorylation. The data suggested
that regulation of 4E-BP1 phosphorylation at Ser65
and Thr70 sites might most likely be mediated by
mTOR autophosphorylation-dependent pathway. Fur-
ther studies need to be carried out to understand the
cause and effect of the decreased total 4E-BP1 in AD
as compared with control. The 4E-BP1 binds to eIF4E,
and sequesters eIF4E function. Phosphorylation of a
critical set of specific serine and threonine residues of
4E–BP1 abrogates this interaction, and releases eIF4E,
the phosphorylated state of which promotes cap-
dependent translation. An elevated eIF4E phosphory-
lation has been recently found in AD brain [10]. The
up-regulation of PI3K, mitogen activated protein
kinase (MAPK), and rapamycin-dependent pathways
[6,7,14–18,25] in PHF-tau associated pathologies
Abnormal translation control in Alzheimer’s disease X. Li et al.
4216 FEBS Journal 272 (2005) 4211–4220 ª 2005 FEBS
suggested a systematic disorder of protein translation
regulation occurs in AD brains.
One of the elongation controlling proteins is eEF2,
whose mRNA contains a 5¢-terminal oligopyrimidine
tract (5¢TOP). Both the synthesis and activity of eEF2
are regulated by rapamycin-sensitive pathway. Activa-
tion of Ca
2+
⁄ calmodulin-dependent eEF2K (CamKIII)
could phosphorylate eEF2 in its N-terminus (Thr56)
that subsequently blocks eEF2 binding to ribosomes,
resulting in decreased rates of protein synthesis.
Dephosphorylation of eEF2 relieves its translational
restriction and accelerates the translation rate of rapa-
mycin-sensitive proteins. In the current study, level of
eEF2K phosphorylated at the Ser366 site was dramatic-
ally increased in AD brain that coincided with the phos-
phorylation of p70S6K [6]. This suggested that p70S6K
could phosphorylate eEF2K at the Ser366 site, leading
to the inactivation of eEF2K in AD brain, which may
subsequently facilitate the dephosphorylation of eEF2,
and thus may promote translation ([26], Fig. 5).
Recently, we have found that tau synthesis is rapa-
mycin-sensitive in rat primary hippocampal neuronal
cultures and SH-SY5Y neuroblastoma cells [6,25].
Strikingly, alignments of the 5¢ untranslated region
(5¢UTR) structures of tau mRNA with the known
5¢-TOP mRNAs that generally encode ribosomal pro-
teins, revealed a similar 5¢TOP motif (not published).
Previously, we found a significant correlation between
levels of p-p70S6K (Thr421 ⁄ Ser424) and p-eIF4E, and
total tau in AD and control brains [6,10]. In the cur-
rent study, a significant correlation was seen between
phosphorylation of 4E-BP1 at both Ser65 and Thr70
sites, and mTOR at both Ser2481 and Ser2448 sites
with total tau level. As tau mRNA level did not
change in AD brain [8,9], the continuous production
of tau in neurons during the progression of neuronal
degeneration [6,25] might be regulated by mTOR-
dependent pathway via p70S6K, 4E-BP1, and eIF4E in
AD brain.
Changes of immunoreactivities of mTOR, p-mTOR,
4E-BP1, p-4E-BP1, eEF2 and p-eEF2 were studied by
dot blot. Significant correlations observed between lev-
els of p-mTOR, p-4E-BP1, and p-eEF2, and total and
phosphorylated taus suggested that these changes are
localized in neurons due to that tau is primarily a
neuronal proteins. Data from immunohistochemistry
using phosphospecific antibodies to p-mTOR and
p-4E-BP1 proved that the immunoreactivities of phos-
phorylated forms of mTOR and 4E-BP1 are increased
in neurons, while levels of p-eEF2 did not show any
significant correlation with tau by dot blot, a relatively
more intensive immunostainings of antibody to
p-eEF2 were observed in neurons of AD brains as
compared to controls.
Rapamycin has been recently shown to enhance
clearance of cytosolic aggregate-prone proteins with
either polyglutamine or polyalanine expansions in
Huntington disease, Huntington related diseases, and
various forms of a-synuclein associated with Parkinson
disease and synucleinopathies [27]. Taken together with
the findings that mTOR phosphorylated at the Ser2481
site has a significant positive correlation with total tau,
it provided clues for our hypothesis that mTOR abnor-
mality may play an important role in the pathogenesis
of NFTs in AD (Fig. 5).
In general, our data drew an outline of aberrant
changes of protein translation control system in AD
brains. The abnormality of translation control may be
relatively specifically involved in the increased level of
tau in AD brains, contributing to hyperphosphorylated
tau accumulation in NFT-bearing neurons. Further
studies need to be carried out to see whether or not
other funtional proteins are dis-regulated by mTOR
pathway in AD, and whether or not the positive corre-
lations between aberrant changes of protein translation
control system and tau are also seen in other neuro-
degenerative tauopathies.
Fig. 5. A hypothetical scheme showing aberrant regulation of tau
translation by mTOR via 4E-BP1 and p70S6K-dependent pathways
in AD brain. mTOR is phosphorylated at serine 2448 via the PI3 kin-
ase ⁄ Akt signalling pathway and autophosphorylated at serine 2481.
In AD brain, high levels of phosphorylated mTOR phosphorylate
p70S6K and transmit a positive signal to the p70S6K pathway, and
phosphorylate and disassociate the eIF4E inhibitor 4E-BP1 from
eIF4E, resulting activation of the eIF4E. On the other hand, p70S6K
can phosphorylate eEF2K, leading to the inactivation of eEF2K,
which facilitates the dephosporylation of eEF2, and thus promotes
protein translation. All above events may contribute to up-regulation
of the translation of specific mRNA subpopulations such as tau
protein.
X. Li et al. Abnormal translation control in Alzheimer’s disease
FEBS Journal 272 (2005) 4211–4220 ª 2005 FEBS 4217
Experimental procedures
Materials
Affinity-purified rabbit polyclonal antibodies against total
and p-forms of 4E-BP1, mTOR, eEF2, and eEF2K were
purchased from the Cell Signaling Technology (Beverly,
MA). Mouse mAb AT8 was from Innogenetics (anti-human
PHF-tau; Zwujndrecht, Belgium), and mAb Tau2 from
Sigma-Aldrich (St. Louis, MO, USA). mAb PHF-1 was a
gift from Dr Peter Davies (Albert Einstein College of Medi-
cine, Bronx, NY, USA), and mAb Tau1 from L. Binder
(North-Western University, Chicago, IL, USA). Rabbit
antiserum R134d to the longest isoform of recombinant
human tau were gifted from K. Iqbal (New York State
Institute for Basic Research in Developmental Disabilities,
Staten Island, NY, USA).
Homogenate preparation and protein
measurement
Tissue blocks of the medial temporal cortex of 20 AD and
10 control brains were from Kuopio Brain bank (Table 1).
All cases were pathologically staged according to Braak
and Braak criteria in Kuopio Brain Bank [11]. All demen-
ted subjects fulfilled the AD neuropathological criteria
according to CERAD [12]. Grey matter was separated from
white matter and homogenized in 50 mm Tris ⁄ HCl buffer,
pH 7.0, containing 2.5 mm EDTA, 2.5 mm EGTA, 2 mm
benzamidine, 0.5 mm PMSF, 1% 2-mercaptoethanol,
20 mm b-glycerophosphate, 2 mm sodium vanadate, 50 mm
NaF, 2.5% SDS and 0.1% (v ⁄ v) protease-inhibitor cocktail
(Sigma-Aldrich, Stockholm, Sweden) at 4 °C. Protein con-
centration was determined by the BCA assay kit (Sigma-
Aldrich).
Dot and western blots and indirect ELISA
Following the procedures described previously [10], homo-
genates from AD and control cases were spotted on the
squares in triplicates (3 lg protein per square), which were
then incubated with primary antibodies overnight at 4 °C,
followed by secondary antibodies linked with horseradish
peroxidase (Amersham Biosciences AB, Uppsala, Sweden)
at room temperature for 1 h. The primary antibodies used
in dot blots included antibodies against total and p-forms
of mTOR, 4E-BP1, eEF2 and eEF2K. Immunoreactive
proteins were detected according to the enhanced chemi-
luminescence protocol (Amersham Biosciences AB). Intensi-
ties of spots were quantified with The Discovery Series
Quantity One 1-D Analysis Software (Bio-Rad Laborator-
ies, Inc.). To check the specificities of antibodies, AD homo-
genates were separated in 6% SDS ⁄ polyacrylamide gel for
antibodies to total and p-forms of mTOR, eEF2K and
eEF2, and in 15% SDS ⁄ polyacrylamide gel for total and
p-4E-BP1. After transferring, the procedures were followed
the same as the dot blot. Levels of total tau labeled by
R134d and Tau2, PHF-tau labeled by AT8 and PHF-1,
and unphosphorylated tau labeled by Tau1 were previously
measured by indirect ELISA in the same set of tissues as
dot blots [6].
Immunohistochemistry
Immunohistochemical staining was performed on 20-lM
formalin-fixed frozen sections (two AD cases, and two
control cases) or 6 lm formalin-fixed paraffin-embedded
sections of the medial temporal cortex from pathologic-
ally verified AD (three cases) and control (two) cases
(Braak and Braak neurofibrillary stages 5–6) (Kupio
Brain Bank). The sections were incubated at 4 °C for
48 h with rabbit antibodies to p-mTOR (Ser2448),
p-mTOR (Ser2481) at 1 : 12.5 dilution, p-4E-BP-1
(Thr70) at 1 : 50, p-eEF2 (Thr56) at 1 : 25, and mAb
PHF-1 at 1 : 100 dilution after antigen retrieval at 80 °C
9 min in citrate-buffered saline. This was followed by
incubation with biotinylated anti-mouse IgM or anti-rab-
bit IgG at 1 : 300 dilution for 2 h, and by visualization
with the avidin-biotin-peroxidase complex kit (Vector,
Burlingame, CA, USA) with 3–3¢-diaminobenzidine-4
HCl ⁄ H
2
O
2
(DAB; Sigma) as a substrate. The images
were taken by LEICA DC480 microscope using the LE-
ICA IM50 image manager software (Leica Microsystems
AG, Heerbrugg, Germany).
Statistical analysis
The average age and postmortem delay between AD and
control cases were compared by nonpaired Student t-test.
Levels of total and p-forms of mTOR, 4E-BP1, eEF2,
and eEF2K in homogenates between AD and control
brains were also compared by nonpaired Student t-test,
and in different stages of neurofibrillary degeneration
according to Braak and Braak criteria by one-way
anova. Relationships between levels of various translation
control elements, and levels of tau were analyzed using
Bivariate Pearson correlations. The significance level was
set at P < 0.05.
Acknowledgements
We thank Dr Lars Tjernberg for his helpful comments
on the manuscript. This study was supported by
Alzheimerfonden, Gamla Tja
¨
narinnor Foundation,
Gun och Bertil Stohnes Stiftelse, Loo and Hans Oster-
mans Foundation, SADF (Insamlingsstiftelsen fo
¨
r
Alzheimer- och Demensforskning), Socialstyrelsens
Stiftelser, Stiftelsen fo
¨
rA
˚
lderssjukdomar, and Svenska
La
¨
karesa
¨
llskapet.
Abnormal translation control in Alzheimer’s disease X. Li et al.
4218 FEBS Journal 272 (2005) 4211–4220 ª 2005 FEBS
References
1 Grundke-Iqbal I, Iqbal K, Tung YC, Quinlan M,
Wisniewski HM & Binder LI (1986) Abnormal
phosphorylation of the microtubule-associated protein
tau (tau) in Alzheimer cytoskeletal pathology. Proc Natl
Acad Sci USA 83, 4913–4917.
2 Kosik KS, Joachim CL & Selkoe DJ (1986) Microtu-
bule-associated protein tau (tau) is a major antigenic
component of paired helical filaments in Alzheimer dis-
ease. Proc Natl Acad Sci USA 83, 4044–4048.
3 Nukina N & Ihara Y (1986) One of the antigenic deter-
minants of paired helical filaments is related to tau
protein. J Biochem (Tokyo) 99, 1541–1544.
4 Lu Q & Wood JG (1993) Functional studies of
Alzheimer’s disease tau protein. J Neurosci 13, 508–515.
5 Khatoon S, Grundke-Iqbal I & Iqbal K (1992) Brain
levels of microtubule-associated protein tau are elevated
in Alzheimer’s disease: a radioimmuno-slot-blot assay
for nanograms of the protein. J Neurochem 59, 750–
753.
6 An WL, Cowburn RF, Li L, Braak H, Alafuzoff I,
Iqbal K, Iqbal IG, Winblad B & Pei JJ (2003)
Up-regulation of phosphorylated ⁄ activated p70 S6
kinase and its relationship to neurofibrillary pathology
in Alzheimer’s disease. Am J Pathol 163, 591–607.
7 Pei JJ, Khatoon S, An WL, Nordlinder M, Tanaka T,
Braak H, Tsujio I, Takeda M, Alafuzoff I, Winblad B,
et al. (2003) Role of protein kinase B in Alzheimer’s
neurofibrillary pathology. Acta Neuropathol (Berlin)
105, 381–392.
8 Mah VH, Eskin TA, Kazee AM, Lapham L & Higgins
GA (1992) In situ hybridization of calcium ⁄ calmodulin
dependent protein kinase II and tau mRNAs; species
differences and relative preservation in Alzheimer’s
disease. Mol Brain Res 12, 85–94.
9 Boutajangout A, Boom A, Leroy K & Brion JP (2004)
Expression of tau mRNA and soluble tau isoforms in
affected and non-affected brain areas in Alzheimer’s
disease. FEBS Lett 576, 183–189.
10 Li X, An WL, Alafuzoff I, Soininen H, Winblad B &
Pei JJ (2004) Phosphorylated eukaryotic translation fac-
tor 4E is elevated in Alzheimer brain. NeuroReport 15,
2237–2240.
11 Braak H & Braak E (1991) Neuropathological staging
of Alzheimer-related changes. Acta Neuropathol (Berlin)
82, 239–259.
12 Mirra SS, Heyman A, McKeel D, Sumi SM, Crain BJ,
Brownlee LM, Vogel FS, Hughes JP, van Belle G &
Berg L (1991) The consortium to establish a registry for
Alzheimer’s disease (CERAD), part II. Standardisation
of the neuropathological assessment of Alzheimer’s
disease. Neurology 41, 476–486.
13 Peterson RT, Beal PA, Comb MJ & Schreiber SL
(2000) FKBP12-rapamycin-associated protein (FRAP)
autophosphorylates at serine 2481 under translationally
repressive conditions. J Biol Chem 275, 7416–7423.
14 Pei JJ, Tanaka T, Tung YC, Braak E, Iqbal K &
Grundke-Iqbal I (1997) Distribution, levels and activity
of glycogen synthase kinase-3 in the Alzheimer disease
brain. J Neuropathol ExP Neurol 56, 70–78.
15 Pei JJ, Braak E, Braak H, Grundke-Iqbal I, Iqbal K,
Winblad B & Cowburn RF (1999) Distribution of active
glycogen synthase kinase 3b (GSK-3b) in brains staged
for Alzheimer disease neurofibrillary changes. J Neuro-
pathol ExP Neurol 58, 1010–1019.
16 Pei JJ, Braak E, Braak H, Grundke-Iqbal I, Iqbal K,
Winblad B & Cowburn RF (2001) Localization of active
forms of C-jun (JNK) and p38 kinase in Alzheimer’s
disease brains at different stages of neufibrillary degen-
eration. J Alzheimer Dis 3, 41–48.
17 Pei JJ, Braak H, An WL, Winblad B, Cowburn RF, Iqbal
K & Grundke-Iqbal I (2002) Up-regulation of mitogen-
actived protein kinase ERK1 ⁄ 2 and MEK 1 ⁄ 2 is associ-
ated with the progression of neurofibrillary degeneration
in Alzheimer’s disease. Mol Brain Res 109, 45–55.
18 Griffin RJ, Moloney A, Kelliher M, Johnston JA,
Ravid R, Dockery P, O’connor R & O’neill C (2005)
Activation of Akt ⁄ PKB, increased phosphorylation of
Akt substrates and loss and altered distribution of Akt
and PTEN are features of Alzheimer’s disease
pathology. J Neurochem 93, 105–117.
19 Gingras AC, Raught B & Sonenberg N (2001) Regula-
tion of translation initiation by FRAP ⁄ mTOR. Genes
Dev 15, 807–826.
20 Herbert TP, Tee AR & Proud CG (2002) The extracel-
lular signal-regulated kinase pathway regulates the phos-
phorylation of 4E–BP1 at multiple sites. J Biol Chem
277, 11591–11596.
21 Brunn GJ, Hudson CC, Sekulic A, Williams JM, Hosoi
H, Houghton PJ, Lawrence JC Jr & Abraham RT
(1997) Phosphorylation of the translational repressor
PHAS-I by the mammalian target of rapamycin. Science
277, 99–101.
22 Hara K, Yonezawa K, Kozlowski MT, Sugimoto T,
Andrabi K, Weng QP, Kasuga M, Nishimoto I &
Avruch J (1997) Regulation of eIF-4E BP1 phosphory-
lation by mTOR. J Biol Chem 272, 26457–26463.
23 von Manteuffel SR, Dennis PB, Pullen N, Gingras AC,
Sonenberg N & Thomas G (1997) The insulin-induced
signalling pathway leading to S6 and initiation factor
4E binding protein 1 phosphorylation bifurcates at a
rapamycin sensitive point immediately upstream of
p70s6k. Mol Cell Biol 17, 5426–5436.
24 Gingras AC, Kennedy SG, O’Leary MA, Sonenberg N
& Hay N (1998) 4E-BP1, a repressor of mRNA transla-
tion, is phosphorylated and inactivated by the Akt
(PKB) signaling pathway. Genes Dev 12, 502–513.
25 An WL, Bjorkdahl C, Liu R, Cowburn RF, Winblad B
& Pei JJ (2005) Mechanism of zinc-induced
X. Li et al. Abnormal translation control in Alzheimer’s disease
FEBS Journal 272 (2005) 4211–4220 ª 2005 FEBS 4219
phosphorylation of p70 S6 kinase and glycogen synthase
kinase 3beta in SH-SY5Y neuroblastoma cells. J Neuro-
chem 92, 1104–1115.
26 Wang X, Li W, Williams M, Terada N, Alessi DR &
Proud CG (2001) Regulation of elongation factor 2
kinase by p90RSK1 and p70 S6 kinase. EMBO J 20,
4370–4379.
27 Ravikumar B, Vacher C, Berger Z, Davies JE, Luo S,
Oroz LG, Scaravilli F, Easton DF, Duden RB, O’Kane
CJ & Rubinsztein DC (2004) Inhibition of mTOR
induces autophagy and reduces toxicity of polygluta-
mine expansions in fly and mouse models of Huntington
disease. Nat Genet 36, 585–595.
Abnormal translation control in Alzheimer’s disease X. Li et al.
4220 FEBS Journal 272 (2005) 4211–4220 ª 2005 FEBS