Combining AHP with GIS for Predictive Cu Porphyry Potential Mapping: A Case Study in Ahar Area (NW, Iran) doc
Bạn đang xem bản rút gọn của tài liệu. Xem và tải ngay bản đầy đủ của tài liệu tại đây (892.43 KB, 12 trang )
Natural Resources Research, Vol. 20, No. 4, December 2011 (Ó 2011)
DOI: 10.1007/s11053-011-9149-x
Combining AHP with GIS for Predictive Cu Porphyry
Potential Mapping: A Case Study in Ahar Area (NW, Iran)
Kaveh Pazand,1,4 Ardeshir Hezarkhani,2 Mohammad Ataei,3 and Yousef Ghanbari1
Received 13 June 2011; accepted 17 August 2011
Published online: 16 September 2011
Using the analytic hierarchy process (AHP) method for multi-index evaluation has special
advantages, while the use of geographic information systems (GIS) is suitable for spatial
analysis. Combining AHP with GIS provides an effective approach for studies of mineral
potential mapping evaluation. Selection of potential areas for exploration is a complex
process in which many diverse criteria are to be considered. In this article, AHP and GIS are
used for providing potential maps for Cu porphyry mineralization on the basis of criteria
derived from geologic, geochemical, and geophysical, and remote sensing data including
alteration and faults. Each criterion was evaluated with the aid of AHP and the result
mapped by GIS. This approach allows the use of a mixture of quantitative and qualitative
information for decision-making. The results of application in this article provide acceptable
outcomes for copper porphyry exploration.
KEY WORDS: Mineral potential mapping, AHP, Cu porphyry, Ahar.
subdivision has to be drawn depending on the type of
inference mechanism considered. The two model
types are (1) knowledge driven; and (2) data driven
(Feltrin 2008). The former means that evidential
weights are estimated subjectively based on oneÕs
expert opinion about spatial association of target
deposits with certain geologic features, whereas the
latter means that evidential weights are quantified
objectively with respect to locations of known target
deposits (Bonham-Carter 1994; Moon 1998; Carranza
and Hale 2001; Cheng and Agterberg 1999; Porwal
et al. 2004; Carranza et al. 2008). Knowledge-driven
approaches rely on the geologistÕs input to weight the
importance of each data layer (evidence map) as they
relate to the particular exploration model being used.
This approach is more subjective but has the advantage of incorporating the knowledge and expertise of
the geologist in the modeling process (Harris et al.
2001). Examples of knowledge-driven approaches
include Boolean logic, index overlays (Harris 1989),
analytic hierarchy process (AHP) (Hosseinali and
Alesheikh 2008), and fuzzy logic (An et al. 1992). The
integration of GIS and AHP is a powerful tool to solve
INTRODUCTION
Geographic information systems (GIS) technology has shown growing application in many areas of
knowledge, but especially in the mineral exploration.
Mineral exploration involves the collection, analysis,
and integration of data from different surveys. Mineral exploration generally starts on a small scale (large
areas) and, then, progresses to a larger scale (small
areas) to define targets for more detailed investigations
(Quadros et al. 2006). Before the construction of a
predictive model, which can be defined as representing the favorability or probability of occurrence of a
mineral deposit of the type/style sought, a schematic
1
Department of Mining Engineering, Science and Research
Branch, Islamic Azad University, Ponak Avenue, Tehran, Iran.
2
Department of Mining, Metallurgy and Petroleum Engineering,
Amirkabir University, Hafez Avenue No. 424, Tehran, Iran.
3
Department of Mining, Geophysics and Petroleum Engineering,
Shahrood University of Technology, 7th tir Sq., PO Box 36155316, Shahrood, Iran.
4
To whom correspondence should be addressed; e-mail:
251
1520-7439/11/1200-0251/0 Ó 2011 International Association for Mathematical Geology
Pazand et al.
252
the site selection and potential mapping problem
(Kontos et al. 2003; Hosseinali and Alesheikh 2008;
Sener et al. 2010). AHP is a systematic decision
approach first developed by Saaty (1980). AHP is a
decision analysis method that considers both qualitative and quantitative information and combines
them by decomposing ill-structured problems into
systematic hierarchies to rank alternatives based on a
number of criteria (Chen et al. 2008). As a result, the
AHP has the special advantage in multi-indexes
evaluation (Ying et al. 2007).
In this article, we report the results of mapping
Copper porphyry potential in the Ahar district by
combining GIS with AHP. The Ahar zone has been
studied for decades because of its mineral potential
for metallic ores, especially copper (Skarn and porphyry) and gold sulfides many occurrences of which
are known in the area (Mollai et al. 2004, 2009;
Hezarkhani 2006, 2008; Hezarkhani et al. 1997, 1999;
Hezarkhani and Williams-Jones 1996). The aim here
is to demonstrate the method for processing the data
and producing Cu porphyry prospectively map.
However, the Cu prospectively maps are compared
in a general sense by evaluating how the map has
predicted the known Cu prospects.
ANALYTIC HIERARCHY PROCESS (AHP)
The AHP is an approach for facilitating decision-making by organizing perceptions, feelings,
judgments, and memories into a multi-level hierarchic structure that exhibits the forces that influence a
decision (Saaty 1994). The AHP method breaks
down a complex multi-criteria decision problem into
a hierarchy and is based on a pairwise comparison of
the importance of different criteria and sub criteria
(Saaty 2005; Forman and Selly 2001). The AHP
process is developed into three principal steps. The
first step establishes a hierarchic structure. The first
hierarchy of a structure is the goal. The final hierarchy involves identifying alternatives, while the
middle hierarchy levels appraise certain factors or
conditions (Saaty 1996; Jung 2011). The second step
computes the element weights of various hierarchies
by means of three sub-steps. The first sub-step
establishes the pairwise comparison matrix. In particular, a pairwise comparison is conducted for each
element based on an element of the upper hierarchy
that is an evaluation standard. The second sub-step
computes the eigenvalue and eigenvector of the
pairwise comparison matrix. The third sub-step
performs the consistency test (De Feo and De Gisi
2010). Let C1, …, Cm be m performance factors and
W = (w1, …, wm) be their normalized relative
importance weight vector which is to be determined
by using pairwise comparisons and satisfies the
normalization condition (Dambatta et al. 2009):
m
X
Wj ¼ 1
with wj ! 0
for j ¼ 1; . . . ; m
1ị
jẳ1
The pairwise comparisons between the m decision
factors can be conducted by asking questions to
experts or decision makers like, which criterion is
more important with regard to the decision goal.
The answers to these questions form an m9m pairwise comparison matrix as follows (Joshi et al. 2011):
2
3
a11 Á Á a1m
6 .
. 7
..
. 5;
A ẳ aij ịmm ẳ 4 .
ð2Þ
.
.
.
am1 Á Á Á amm
where aij represents a quantified judgment on wi/wj
with aii = 1 and aij = 1/aji for i, j = 1, …, m.
If the pairwise comparison matrix A = (aij)m9m
satisfies aij = aikakj for any i, j, k = 1, …, m, then A is
said to be perfectly consistent; otherwise, it is said to
be inconsistent. Form the pairwise comparison matrix A, the weight vector W can be determined by
solving the following characteristic equation:
AW ẳ kmax W;
3ị
where kmax is the maximum eigenvalue of A
(Bernasconi et al. 2011). Such a method for determining the weight vector of a pairwise comparison
matrix is referred to as the principal right eigenvector method (Saaty 1980). The pairwise comparison matrix A should have an acceptable consistency,
which can be checked by the following consistency
ratio (CR):
CR ¼
ðkmax À nÞ=ðn À 1Þ
RI
ð4Þ
where RI is the average of the resulting consistency
index depending on the order of the matrix (Ying
et al. 2007). If CR £ 0.1, the pairwise comparison
matrix is considered to have an acceptable consistency; otherwise, it is required to be revised (Saaty
1980; Hsu et al. 2008). Finally, the third step of the
AHP method computes the entire hierarchic weight.
In practice, AHP generates an overall ranking of the
solutions using the comparison matrix among the
alternatives and the information on the ranking of
Combining AHP with GIS for Predictive Cu Porphyry Potential Mapping
the criteria. The alternative with the highest eigenvector value is considered to be the first choice
(Saaty 1996; Karamouz et al. 2007; Hsu et al. 2008;
De Feo and De Gisi 2010).
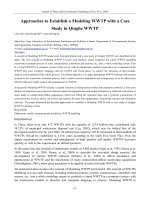
STUDY AREA
The Ahar area (one of 1:100,000 sheets in Iran) is
located in East Azarbayejan province, NW Iran in the
northern part of the Urumieh–Dokhtar magmatic arc
(Fig. 1) and covers an area of about 2500 km2.
Continental collision between the Afro-Arabian
continent and the Iranian microcontinent during
closure of the Tethys ocean in the Late Cretaceous
resulted in the development of a volcanic arc in NW
Iran (Mohajjel and Fergusson 2000; Babaie et al.
2001; Karimzadeh Somarin 2005). In Iran, the entire
known porphyry copper mineralization occurs in the
Cenozoic Urumieh–Dokhtar orogenic belt (Fig. 1).
This belt was formed by subduction of the Arabian
plate beneath central Iran during the Alpine orogeny
(Berberian and King 1981; Pourhosseini 1981) and
hosts two major porphyry Cu deposits. The Sarcheshmeh deposit is the only one of these being
mined, and contains 450 million tones of sulfide ore
with an average grade of 1.13% Cu and 0.03% Mo
(Waterman and Hamilton 1975). The Sungun
deposit, which contains 500 million tones of sulfide
reserves grading 0.76% Cu and 0.01% Mo
(Hezarkhani and Williams-Jones 1998), is currently
being developed. A number of economic and subeconomic porphyry copper deposits are all associated
with mid- to late-Miocene diorite/granodiorite to
quartz-monzonite stocks in Ahar area in this belt
(Hezarkhani 2008). The composition of volcanic
rocks in Ahar area varies from calc-alkaline to alkaline during Eocene to Quaternary. Regionally, the
oldest country rocks are Cretaceous sedimentary, and
sub-volcanic rocks include conglomerate, marl, shale,
andesite, tuff, and pyroclastic rock, followed by
Eocene latite and ignimbrite. The Oligocene–Miocene
intrusive rocks include granodiorite, diorite, gabbro,
and alkali syenite (Mahdavi and Amini Fazl 1988).
The youngest rocks of the region are Quaternary
volcanic (Fig. 1).
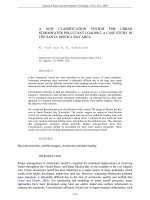
METHODOLOGY
The flowchart of the methodology is shown in
Fig. 2. The research procedures are as follows:
253
– Determining Cu porphyry exploration
criteria.
– Preparing map layers in a GIS environment as raster layer.
– Using pairwise comparison to obtain relative weights.
– Using the AHP to specify the most preferred alternative.
In this article, a primary screening was not
performed, and the whole region was evaluated for
Cu porphyry potential.
CRITERIA DESCRIPTION AND
APPLICATION
The data used in this study were selected based
on the relevance with respect to Cu porphyry
exploration criteria. The five main criteria as input
map layers including airborne magnetic, stream
sediment geochemical data, geology, structural data,
and alteration zone were used. At the regional and
local scales, airborne magnetic surveys, which are
rapid and economic, have been a part of porphyry
depositsÕ explorations. Both intrusions and related
alteration systems may have characteristic magnetic
signature, which in the ideal case, form distinctive
anomalies in regional surveys. These patterns may
reflect the increased concentration of secondary
magnetite in potassic alteration zones, or magnetite
destruction in other peripheral styles of alteration or
high magnetite in the original intrusive plutons
responsible for mineralization (Daneshfar 1997).
Airborne magnetic data were used for identifying
magnetic lineation, faults, and intrusive body. Geologic data inputs to the GIS are derived and compiled from geologic map of 1:100,000 scale, and
lithologic units were hand-digitized into vector
(segment) format. Each polygon was labeled
according to the name of each litho-stratigraphic
formation, and the host rock evidence map including
intrusive and volcanic rock as the two sub-criteria
was prepared. There are 620 stream sediment geochemical samples of the À80-mesh (0.18 mm) fraction, which were analyzed by the AAS (atomic
absorption spectrophotometry) method. After normalization, data were assigned to four classes: values
that are equal to or less than the mean are considered low background; values between the mean and
mean plus one standard deviation (" + SD) are
x
threshold; values between (" + SD) and (" + 2SD)
x
x
Pazand et al.
254
Figure 1. Major structural zones of Iran (after Nabavi 1976) and the locations of these zones in the Ahar area with its
modified and simplified geologic map (after Mahdavi and Amini Fazl 1988).
are slightly anomalous; and values greater than
(" + 2SD) are highly anomalous (Woodsworth 1972;
x
Rubio et al. 2000; Hongjin et al. 2007). These processes for Cu, Mo, Pb, Zn, As, Au, Sb, and Ba as
eight pathfinders of Cu porphyry mineralization
were performed, and their geochemical evidence
maps as geochemical sub-criteria were prepared.
Linear structural features interpreted from aeromagnetic data and remotely sensed data were combined with faults available in geologic maps to
Combining AHP with GIS for Predictive Cu Porphyry Potential Mapping
255
Figure 2. Flowchart of model for Cu potential mapping.
generate a structural evidence map. The map provided in this layer was classified and coded into 10
main classes according to their respective density
per unit area. Remote sensing data (Aster data)
were used for the extractions of argillic, phyllic, and
iron oxide alteration layer (Azizi et al. 2010) as three
alteration sub-criteria, and the alteration evidence
map was prepared.
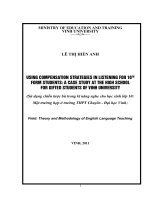
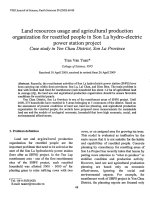
These evidence maps were buffered with values
according to Table 1 and converted to raster with cell
size 1009100 m using ArcGis software (Figs. 3, 4).
THE AHP SOLUTION
The evaluation system was divided into the
following steps. At first, the criteria for Cu porphyry
potential were determined and placed in a hierarchic
structure (Fig. 5); then, relative importance weights
for criteria were computed with a pairwise comparison method (Saaty 1980) and was used in a GIS
environment to obtain potential map. Each layer in
this hierarchic structure was compared in pairwise
comparisons related to each of the elements at the
level directly above. The level of the structure was
established by analyzing the relationship of each
index.
The pairwise comparison matrix (PCM) is used
for determining weights. PCM is formed by the
decision makers who allocated their opinions about
criteria, sub-criteria, and alternatives by using
Table 2, and it must comply with the following
attributes: aii = 1 and aij = 1/aji.
Relative importance of the criteria was analyzed by Delphi method, also called Expert Judgment System. In this research, we invited experts
with Cu porphyry backgrounds to give the corresponding relative importance of each factor, then
analyzed all the opinions, and finally, gained the
rank of relative importance for each factor as shown
in Table 2. Pairwise comparisons of all the related
attribute values were used for establishing the relative importance of hierarchic elements. Decision
makers evaluated the importance of pairs of
grouped elements in terms of their contribution to
the higher hierarchy. Finally, all the values for a
given attribute were pairwise compared. The weight
(W) of each factor in each hierarchy was calculated
by their structural models (Fig. 5). Criteria weight
(Wi) was calculated by normalizing the weight (W)
of each factor. Wi is the criteria weight, i.e., The CR
values of all the comparisons were lower than 0.10,
which indicated that the use of the weights was
suitable (Saaty 1996). Pairwise comparison matrix
Pazand et al.
256
Table 1. Map Layer Buffering and Values
Evident
Geology
Intrusive
Buffer 1000 m
Buffer 2000 m
Buffer 3000 m
Volcanic
Buffer 1000 m
Buffer 2000 m
Buffer 3000 m
Fault
Density
Density
Density
Density
Density
Density
Density
Density
Density
Density
Alteration
Phyllic
Buffer 500 m
Buffer 750 m
Buffer 1000 m
Argillic
Buffer 500 m
Buffer 750 m
Buffer 1000 m
Iron oxide
Buffer 500 m
Buffer 750 m
Buffer 1000 m
Geophysic
Magnetic intensity
Magnetic intensity
Magnetic intensity
Magnetic intensity
Class Values
10
8
6
4
10
8
6
4
10
9
8
7
6
5
4
3
2
1
10
8
6
4
10
8
6
4
10
8
6
4
1
2
3
4
Evident
Class Values
Geochemistry
Anomaly
Anomaly
Anomaly
Anomaly
Anomaly
Anomaly
Anomaly
Anomaly
10
6
3
1
10
6
3
1
10
6
3
1
10
6
3
1
10
6
3
1
10
6
3
1
10
6
3
1
10
6
3
1
10
7
4
2
for geochemical criteria is shown in Table 3, and the
importance of each factor as weight (W) of factor is
calculated.
It is apparent that the Cu anomaly is the most
important factor (weight = 0.4038), followed by Mo
being the next most important factor with
w = 0.2242. CR = 0.001 for the pairwise comparison
of the criteria, which is considered reasonable
(CR<0.1). The calculations for the sub-criteria of
alteration and geologic were performed and their
weights obtained (Tables 4, 5).
Based on the results of Tables 3–5, the main
criteria, including geochemistry, geology, alteration, magnetism, and faults to calculate the final
matrix, were used. In this comparison matrix, cri-
teria importance coefficients were calculated
(Table 6).
In Table 6, it is shown that the alteration is the
most important factor (weight = 0.384), followed by
geology being the next most important factor with
w = 0.2533. GeochemistryÕs weight is equal to
0.2468, and those for the two magnetic and faults
layers with equal weights, respectively, are 0.0346
and 0.0814. The consistency ratio is CR = 0.0658,
which for the pairwise comparison of the criteria is
reasonable (CR<0.1). To determine the final score,
Saaty (1980) uses the hierarchic composition principle (Eq. 5); this results in the production of the
vector regarding all the decisions at every level of
the hierarchic structure:
Combining AHP with GIS for Predictive Cu Porphyry Potential Mapping
257
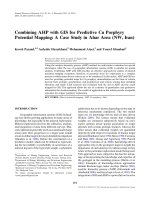
Figure 3. Geochemical index layers of Cu, Mo, Au, and Pb.
Result ¼
n
m
XX
Wj Wi ;
ð5Þ
j¼1 i¼1
where Wj is the importance weight of the jth criteria,
and Wi is the preferred weight of the ith alternatives.
Final potential map for Cu porphyry using the
obtained score and ArcGis software are provided
(Fig. 6).
Regarding the final map layer, the appropriate
areas were identified for Cu porphyry mineralization
(Fig. 6). Certainly, there are different methods for
analyzing model sensitivity. In this study, we use the
amount of covering the known Cu porphyry index
with the introduced areas. As seen in the maps of the
total number of the eight known porphyry copper
indexes in the region, six occurrences were located
Pazand et al.
258
Figure 4. Phyllic alteration, intrusive rock, fault density, and magnetic index layers.
in areas with high potential, and the other two
located in areas with a potential average; this means
that model predicts 75% of the known Cu porphyry
deposits, and ability and the accuracy of the method
are confirmed.
CONCLUSIONS
Exploration strategies for non-renewable
resources have been changing rapidly along with the
accelerating innovations in computer hardware and
Combining AHP with GIS for Predictive Cu Porphyry Potential Mapping
259
Figure 5. The hierarchic structure of the AHP framework.
Table 2. Various States for Pairwise Comparison and Their
Numerical Rates (Saaty 1980)
Table 3. Pairwise Comparison Among Geochemical Sub-Criteria
Zn
Intensity of
Importance
1
2
3
4
5
6
7
8
9
Definition
Equal importance or preference
Equal to moderate importance or preference
Moderate importance or preference
Moderate to strong importance or preference
Strong importance or preference
Strong to very strong importance or preference
Very strong importance or preference
Very to extremely strong importance or preference
Extreme importance or preference
Zn
Sb
Pb
Mo
Cu
Ba
Au
As
Sb
Pb
Mo
Cu
Ba
Au
As
W
1
1
1
5
7
1
3
2
1
1
1
5
7
1
3
2
1
1
1
5
7
1
3
2
0.2
0.2
0.2
1
3
0.2
0.3333
0.3333
0.1429
0.1429
0.1429
0.3333
1
0.1429
0.2
0.2
1
1
1
5
7
1
3
2
0.3333
0.3333
0.3333
3
5
0.3333
1
0.5
0.5
0.5
0.5
3
5
0.5
2
1
0.0438
0.0438
0.0438
0.2242
0.4038
0.0438
0.1176
0.0791
CR = 0.001.
Table 4. Pairwise Comparison Among Alteration Sub-Criteria
Phyllic
information processing technology. The results
demonstrated the following
(1) This methodology allowed us to have a
deeper understanding of the problem and
helped us follow a systematic approach to
evaluate the potential alternatives.
(2) It allowed for combining both the quantitative and qualitative information.
Phyllic
Iron oxide
Argillic
Iron Oxide
Argillic
W
1
0.5
1
2
1
2
1
0.5
1
0.4
0.2
0.4
CR = 0.023.
(3) The model developed enables decision
makers to compare different scenarios with
respect to appropriate criteria, and thus
Pazand et al.
260
(4)
(5)
(6)
(7)
(8)
(9) This combination of the methods can also
be used in any similar study regions of other
metals.
provides a real time, interactive, and
graphical display of the overall properties.
This methodology combining the AHP with
GIS provided an improved method for potential mapping, which enhanced the capability
of spatial analysis by the GIS and the capability of multi layersÕ analysis by the AHP.
The application of the AHP method for the
predictive mineral potential mapping provides a strong theoretical framework for
handling the complexity of modeling multiclass evidential maps in a flexible and
consistent way.
A qualitative and quantitative knowledge
of the spatial association between known
mineral occurrences and geologic features
in an area is important for mineral potential
mapping.
The design of the AHP procedure to obtain
the evidences for mapping mineral potential
must be based upon the knowledge of the
genesis or the mode of formation of known
mineralization in a particular area.
This method is useful for exploration of Cu
porphyry deposits because of its very significant pathfinder features, such as alteration and geochemical patterns, and
geologic environment.
Table 5. Pairwise Comparison Among Geology Sub-Criteria
Intrusive
Volcanic
1
0.3333
3
1
Intrusive
Volcanic
Figure 6. Potential mapping for Cu porphyry mineralization in
Ahar area.
CR = 0.002.
Table 6. Pairwise Comparison Among Main Criteria
Fault
Fault
Geochemical
Geology
Alteration
Magnetic
CR = 0.0658.
Geochemical
Geology
Alteration
Magnetic
W
1
5
5
5
0.2
0.2
1
1
2
0.1667
0.2
1
1
2
0.1429
0.2
0.5
0.5
1
0.1429
5
6
7
7
1
0.0814
0.2468
0.2533
0.384
0.0346
Combining AHP with GIS for Predictive Cu Porphyry Potential Mapping
REFERENCES
An, P., Moon, W. M., & Bonham-Carter, G. F. (1992) On a
knowledge-based approach of integrating remote sensing,
geophysical and geological information. In Proc. IGARSSÕ92
(pp. 34–38), Houston, TX.
Azizi, H., Tarverdi, M., & Akbarpour, A. (2010). Extraction of
hydrothermal alterations from ASTER SWIR data from east
Zanjan, northern Iran. Advances in Space Research, 46, 99–109.
Babaie, H. A., Ghazi, A. M., Babaei, A., La Tour, T. E., &
Hassanipak, A. A. (2001). Geochemistry of arc volcanic rocks
of the Zagros crush zone, Neyriz, Iran. Journal of Asian
Earth Science, 19, 61–76.
Berberian, M., & King, G. C. (1981). Towards a paleogeography
and tectonic evolution of Iran. Canadian Journal of Earth
Sciences, 18, 210–265.
Bernasconi, M., Choirat, C., & Seri, R. (2011). A re-examination
of the algebraic properties of the AHP as a ratio-scaling
technique. Journal of Mathematical Psychology, 55, 152–165.
Bonham-Carter, G. F. (1994). Geographic information systems for
geoscientists, modelling with GIS. Ontario: Pergamon.
Carranza, E., & Hale, M. (2001). Geologically constrained fuzzy
mapping of gold mineralization potential, Baguio District,
Philippines. Natural Resources Research, 10(2), 125–136.
Carranza, E., Ruitenbeek, F., Hecker, C., Meijde, M., & Meer, F.
(2008). Knowledge-guided data-driven evidential belief
modeling of mineral prospectivity in Cabo de Gata, SE Spain.
International Journal of Applied Earth Observation and
Geoinformation, 10, 374–387.
Chen, M. F., Tzeng, G. H., & Ding, C. G. (2008). Combining fuzzy
AHP with MDS in identifying the preference similarity of
alternatives. Applied Soft Computing, 8, 110–117.
Cheng, Q., & Agterberg, F. (1999). Fuzzy weights of evidence
method and its application in mineral potential mapping.
Natural Resources Research, 8(1), 27–35.
Dambatta, A. B., Farmani, R., Javadi, A. A., & Evans, B. M.
(2009). The Analytical Hierarchy Process for contaminated
land management. Advanced Engineering Informatics, 23,
433–441.
Daneshfar, B. (1997). An evaluation of indicators of prospectivity
and potential mapping of porphyry deposits in middle and
southern British Columbia by a GIS study of regional geochemical and other geoscientific data. Ph.D. thesis, University
of Ottawa, Canada.
De Feo, G., & De Gisi, S. (2010). Using an innovative criteria
weighting tool for stakeholders involvement to rank MSW
facility sites with the AHP. Waste Management, 30, 2370–2382.
Feltrin, L. (2008). Predictive modelling of prospectivity for Pb–Zn
deposits in the Lawn Hill Region, Queensland, Australia.
Ore Geology Reviews, 34, 399–427.
Forman, E. H., & Selly, M. A. (2001). Decision by objectives. How
to convince others that you are right. London: World Scientific
Publishing Co. Pte. Ltd.
Harris, J. R. (1989). Data integration for gold exploration in
eastern Nova Scotia using a GIS. In Proc. remote sensing for
exploration geology (pp. 233–249), Calgary, Alberta.
Harris, J., Wilkinson, L., Heather, K., Fumerton, S., Bernier, M.,
& Ayer, J. (2001). Application of GIS processing techniques
for producing mineral prospectivity maps—A case study:
Mesothermal Au in the Swayze Greenstone Belt, Ontario,
Canada. Natural Resources Research, 10(2), 91–124.
Hezarkhani, A. (2006). Petrology of the intrusive rocks within the
Sungun Porphyry Copper Deposit, Azerbaijan, Iran. Journal
of Asian Earth Sciences, 27, 326–340.
Hezarkhani, A. (2008). Hydrothermal evolution in Sonajil porphyry copper system (East Azarbaijan Province, Iran): The
history of an uneconomic deposit. Journal of IGR, Stanford,
USA, 50, 483–500.
261
Hezarkhani, A., & Williams-Jones, A. E. (1996). Physico-chemical
controls of alteration and mineralization at the Sungun
Porphyry Copper Deposit, Iran. In Geological Association
Canada—Mineralogical Association Canada (GAC-MAC)
Annual Meeting (Vol. 21, p. A-44), Winnipeg.
Hezarkhani, A., & Williams-Jones, A. E. (1998). Controls of
alteration and mineralization in the Sungun porphyry copper
deposit, Iran: Evidence from fluid inclusions and stable isotopes. Economic Geology, 93, 651–670.
Hezarkhani, A., Williams-Jones, A. E., & Gammons, C. (1997)
Copper solubility and deposition conditions in the potassic
and phyllic alteration zones, at the Sungun Porphyry Copper
Deposit, Iran. In Geological Association Canada—Mineralogical Association Canada (GAC-MAC) Annual Meeting
(Vol. 50, p. A-67), Ottawa.
Hezarkhani, A., Williams-Jones, A. E., & Gammons, C. H.
(1999). Factors controlling copper solubility and chalcopyrite
deposition in the Sungun Porphyry Copper Deposit, Iran.
Mineralium Deposita, 34, 770–783.
Hongjin, J., Daoming, Z., Yanxiang, S., Yangang, W., & Xisheng,
W. (2007). Semi-hierarchical correspondence cluster analysis
and regional geochemical pattern recognition. Journal of
Geochemical Exploration, 93, 109–119.
Hosseinali, F., & Alesheikh, A. A. (2008). Weighting spatial
information in GIS for copper mining exploration. American
Journal of Applied Sciences, 5(9), 1187–1198.
Hsu, P. F., Wu, C. R., & Li, Y. T. (2008). Selection of infectious
medical waste disposal firms by using, the analytic hierarchy
process and sensitivity analysis. Waste Management, 28,
1386–1394.
Joshi, R., Banwet, D. K., & Shankar, R. (2011). A Delphi-AHPTOPSIS based benchmarking framework for performance
improvement of a cold chain. Expert Systems with Applications, 38, 10170–10182.
Jung, H. (2011). A fuzzy AHP-GP approach for integrated production-planning considering manufacturing partners. Expert
Systems with Applications, 38, 5833–5840.
Karamouz, M., Zahraie, B., Kerachian, R., Jaafarzadeh, N., &
Mahjouri, N. (2007). Developing a master plan for hospital
solid waste management: A case study. Waste Management,
27, 626–638.
Karimzadeh Somarin, A. (2005). Petrology and geochemistry of
Early Tertiary volcanism of the Mendejin area, Iran, and
implications for magma genesis and tectonomagmatic setting.
Geodin Acta, 18, 343–362.
Kontos, T. D., Komilis, D. P., & Halvadakis, C. P. (2003). Siting
MSW landfills on Lesvos island with a GIS-based methodology. Waste Management & Research, 21, 262–278.
Mahdavi, M. A., & Amini Fazl, A. (1988). Geological map of Iran
1:100,000 series—Ahar. Geological Survey of Iran.
Mohajjel, M., & Fergusson, C. L. (2000). Dextral transpression in
Late Cretaceous continental collision, Sanandaj-Sirjan zone,
western Iran. Journal of Structural Geology, 22, 1125–1139.
Mollai, H., Dave, V. K. S., & Sharma, R. (2004). Copper mineralization at Mazraeh NorthWest of Iran: Evidences for fluid evolution and Skarn deposit. Abstract volume of 32nd international
geological congress, Florence, August 20–28, 2004, p. 223.
Mollai, H., Sharma, R., & Pe-Piper, G. (2009). Copper mineralization around the Ahar batholith, north of Ahar (NW Iran):
Evidence for fluid evolution and the origin of the skarn ore
deposit. Ore Geology Reviews, 35, 401–414.
Moon, W. (1998). Integration and fusion of geological exploration
data: A theoretical review of fuzzy logic approach. Geoscience Journal, 2(4), 175–183.
Nabavi, M. (1976). An Introduction to the geology of Iran. Geological Survey of Iran Publication (in Persian).
Porwal, A., Carranza, E., & Hale, M. (2004). A hybrid neurofuzzy model for mineral potential mapping. Mathematical
Geology, 36(7), 803–826.
262
Pourhosseini, F. (1981). Petrogenesis of Iranian plutons: A study
of the Natanz and Bazman intrusive complexes. Ph.D. thesis,
University of Cambridge; also Geological Survey of Iran,
Report No. 53.
Quadros, T., Koppe, J., Strieder, A., & Costa, J. (2006). Mineralpotential mapping: A comparison of weights-of-evidence
and fuzzy methods. Natural Resources Research, 15(1),
49–65.
Rubio, B., Nombela, M. A., & Vilas, F. (2000). Geochemistry of
major and trace elements in sediments of the Ria de Vigo
(NW Spain): An assessment of metal pollution. Marine Pollution Bulletin, 40, 968–980.
Saaty, T. (1980). The analytic hierarchy process (p. 287). New
York: McGraw-Hill.
Saaty, T. L. (1994). How to make a decision: The analytic hierarchy process. Interfaces, 24, 19–43.
Saaty, T. L. (1996). The analytic hierarchy process. New York:
McGraw-Hill.
Pazand et al.
Saaty, T. L. (2005). Theory and applications of the theory of the
analytic network processes. Decision making with benets,
opportunities, costs, and risks. Pittsburgh: RWS Publications.
ă
Sener, S., Sener, E., & Karaguzel, R. (2010). Solid waste disposal
site selection with GIS and AHP methodology: A case study
in Senirkent-Uluborlu (Isparta) Basin, Turkey. Environmental Monitoring and Assessment. doi:10.1007/s10661-0101403-x.
Waterman, G. C., & Hamilton, R. L. (1975). The Sar-Cheshmeh
porphyry copper porphyry system. Economic Geology, 70,
568–576.
Woodsworth, G. J. (1972). A geochemical drainage survey and its
implications for metallogenesis, Centeral Coast Mountains,
British Columbia. Economic Geology, 66, 1104–1120.
Ying, X., Guang-Ming, Z., Gui-Qiu, C., Lin, T., Ke-Lin, W., &
Dao-You, H. (2007). Combining AHP with GIS in synthetic
evaluation of eco-environment quality—A case study of
Hunan Province, China. Ecological Modelling, 209, 97–109.