Báo cáo khoa học: Response of the Pacific oyster Crassostrea gigas to hypoxia exposure under experimental conditions pot
Bạn đang xem bản rút gọn của tài liệu. Xem và tải ngay bản đầy đủ của tài liệu tại đây (541.34 KB, 18 trang )
Response of the Pacific oyster Crassostrea gigas to
hypoxia exposure under experimental conditions
Elise David
1
, Arnaud Tanguy
2
, Karine Pichavant
3
and Dario Moraga
1
1 Laboratoire des Sciences de l’Environnement Marin (LEMAR), Institut Universitaire Europe
´
en de la Mer, Universite
´
de Bretagne
Occidentale, France
2 Laboratoire Adaptation et Diversite
´
en Milieu Marin, Station Biologique de Roscoff, France
3 Unite
´
de Physiologie Compare
´
eetInte
´
grative, Universite
´
de Bretagne Occidentale, Brest, France
In the last few decades, marine hypoxia has become
one of the major ecological concerns in the world,
because of the increase of excessive anthropogenic
input of nutrients and organic matter into coastal sea-
water [1]. Benthic communities are the most sensitive
parts of the coastal ecosystem to eutrophication and
resulting hypoxia [2]. High production in stratified
waters results from nutrient enrichment and can cause
hypoxic or anoxic bottom waters because of the subse-
quent deposition of algal biomass [3]. Marine organ-
isms are directly affected by hypoxia at various levels
of organization and behavioural, biochemical and
physiological responses to limited availability of
oxygen have been well studied in fish and marine
invertebrates [4]. Most of the invertebrate species that
inhabit the intertidal zone, and especially sedentary
ones, have developed mechanisms for surviving twice-
daily oxygen deprivation at low tide. Depression of
metabolic rate can be considered as one of the most
important adaptations for hypoxia endurance [5,6].
Many marine molluscs do indeed show reversible pro-
tein phosphorylation to limit the activity of many
enzymes and functional proteins during anoxia [5,7].
The same response to hypoxia has already been
Keywords
Crassostrea gigas; hypoxia; suppression
subtractive hybridization libraries; gene
expression
Correspondence
D. Moraga, Laboratoire des Sciences de
l’Environnement Marin, UMR-CNRS 6539,
Institut Universitaire Europe
´
en de la Mer,
Universite
´
de Bretagne Occidentale, Place
Nicolas Copernic, F-29280 Plouzane
´
, France
Tel: +33 2 98 49 86 42
Fax: +33 2 98 49 86 45
E-mail:
(Received 23 May 2005, revised 4 August
2005, accepted 6 September 2005)
doi:10.1111/j.1742-4658.2005.04960.x
The molecular response to hypoxia stress in aquatic invertebrates remains
relatively unknown. In this study, we investigated the response of the Pacific
oyster Crassostrea gigas to hypoxia under experimental conditions and
focused on the analysis of the differential expression patterns of specific
genes associated with hypoxia response. A suppression subtractive hybridiza-
tion method was used to identify specific hypoxia up- and downregulated
genes, in gills, mantle and digestive gland, after 7–10 days and 24 days of
exposure. This method revealed 616 different sequences corresponding to 12
major physiological functions. The expression of eight potentially regulated
genes was analysed by RT-PCR in different tissues at different sampling
times over the time course of hypoxia. These genes are implicated in different
physiological pathways such as respiration (carbonic anhydrase), carbo-
hydrate metabolism (glycogen phosphorylase), lipid metabolism (delta-9
desaturase), oxidative metabolism and the immune system (glutathione per-
oxidase), protein regulation (BTF3, transcription factor), nucleic acid regula-
tion (myc homologue), metal sequestration (putative metallothionein) and
stress response (heat shock protein 70). Stress proteins (metallothioneins and
heat shock proteins) were also quantified. This study contributes to the char-
acterization of many potential genetic markers that could be used in future
environmental monitoring, and could lead to explore new mechanisms of
stress tolerance in marine mollusc species.
Abbreviations
GPx, glutathione peroxidase; HIF-1, hypoxia-inducible factor-1; HSP, heat shock protein; MT, metallothionein; SSH, suppression subtractive
hybridization.
FEBS Journal 272 (2005) 5635–5652 ª 2005 FEBS 5635
described at the cellular level in turtle hepatocytes
associated with a global decline in protein biosynthesis
[8]. Moreover, adaptations to anaerobiosis in marine
invertebrates resulting from hypoxia or anoxia include
the maintenance of large reserves of fermentable fuels
such as glycogen or aspartate, and the production of
alternative end products of fermentative metabolism,
to increase ATP yield [6]. Hypoxia also favours a
decrease in the generation of reactive oxygen species,
and thus a decrease in the activity of antioxidant
enzymes [9]. The modulation of enzyme activity by
hypoxia or anoxia has been extensively studied in mar-
ine invertebrates [10–12]. Nevertheless, although the
modulation of gene expression by oxygen is widely
recognized at a cellular level, molecular responses of
marine animals to hypoxia remain largely unknown
[13]. Many studies have been carried out on molecular
mechanisms of anoxia tolerance in mammals and
insects. Induction of hypoxia-sensitive genes by
hypoxia-inducible factor-1 (HIF-1) has been demon-
strated [14–17]. For example, in mice, four isozyme
genes of 6-phosphofructo-2-kinase ⁄ fructose-2,6-bis-
phosphatase family (PFKFB-1–4) were shown to be
responsive to in vivo hypoxia in different organs [18].
Hypoxia-induced gene expression profiling has also
been studied in fish using cDNA microarrays revealing
tissue-specific patterns of expression [19]. In inverte-
brates, specific RNA transcripts have been found that
are upregulated during anoxia exposure: a novel gene
named fau in Drosphila melanogaster [20], ribosomal
protein L26 [21] and novel genes named kvn [22] and
sarp-19 [23] in the marine snail Littorina littorea. The
dADAR gene, that plays a role in the sensitivity to
low levels of oxygen, has also been identified in Dro-
sophila melanogaster [24]. In marine benthic fauna, we
can underline moreover the recent studies of Brouwer
et al. [25] who used macroarrays and suppression sub-
tractive hybridization to assess gene expression modu-
lation in response to hypoxia in the blue crab
Callinectes sapidus. However, very few studies have
been conducted on patterns of gene expression in con-
ditions of hypoxia in marine molluscs and in particular
in bivalves.
The Pacific oyster Crassostrea gigas is a bivalve mol-
lusc well distributed along the West European coast.
As it can inhabit the intertidal zone, C. gigas is sub-
mitted to oxygen deprivation during emersion phases,
and therefore we can suppose that it has developed
strategies to endure the diminution of oxygen availabil-
ity. However, to our knowledge, there is a lack of
studies on hypoxia tolerance of this species at both the
molecular and the physiological level. Studies on oys-
ters belonging to the same genus, C. virginica, showed
regulation of metabolic enzyme activities with hypoxia,
suggesting metabolic adaptations of oysters to hypoxia
[11,12].
In this study, we report genes involved in the stress
response induced by hypoxia in C. gigas. First we
determined the inhibited and induced genes after
7–10 days and 24 days of hypoxia exposure, using a
suppression subtractive hybridization (SSH) method.
Then we used RT-PCR to analyse the expression of
some particular genes and an ELISA test to quantify
two stress-related proteins-heat shock proteins 70 fam-
ily (HSP70), and metallothioneins (MTs).
Results
Identification of hypoxia regulated genes
Suppression subtractive hybridization libraries were
made from pooled digestive glands, gills and mantle of
C. gigas after 7–10 and 24 days of exposure. The search
for homology using the blastx program revealed 616
different sequences, with 354 sequences (about 57%)
unidentified. Four tables list the sequences obtained
from the various SSH libraries: 7–10-days upregulated
(122 sequences, Table 1); 7–10 days downregulated
(111 sequences, Table 2); 24-days upregulated (186
sequences, Table 3); and 24-days downregulated (196
sequences, Table 4). These results indicate that hypoxia
exposure up- and downregulated genes associated to
12 major cellular physiological functions during the
experiment: reproduction, stress proteins, protein regu-
lation (including protein synthesis and degradation),
nucleic acid regulation (including transcription, cell
cycle regulation, and metabolism of nucleic acid com-
ponents), respiratory chain, structure (including cellular
matrix and cytoskeleton), lipid metabolism, cell com-
munication (including immune system and membrane
receptors), energetic metabolism (including digestive
enzymes), xenobiotic detoxification, metabolism of
amino acids and development. Several ribosomal pro-
teins encoding transcripts were also detected in both
forward and reverse libraries.
Expression of hypoxia regulated genes
The time-dependent expression of hypoxia regulated
genes encoding carbonic anhydrase, glutathione peroxi-
dase (GPx), myc homologue, glycogen phosphorylase,
delta-9 desaturase, BTF3, a putative metallothionein
and Heat Shock Protein 70, was analysed by RT-PCR
using gills, mantle and digestive glands of oysters after
0, 3, 7, 10, 14, 17, 21 and 24 days of hypoxia exposure.
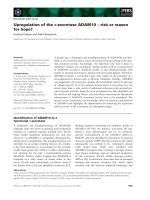
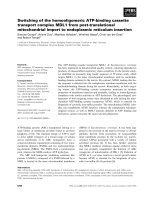
Results are summarized in Table 5 and Fig. 1. The
Oyster response to hypoxia exposure E. David et al.
5636 FEBS Journal 272 (2005) 5635–5652 ª 2005 FEBS
Table 1. Upregulated genes identified after 7–10 days of hypoxia exposure. G, Gills; M, mantle; Dg, digestive gland.
Homologue (protein)
BLASTX value
GenBank accession
number Organ
Cytoskeleton,structure, matrix
Proximal thread matrix protein 1 7e-08 CX069115 G ⁄ M
Thymosin beta 4 chromosome X 3e-12 CX069117 G ⁄ M
Matriline 1 3e-14 CX069120 G ⁄ M
Actin 2e-82 CX069121 G ⁄ M
Alpha-tubulin 2 2e-49 CX069159 Dg
Respiratory chain
Cytochrome c oxidase subunit III 4e-78 AF177226 Dg
Cytochrome b 1e-20 AF177226 G ⁄ M
NADH dehydrogenase subunit 6 3e-12 AF177226 G ⁄ M
NADH dehydrogenase subunit 4 0 AF177226 Dg
NADH dehydrogenase subunit 3 3e-39 AF177226 G ⁄ M
NADH dehydrogenase subunit 5 0 AF177226 Dg
Nucleic acid regulation
Chain A human reconstituted DNA topoisomerase I 9e-14 CX069118 G ⁄ M
Myc homologue 2e-5 CX069136 CX069141 G ⁄ MDg
High mobility group protein 1; HMG1 7e-23 CX069137 G ⁄ M
Xenobiotique detoxification
Glutathione S-transferase 2e-26 CB617447 G ⁄ M
Amino acids metabolism
Glutamine synthetase 7
e
-10 CG1753 Dg
Energetic metabolism
Ran protein 5e-18 CX069126 G ⁄ M
Cellulase 2e-21 CX069160 Dg
Carbonic anhydrase 6e-05 CX069170 G ⁄ M
Protein regulation
F box protein FBL5 1e-06 CX069124 G ⁄ M
Elongation factor 1 delta 4e-44 CX069125 G ⁄ M
Eukaryotic translation elongation factor 2 1e-25 CX069127 G ⁄ M
BTF3a 2e-24 CX069131 G ⁄ M
Cystatin B 7e-18 CX069133 G ⁄ M
Elongation factor 1-alpha 4e-22 CX069156 Dg
RNA polymerase III 53 kDa subunit RPC4 5e-13 CX069158 Dg
Cellular communication, membrane receptor and Immune system
Calmodulin 1e-51 CX069134 G ⁄ M
Low-affinity IgE receptor CD23 4e-15 CX069142 Dg
Glutathion peroxidase 4e-50 CX069146 Dg
Guanine nucleotide-binding protein beta subunit- like
protein (receptor for activated protein kinase C) 2e-26 CX069147 Dg
Ribosomal proteins
Ribosomal protein large subunit 4e-25 CX069116 G ⁄ M
Ribosomal protein L6 1e-52 CX069132 G ⁄ M
Ribosomal protein L7 2e-71 CX069138 Dg
Ribosomal protein L10a 5e-38 NC_003076 G ⁄ M
Ribosomal protein L12 2e-62 CX069140 Dg
Ribosomal protein L15 4e-51 CX069143 Dg
Ribosomal protein L18 1e-67 AJ563457 G ⁄ M
Ribosomal protein L19 0 AJ563476 Dg
Ribosomal protein L22 9e-20 CX069149 Dg
Ribosomal protein L31 5e-58 AJ563466 G ⁄ M
Ribosomal protein L27A 9e-10 CF369246 G ⁄ MDg
Ribosomal protein S3a 3e-98 CF369245 G ⁄ M
Ribosomal protein S4 2e-50 CX069145 G ⁄ M
Ribosomal protein S5 2e-74 CB617370 G ⁄ M
40S ribosomal protein S18 4e-27 CX069129 G ⁄ M
E. David et al. Oyster response to hypoxia exposure
FEBS Journal 272 (2005) 5635–5652 ª 2005 FEBS 5637
carbonic anhydrase revealed a peak of mRNA expres-
sion compared to the control between 7 and 10 days,
significant in gills (z ¼ )2.61; P ¼ 0.009; Fig. 1A),
mantle (z ¼ )1.98; P ¼ 0.047) and digestive gland
(z ¼ )2.45; P ¼ 0.014); then expression decreased
between 14 and 17 days below the control in gills
(z ¼ )2.40; P ¼ 0.016) and digestive gland (z ¼ )2.40;
P ¼ 0.016); it finally reached a maximum value in the
mantle and the digestive gland at 24 days (z ¼ )2.33;
P ¼ 0.020 and z ¼ )2.45; P ¼ 0.014, respectively).
The expression of GPx revealed a more progressive
increase to a maximum value reached at 24 days in the
three tissues (z ¼ )2.40; p ¼ 0.016 in gills; z ¼ )2.61;
P ¼ 0.009 in mantle, Fig. 1B, z ¼ )2.20; P ¼ 0.027 in
digestive gland compared to time zero) with, however,
a peak at 14 days in mantle (z ¼ )2.61; P ¼ 0.009;
Fig. 1B) and digestive gland samples (z ¼ )2.14; P ¼
0.133) compared to control. The expression of the
Myc homologue did not show strong variations with
hypoxia exposure. After a slight increase in digestive
gland at 10 days compared to the control (z ¼ )1.98;
P ¼ 0.047), we can detect a decrease in gills after
17 days (z ¼ )2.61; P ¼ 0.009; Fig. 1C) and in diges-
tive gland after 14 days of exposure, compared to the
control (z ¼ 2.61; P ¼ 0.009). BTF3 showed a peak of
expression between 10 and 14 days of exposure in the
gills in comparison to time zero (z ¼ )2.33; P ¼
0.020), after 17 days in the mantle compared to time
zero and to control (z ¼ )2.15; P ¼ 0.032; Fig. 1D),
and at 10 days in the digestive gland compared to time
zero (z ¼ )2.94; P ¼ 0.003). Expression in digestive
glands of exposed oysters was below that of the con-
trol at 3 days (z ¼ 2.61; P ¼ 0.009). The glycogen
phosphorylase expression showed a decrease between
the third and seventh day of exposure in gills com-
pared to the control and to time zero (respectively
z ¼ 2.61, P ¼ 0.009 and z ¼ 2.94, P ¼ 0.003) and
digestive gland (z ¼ 3.06; P ¼ 0.002 in comparison to
time zero), but increased significantly after 24 days in
digestive gland (z ¼ )2.45; P ¼ 0.014; Fig. 1E). Delta-
9 desaturase showed a strong induction between 10
and 17 days of exposure in gills (z ¼ )2.45; P ¼
0.014), mantle (z ¼ )2.61; P ¼ 0.009; Fig. 1F) and
digestive gland (z ¼ )2.20; P ¼ 0.027), in which it
then declined after 24 days of exposure (z ¼ 2.12;
P ¼ 0.034). The expression of the putative metallo-
thionein revealed important fluctuations with time
exposure. Expression remained under the control level
until 7 days of exposure in the three tissues (z ¼ 2.26;
P ¼0.024 in gills; z ¼ 3.06; P ¼ 0.002 in mantle,
Fig. 1G, z ¼ 2.26; P ¼ 0.024 in digestive gland), then
it increased in gills and mantle (z ¼ )2.45, P ¼ 0.014
and z ¼ )2.61, P ¼ 0.009, respectively, in comparison
to the control), before a decrease in mantle (Fig. 1G)
and digestive gland (z ¼ 2.82, P ¼ 0.005 and z ¼ 2.26,
P ¼ 0.024, respectively) at 24 days. HSP70s mRNA
levels stayed similar in exposed oysters than in control
oysters in the three tissues, until 10 days of exposure
in digestive gland when it dropped (z ¼ 2.45, P ¼
0.014), and until an increase of expression at 14 days
in gills (z ¼ )2.61, P ¼ 0.009, Fig. 1G). In gills and
mantle (Fig. 1H), expression of HSP70 gene decreased
after 21 days of exposure (z ¼ 2.45, P ¼ 0.014 and
z ¼ 2.24, P ¼ 0.025, respectively). However, a peak of
expression was observed at 17 days in digestive gland
(z ¼ )2.61, P ¼ 0.009).
The expression of genes involved in hypoxia
response showed that this response started very early
after the onset of exposure (7 days) and continued
until day 24.
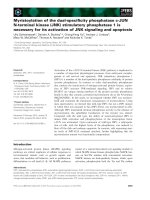
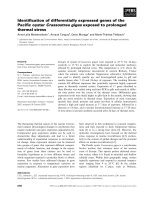
Quantification of HSP70 and MTs
Quantification by ELISA showed a significant increase
in HSP70 expression in the digestive gland of exposed
oysters after 17 days (z ¼ )2.61; P ¼ 0.009) and after
24 days (z ¼ )2.61; P ¼ 0.009) of exposure compared
to the control (Fig. 2A). The same trends were
Table 1. (Continued).
Homologue (protein)
BLASTX value
GenBank accession
number Organ
Ribosomal protein S20 2e-44 AJ563463 G ⁄ M
Ribosomal protein S27-1 0 AJ563471 Dg
Ribosomal protein S30 9e-30 CX069152 Dg
40S ribosomal protein 1e-21 CX069154 Dg
Unknown function
Unnamed protein product 2e-18 CX069148 Dg
Hypothetical protein 4e-52 MGC73053 G ⁄ M
Hypothetical protein AN8152.2 7e-09 CX069155 Dg
Unknown genes (70 sequences) CX068761 to CX068830
Oyster response to hypoxia exposure E. David et al.
5638 FEBS Journal 272 (2005) 5635–5652 ª 2005 FEBS
Table 2. Downregulated genes identified after 7–10 days of hypoxia exposure. G, Gills; M, mantle; Dg, digestive gland.
Homologue (protein)
BLASTX value
GenBank accession
number Organ
Cytoskeleton,structure, matrix
Collagen protein 5e-08 CX069163 G ⁄ M
Thymosin beta-4 precursor 2e-12 CX069192 Dg
Tubulin, beta polypeptide paralogue 4e-32 CX069204 Dg
Peritrophin 4e-07 CX069206 Dg
Respiratory chain, respiration
NADH dehydrogenase subunit 4 8e-89 AF177226 G ⁄ M
Cytochrome c oxidase subunit II 4e-73 AF177226 G ⁄ M
Cytochrome b 0 AF177226 Dg
NADH dehydrogenase subunit 1 0 AF177226 Dg
Stress proteins
Putative ethylene-inducible protein 7e-08 CX069189 Dg
Heat shock protein 70 6e-70 CX069205 Dg
Xenobiotique detoxification
Cytochrome P450 1A1 6e-27 CX069165 G ⁄ M
Amino acids metabolism
Glutamine synthetase 2 7e-10 CX069169 G ⁄ M
Energetic metabolism
Lipopolysaccharide and beta-1,3-glucan binding protein 4e-31 CX069184 Dg
Threonine 3-dehydrogenase 1e-16 CX069187 Dg
Putative 28 kDa protein, partner of Nob1 3e-82 CX069208 Dg
ATP synthase alpha subunit 1e-17 CX069210 Dg
Protein regulation
Translation elongation factor 1-alpha 5e-80 CX069182 Dg
Elongation factor 2 0 CX069197 Dg
Reproduction
Vitellogenin precursor 5e-04 CX069172 G ⁄ M
Cellular communication, membrane receptor and
immune system
Cavortin 4e-22 CF369147 G ⁄ M
Sodium-coupled ascorbic acid transporterI 2e-15 CX069171 G ⁄ M
Voltage dependent anion selective channel protein 2 2e-54 CX069174 G ⁄ M
Tumor-specific transplantation antigen P198 5e-44 CX069179 Dg
homologue p23
Calmodulin-related protein 5e-13 CX069181 Dg
Translocon associated protein gamma subunit 5e-36 CX069186 Dg
Dopamine-beta-hydroxylase 9e-04 CX069193 Dg
Perlucin 3e-05 CX069194 Dg
Insulin-like growth factor I 6e-05 CX069196 Dg
Solute carrier family 3, member 1 9e-20 CX069198 Dg
Steroid dehydrogenase-like 2e-04 CX069203 Dg
Peroxisomal membrane protein 3 3e-14 CX069207 Dg
Ribosomal proteins
Ribosomal protein L7a 1e-29 CX069162 G ⁄ M
Ribosomal protein L9 2e-28 CX069161 G ⁄ M
Ribosomal protein L14 2e-19 CX069164 G ⁄ M
Ribosomal protein L17a 7e-44 AJ563474 G ⁄ MDg
Ribosomal protein L15 4e-04 CX069175 G ⁄ M
Ribosomal protein L22 2e-19 CX069173 G ⁄ M
Ribosomal protein 19-prov protein 3e-18 CX069176 G ⁄ M
Ribosomal protein S17 2e-56 CF369144 Dg
Ribosomal protein S10 3e-30 AJ561117 Dg
Ribosomal protein S14 2e-29 CX069188 Dg
Ribosomal protein S3a e-112 CF369245 Dg
60S acidic ribosomal protein P1 3e-20 CX069191 Dg
E. David et al. Oyster response to hypoxia exposure
FEBS Journal 272 (2005) 5635–5652 ª 2005 FEBS 5639
observed in gills but were not significant (z ¼ )1.10,
P ¼ 0.270 and z ¼ )1.71, P ¼ 0.086 after 17 and
24 days, respectively) (Fig. 2B).
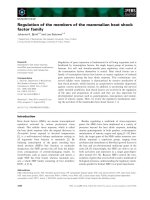
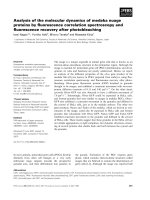
Expression of MTs measured by ELISA revealed a
significant increase in digestive gland of exposed oyster
after 17 days (z ¼ )1.97, P ¼ 0.048) and 21 days of
exposure (z ¼ )2.45, P ¼ 0.014) before decreasing
at 24 days of exposure to the level observed in the
control (Fig. 3A). In gills, a nonsignificant increase
was observed between 3 and 14 days (z ¼ )0.18, P ¼
0.854) in exposed oysters (Fig. 3B).
Discussion
Despite the increase of hypoxia events in coastal ecosys-
tems, only few studies have focused on gene expression
patterns of marine organisms subjected to this partic-
ular stress. In this paper, we characterized the molecular
response to hypoxia exposure under experimental condi-
tions of a marine mollusc, the oyster C. gigas. Using
a SSH method, we obtained 616 different partial
sequences of cDNA, encoding proteins involved in the
stress response induced by hypoxia in oysters after
7–10 days and after 24 days of exposure. This approach
was previously used to assess the response of aquatic
molluscs to various contaminants: pesticides [26] and
hydrocarbons [27] in C. gigas, or different contaminants
in zebra mussel Dreissena polymorpha [28].
The method we used allowed us to have an outline of
the main physiological functions affected by hypoxia
exposure in C. gigas, and to understand the regulation
process involved in the response to hypoxia. Several
physiological pathways have been shown to be regulated
by hypoxia stress and among the different genes charac-
terized, several genes appeared to encode proteins
involved in oxidative metabolism, confirming a close
relationship between hypoxia and reactive oxygen spe-
cies [29,30]. The same physiological functions were
affected in similar studies carried out on the effects of
other stresses on C. gigas, such as hydrocarbon expo-
sure [27], infection by parasites [31] or exposure to
herbicides [26].
Response to hypoxia stress seems to cause a cascade
of molecular and physiological processes. Precisely,
Hochachka et al. [8] described different phases of
response to oxygen lack in hypoxia tolerant systems.
The authors constructed their theory based on obser-
vations in anoxia-tolerant aquatic turtle cells. They
suggested that hypoxia-sensing and signal transduction
systems are first mobilized to cause a series of mole-
cular processes. Among these processes, they under-
lined a global decline in protein biosynthesis and a
decline in membrane permeability. Larade and Storey
[32] observed a reduction of protein synthesis in the
periwinkle Littorina littorea digestive gland after
30 min of anoxia. The SSH libraries made in this
study showed that hypoxia exposure affected mainly
genes involved in cell communication and immune sys-
tem and in protein regulation. Concerning the immune
system response, the shrimps Palaemonetes pugio and
Peneus vannamei showed lower survival when injected
with Vibrio and held under 30% air saturation com-
pared with control held in well-aerated water [33].
This study suggests that the innate immune system is
depressed in hypoxia, and can contribute to animal
mortality.
Table 2. (Continued).
Homologue (protein)
BLASTX value
GenBank accession
number Organ
Ribosomal protein L28 6e-17 CX069200 Dg
Ribosomal protein L8 3e-63 CX069201 Dg
Ribosomal protein S4 2e-51 CX069209 Dg
Unknown function
Unnamed protein product 2e-04 CX069167 G ⁄ M
Unnamed protein product 1e-11 CX069178 G ⁄ M
Hypothetical protein 5e-04 CX069168 G ⁄ M
Expressed protein F10B6.29 2e-05 CX069180 Dg
Expressed protein 1e-05 CX069183 Dg
Unknown, protein for image:3343149 4e-42 CX069190 Dg
ENSANGP00000012031 3e-05 CX069195 Dg
Hypothetical protein 1e-56 CX069199 Dg
Unnamed protein product 4e-75 CX069202 Dg
Unknown genes (56 sequences) CX068831 to CX068887
Oyster response to hypoxia exposure E. David et al.
5640 FEBS Journal 272 (2005) 5635–5652 ª 2005 FEBS
Table 3. Upregulated genes identified after 24 days of hypoxia exposure. G, Gills; M, mantle; Dg, digestive gland.
Homologue (protein)
BLASTX value
GenBank
accession no Organ
Cytoskeleton,structure, matrix
Thymosin beta 4 X chromosome 3e-12 CX069216 G ⁄ M
Hemicentin, fibulin 6 1e-05 CX069229 G ⁄ M
Actin, cytoplasmic 2 2e-35 CX069237 Dg
Alpha-tubulin 7e-06 CX069245 Dg
Beta-actin 3 3e-49 CX069247 Dg
Respiratory chain, respiration
NADH dehydrogenase subunit 5 7e-21 AF177226 G ⁄ M
NADH dehydrogenase subunit 3 2e-38 AF177226 G ⁄ M
Cytochrome c oxidase 2e-04 AF177226 G ⁄ M
Cytochrome oxidase subunit 1 0 AF177226 Dg
Detoxification proteins
Polyamine N-acetyltransferase (spermidine) 3e-10 CX069230 G ⁄ M
Spermidine synthase 6e-21 CX069283 Dg
Laccase 2 3e-17 CX069275 Dg
Stress protein
Metallothionein 3e-06 CX069233 G ⁄ M
Heat shock protein 25, isoform b 5e-09 CX069265 Dg
Energetic metabolism
Glycogen phosphorylase 7e-63 CX069214 G ⁄ M
Arginine kinase 0 BAD11950.1 Dg
Sdhb-prov protein 2e-50 CX069267 Dg
Endo alpha-1,4 polygalactosaminidase precursor 1e-30 CX069284 Dg
Lipid metabolism
Delta-9 desaturase 2e-34 CX069227 M
Fatty acid binding protein 7 3e-16 CX069274 Dg
Protein regulation
Ubiquitin conjugating enzyme 3e-34 CX069212 G ⁄ M
Histone acetyltransferase HPA2 3e-07 CX069224 G ⁄ M
CG31019-PA (RNA binding motif prot 5) 3e-04 CX069232 G ⁄ M
Translation elongation factor eEF-1 delta-2 chain 2e-27 CX069234 G ⁄ M
Elongation factor 1-alpha 0 BAD15289.1 Dg
Alpha-1-inhibitor III precursor 2e-07 CX069244 Dg
Eukaryotic translation initiation factor 6 4e-46 CX069250 Dg
Proteasome 26S non-ATPase subunit 1 4e-06 CX069258 Dg
Homologue of ES1 1e-45 CX069263 Dg
Putative calcium dependent protein kinase 2e-04 CX069266 Dg
Eukaryotic translation initiation factor 3 subunit 6 7e-31 CX069268 Dg
interacting protein
Apopain precursor (Caspase-3) 3e-3 CX069273 Dg
Carboxypeptidase B 3e-57 CX069279 Dg
Cathepsine
L-like cysteine protease 3e-44 CX069282 Dg
Protein disulfide-isomerase A6 precursor 1e-32 CX069278 Dg
Cellular communication, membrane receptor and immune system
Translocon associated protein gamma 7e-21 CX069236 G ⁄ M
Chrysoptin precursor 4e-06 CX069239 Dg
Cavortin 0 CF369147 AAP12558.1 Dg
Putative apical iodide transporter 1e-48 CX069249 Dg
Hemagglutinin ⁄ hemolysin-related protein 3e-3 CX069251 Dg
Alph-2-macroglobulin, N-terminal and alpha-2- 5e-21 CX069254 Dg
macroglobulin family member
Ependymin related protein-1 precursor 1e-14 CX069256 Dg
Prosaposin 1e-10 CX069257 Dg
Calmodulin 7e-04 CX069260 Dg
Sialic acid binding lectin 5e-14 CX069269 Dg
E. David et al. Oyster response to hypoxia exposure
FEBS Journal 272 (2005) 5635–5652 ª 2005 FEBS 5641
Our results suggest that energetic metabolism could
be affected by exposure to long-term hypoxia in
oysters. An upregulation of glycogen phosphorylase
mRNA after 24 days of hypoxia exposure was
observed. This enzyme is involved in glycogen degra-
dation during glycogenolysis and often activated by
hypoxia [34,35]. Taken together, these results suggest
that activation of glycogen phosphorylase and of
transcription, i.e. expression of this enzyme could
thus aim to sustain energy supply in stress situation
in oysters. Therefore, despite the decrease in O
2
cell
supply induced by hypoxia, ATP production could be
maintained in oysters by increasing carbohydrate
catabolism and therefore anaerobic metabolim as pre-
viously reported in other species [6]. Often, this
increase is then replaced by a suppression of the rates
of ATP production and of ATP utilization, in order
to reduce metabolic rate and ATP turnover rates, and
thus to save energy by maintaining ATP supply
demand balance [8]. Our results revealed a regulation
of expression of genes encoding enzymes of the res-
piratory chain. In particular, an ATP synthase sub-
unit appeared to be downregulated after 7–10 days of
hypoxia exposure. The fact that we observed a down-
regulation of ATP synthase earlier than an upregula-
tion of glycogen phosphorylase suggests that the
series of regulation of these enzymes may be more
complex at the trancriptional level than at the level
of activity.
Furthermore, still in order to maintain ATP supply
demand balance, hypoxia exposure modifies the hier-
archy of energy-consuming processes in cells [6]. To
Table 3. (Continued).
Homologue (protein)
BLASTX value
GenBank
accession no Organ
Nucleic acids regulation
Adenosylhomocysteinase 3e-16 CX069215 G ⁄ M
Myc homologue 1e-04 CX069221 CX069261 M
Putative HMG-like protein 0 CAD91447.1 Dg
ENPP4 protein 6e-23 CX069280 Dg
Development, differentiation
SHG precursor 9e-04 CX069240 Dg
Apextrin 8e-21 CX069241 Dg
Putative sphingosine-1-phosphate lyase 7e-17 CX069242 Dg
DEC-1 2e-05 CX069259 Dg
Ribosomal proteins
Ribosomal protein 3e-10 CX069211 G ⁄ M
Ribosomal protein S11 3e-28 AJ563454 G ⁄ M
60S ribosomal protein L37A 1e-23 CX069222 G ⁄ M
Ribosomal protein S5 5e-73 AJ563480 G ⁄ M
Ribosomal protein L35A 2e-13 CX069238 Dg
Ribosomal protein S6 5e-76 CX069246 Dg
Ribosomal protein L30 4e-22 CX069248 Dg
Ribosomal protein S14A 2e-47 CX069188 Dg
Ribosomal protein S8 0 AJ563461 Dg
Unknown function
Unnamed protein product 1e-76 CX069223 G ⁄ M
ENSANGP00000024201 2e-43 CX069213 G ⁄ M
Expressed protein 2e-11 CX069252 Dg
Riken cDNA 1200003O06 2e-07 CX069253 Dg
Hypothetical protein FG01274.1 7e-04 CX069255 Dg
Hypothetical 18K protein 3e-05 CB617354 Dg
MGC64292 protein 4e-16 CX069264 Dg
Zgc: 56211 2e-24 CX069270 Dg
Unknown (protein for IMAGE: 5139212) 2e-55 CX069271 Dg
SnoK-like protein 6e-05 CX069272 Dg
Unnamed protein product 4e-7 CX069276 Dg
CG3051-PC 2e-8 CX069277 Dg
Hypothetical protein 1e-32 CX069285 Dg
Unknown genes(109 sequences) CX068888 to CX068996
Oyster response to hypoxia exposure E. David et al.
5642 FEBS Journal 272 (2005) 5635–5652 ª 2005 FEBS
Table 4. Downregulated genes identified after 24 days of hypoxia exposure. G, gills; M, mantle; Dg, digestive gland.
Homologue (protein)
BLASTX value
GenBank
accession no Organ
Cytoskeleton,structure, matrix
Fibrillin 5e-22 CX069292 G ⁄ M
Proximal thread matrix protein 1 5e-7 CX069293 G ⁄ M
Myosin subunit essential light chain 5e-25 CX069307 G ⁄ M
Alpha-3 collagen type VI 2e-17 CX069310 G ⁄ M
Collagen protein 2e-4 CX069315 G ⁄ M
Actin 1 1e-23 CX069341 Dg
Cofilin 1e-13 CX069339 Dg
Respiratory chain
Cytochrome c oxidase subunit II 9e-38 AF177226 G ⁄ M
Stress protein
Superoxide dismutase 8e-5 CX069299 G ⁄ M
HSP 70 2e-19 CAC83009 G ⁄ M
Y-box factor homologue (APY1) 8e-16 CX069347 Dg
Energetic metabolism
Alcohol dehydrogenase class III chain 1e-53 CX069325 Dg
Lipid metabolism
Putative enoyl-CoA hydratase ⁄ isomerase 1e-15 CX069345 Dg
family protein
Protein regulation
Ubiquitin 1e-22 CX069287 G ⁄ M
Elongation factor 1-alpha 7e-43 BAD15289 G ⁄ M
Proteinase inhibitor 1e-9 CX069295 G ⁄ M
Eef2-prov protein 9e-61 CX069231 G ⁄ M
Translation elongation factor 1-gamma 1e-33 CX069306 G ⁄ M
Translation elongation factor 1-delta 3e-30 CX069309 G ⁄ M
Ubiquitin ⁄ ribosomal L40 fusion protein 2e-63 CX069286 G ⁄ M
Hepatopancreas kazal-type proteinase inhibitor 4e-5 CX069319 Dg
Eukaryotic translation initiation factor 4 A, isoform 1 2e-5 CX069326 Dg
Protein kinase, calcium-dependent (EC 2.7.1) 1e-4 CX069337 Dg
Ubiquitin conjugating enzyme 4e-34 CX069340 Dg
Elongation factor 1-delta 7e-33 CX069343 Dg
PP2A inhibitor 4e-49 CX069354 Dg
Amino acid metabolism
Glutamine synthetase 1e-44 CX069291 G ⁄ M
Reproduction
Male sterility domain containing 1 3e-10 CX069303 G ⁄ M
Cellular communication, membrane receptor and immune system
Calreticulin 2e-10 CX069289 G ⁄ M
CAP, adenylate cyclase-associated protein 1 3e-41 CX069294 G ⁄ M
Prohormone convertase 1 6e-36 CX069297 G ⁄ M
Vertebrate gliacolin C1Q 2e-7 CX069305 G ⁄ M
Prothrombinase FGL2 (fibrinogen like 2) 4e-42 CX069318 G ⁄ M
Precerebellin-like protein 2e-3 CX069029 G ⁄ M
Complement receptor-like protein 3 3e-7 CX069321 Dg
Scavenger receptor cysteine-rich protein type 12 4e-11 CX069350 Dg
Nodulin 2e-15 CX069323 Dg
T-cell activation protein phosphatase 2C 6e-49 CX069356 Dg
Nucleic acids regulation
Histone protein Hist2h3c1 4e-15 CX069324 Dg
Chain A, human reconstituted DNA 5e-16 CX069118 CX069353 Dg
polymerase I noncovalent
Esophageal cancer associated protein 1e-6 CX069352 Dg
E. David et al. Oyster response to hypoxia exposure
FEBS Journal 272 (2005) 5635–5652 ª 2005 FEBS 5643
sustain ATP supply, transcription rates and protein
synthesis drop dramatically. So we analysed the
expression of a transcription factor named BTF3.
This general transcription factor was initially purified
and described from HeLa cells [36]. The protein has
been shown to bind to RNA polymerase II, in order
to form a transcriptionally active complex. BTF3 was
thus supposed to be required for initiation of tran-
scription at several class II promoters but this need is
now under discussion [37]. Two isoforms have been
described, BTF3a and BTF3b [38]. We focused on
BTF3a which is the transcriptionally active isoform.
We observed a strong induction of BTF3a mRNA in
oysters after 10 days in the three tissues analysed. If
hypoxia generally leads to reduced gene transcription,
genes whose protein products are likely to play a very
important role in anoxia have upregulated transcrip-
tion during the lack of oxygen [22]. This could
explain the BTF3 mRNA upregulation observed in
exposed oysters in relation to the transcriptional
increase with other specific hypoxia-related genes.
Expression analyses of myc homologue gene that is
involved in nucleic acid regulation showed a two-
phase response. At 7 days of hypoxia exposure, we
Table 4. (Continued).
Homologue (protein)
BLASTX value
GenBank
accession no Organ
Development, differentiation
TGF beta-inducible nuclear protein 1 (LNR42) 2e)32 CX069355 Dg
Ribosomal proteins
Ribosomal protein S27-1 1e-41 CAD91436 G ⁄ M
60S ribosomal protein L14 2e-19 CX069164 G ⁄ M
Ribosomal protein L9 2e-27 CX069161 G ⁄ M
Ribosomal protein L18 2e-67 CAD91422 G ⁄ M
Ribosomal protein L 4e-69 CX069300 G ⁄ M
40S ribosomal protein S14 1e-46 CX069313 G ⁄ M
Ribosomal protein L10 1e-36 CX069316 G ⁄ M
Ribosomal protein S28 7e-8 CX069317 G ⁄ M
Ribosomal protein L7a 6e-29 CX069327 Dg
Ribosomal protein S1 2e-42 CX069330 Dg
Ribosomal protein L10a 1e-34 CX069331 Dg
Ribosomal protein L32 6e-34 CX069333 Dg
Ribosomal protein S2 5e-45 CX069157 Dg
Ribosomal protein L4 2e-53 CX069335 Dg
Unknown function
Riken cDNA E330026B02 7e-13 CX069288 G ⁄ M
Hypothetical protein CBG01956 4e-5 CX069296 G ⁄ M
Unnamed protein product 3e-71 CX069301 G ⁄ M
Hypothetical protein FG05763.1 2e-12 CX069302 G ⁄ M
Hypothetical protein CBG17384 3e-17 CX069312 G ⁄ M
Unnamed protein product 1e-5 CX069314 G ⁄ M
Hypothetical 18K protein 1e-3 CB617354 G ⁄ M
CG6770 4e-8 CX069320 Dg
ENSANGP00000005322 5e-7 CX069322 Dg
ENSANGP00000012272 2e-54 CX069329 Dg
ENSANGP00000010808 8e-64 CX069328 Dg
ENSANGP00000021803 3e-5 CX069332 Dg
Hypothetical protein 4e-5 CX069334 Dg
Unnamed protein product 7e-4 CX069336 Dg
ENSANGP00000021720 4e-18 CX069338 Dg
Unnamed protein product 7e-23 CX069342 Dg
Unnamed protein product 7e-4 CX069344 Dg
ENSANGP00000020091 8e-50 CX069346 Dg
MGC23908 protein 1e-23 CX069348 Dg
Unnamed protein product 5e-13 CX069349 Dg
MGC84748 4e-4 CX069351 Dg
Unknown genes(118 sequences) CX068997 to CX069114
Oyster response to hypoxia exposure E. David et al.
5644 FEBS Journal 272 (2005) 5635–5652 ª 2005 FEBS
observed an increase of expression in gills, followed
by a drop after 17 days in the three tissues. The myc
homologue belongs to the proto-oncogene family and
is involved in the control of cell division; it is also
able to elicit the adverse process, programmed cell
death [39]. To our knowledge, little is known about
the myc homologue in molluscs, although it appeared
upregulated in C. gigas after 21 days of hydrocarbon
exposure [27]. Under stress conditions such as
hypoxia, early myc homologue overexpression could
be explained by a reaction of cell protection, and the
observed decrease may be due to the efficiency of the
resistance system to the response to hypoxia. Mazure
et al. [40] reported a reduction of c-myc mRNA and
protein amounts in human hepatoma cells growing
under hypoxic conditions. They concluded to a
possible competition between HIF-1 and c-myc to
modulate the transcriptional activity of hypoxia
responsive genes. As HIF-1 has not previously been
described in oysters, this inhibition may be due to
competition with another regulation element inducible
by hypoxia. We actually showed a reduction of myc
homolog gene expression after 17 days in gills and
digestive gland.
As the supply of ATP by the respiratory chain relies
on O
2
consumption, genes implicated in respiration
and more generally in gas fluxes were expected to be
affected by hypoxia exposure. In our libraries, we iden-
tified the carbonic anhydrase as being upregulated.
This enzyme has been well studied in vertebrates [41].
It has also been more recently described in a symbiotic
marine invertebrate, Riftia pachyptila [42]. Carbonic
anhydrase is involved in the transfer of proton to CO
2
leading to bicarbonate [43]. This enzyme can play a
role in gas exchange during respiration, permitting a
shorter CO
2
transfer time, and also in ion and fluid
exchanges and intra- and extracellular pH regulation.
It also plays a role in calcification in molluscs. Among
the different isoforms of carbonic anhydrase described,
some (generally involved in tumours) are known to be
inducible by hypoxia via HIF-1 [44,45]. In this study
we observed an upregulated carbonic anhydrase
mRNA expression, which is in accordance with a high
CO
2
⁄ O
2
exchange efficiency needed during hypoxia
exposure.
Genes encoding enzymes that need oxygen to be act-
ive could also be regulated by hypoxia exposure. We
studied expression of the delta-9 desaturase gene that
is involved in lipid metabolism. This enzyme catalyses
the reaction of formation of monounsaturated fatty
acids and requires acyl-CoA, NADH, NADH-reduc-
tase, cytochrome b5, phospholipid and oxygen as
cofactors [46]. Delta-9 desaturase has been extensively
studied in mammals, chicken, fish and insects [47]. The
degree of unsaturation of fatty acids resulting from
delta-9 desaturase action affects physical properties of
membrane phospholipids. Moreover, metabolites of
polyunsaturated fatty acids act as signalling molecules
in many organisms [48]. To our knowledge, less is
known about delta-9 desaturase in molluscs, although
it appeared to be downregulated in C. gigas after
7 days of hydrocarbon exposure [27]. In the yeast Sac-
charomyces cerevisiae, Vasconcelles et al. [49] observed
an induction of mRNA expression of OLE1 gene enco-
ding delta-9 desaturase in hypoxia and in transition
metal exposure. In C. gigas, we observed an upregula-
tion of delta-9 desaturase mRNA expression after
10 days of hypoxia exposure. This induction may be a
response to the limitation of O
2
as a substrate [49].
Table 5. Summary of the results of expression studies in the three
tissues. ns, Nonsignificant.
Gene 3 7 10 14 17 21 24
Carbonic anhydrase
Gills ns ns +
c,0
+
cc
+
0
ns
Mantle ns ns +
c
+
c
+
0
ns +
c,0
Digestive gland )
c,0
+
c,0
+
c,0
ns )
c
+
c,0
+
c,0
Glutathione peroxidase
Gills +
c
+
c
ns +
c
ns +
c
+
c
Mantle +
c
+
c
ns +
c
+
c
+
c
+
c
Digestive gland ns ns ns +
c
ns +
c
+
0
Myc homologue
Gills ns ns ns ns )
c,0
)
0
)
c
Mantle ns ns ns ns ns ns ns
Digestive gland ns ns +
c
ns )
cc
ns ns
BTF3
Gills ns +
c
+
0
ns ns ns ns
Mantle ns ns +
c
ns +
c,0
ns ns
Digestive gland )
c
+
c,0
+
0
ns +
c,0
ns +
c
Glycogen phosphorylase
Gills )
c
)
c
ns ns ns )
c
ns
Mantle ns )
cc
ns ns ns ns
Digestive gland )
0
ns ns ns ns ns +
c
Delta-9 desaturase
Gills ns ns ns +
c,0
+
c
ns ns
Mantle ns )
c,0
ns +
c
+
c
ns ns
Digestive gland ns ns )
c
ns +
c
ns )
c
Putative metallothionein
Gills )
c
)
c
)
c,0
+
c
ns ns ns
Mantle )
0
)
c,0
ns +
c
)
c
+
c
)
c,0
Digestive gland )
0
)
c,0
ns ns )
c,0
)
c,0
)
c
HSP70
Gills ns ns ns +
c,0
+
0
)
c,0
)
c,0
Mantle +
0
ns ns ns ns )
c
ns
Digestive gland ns ns )
c
ns +
c
ns ns
) Significant decrease at 5%. + Significant increase at 5%.
c
Signi-
ficant difference from corresponding control.
0
Significant difference
from time zero).
E. David et al. Oyster response to hypoxia exposure
FEBS Journal 272 (2005) 5635–5652 ª 2005 FEBS 5645
Some products of the enzyme could also play an
important role in hypoxia tolerance by signal trans-
duction.
As oxygen is also at the basis of oxidative metabo-
lism, genes encoding enzymes involved in the cellular
regulation of oxidative stress, such as antioxidants, are
AB
CD
E
F
G
H
Fig. 1. Analysis of differential expression of up- and downregulated genes in C. gigas exposed to hypoxia. Gene expression is presented as
the calculated ratio Do
gene
⁄ Do
28S
after RT-PCR. For each gene, the dotted line represents control samples, the full line the experimental
samples, and the error bars correspond to the SD for the five samples at the sampling time considered. *Significant difference between
control and hypoxic samples. (A) Expression of carbonic anhydrase in gills. (B) Expression of glutathione peroxidase in mantle. (C) Expression
of myc homologue in gills. (D) Expression of BTF3 in mantle. (E) Expression of glycogen phosphorylase in digestive gland. (F) Expression of
delta-9 desaturase in mantle. (G) Expression of putative metallothionein in mantle. (H) Expression of HSP70 in mantle.
Oyster response to hypoxia exposure E. David et al.
5646 FEBS Journal 272 (2005) 5635–5652 ª 2005 FEBS
consequently expected to be regulated by hypoxia. We
studied the expression of GPx that is known to be
directly involved in oxidative metabolism. Glutathione
peroxidase is a selenium-dependent enzyme, which
transforms H
2
O
2
and various peroxides and requires
reduced glutathione as a cosubstrate [50]. The classical
form is cellular and dispersed throughout the cyto-
plasm, but GPx activity is also found in mitochondria
[51]. Pannunzio and Storey [52] observed a suppression
of GPx activity during anoxia exposure in the hepato-
pancreas of the marine gastropod Littorina littorea. On
the other hand, hyperoxia increases the GPx mRNA
level and activity in rat lung [53]. In our study, expres-
sion analysis of GPx mRNA revealed an upregulation
with hypoxia exposure. Such an enhanced expression
could aim to protect cells from reactive oxygen species
that can be formed upon reoxygenation [54,55].
We also identified other potentially hypoxia-regulated
genes known to participate in the oxidative stress
response-the MTs. The sequence we obtained showed
strong similarities with oyster MT genes (C-X-C pat-
terns) but appeared to be a novel sequence. Metallo-
thioneins are small, cysteine-rich, heat-stable proteins
involved in the cellular regulation of essential metals,
and in detoxification of heavy metals. Several MT iso-
forms such as Cg-MT2 have been described in C. gigas
and have been shown to be inducible by metallic stress
[56]. Metallothioneins also have diverse physiological
functions including protection against oxidants [57].
Murphy et al. [58] reported activation of MT gene
expression by hypoxia in human myoblasts. In the
marine gastropod Littorina littorea, cDNA library dif-
ferential screening allowed the identification of a
sequence coding for a protein belonging to the MT
family that appeared to be upregulated in foot muscle
and digestive gland in response to anoxia stress [59].
The authors suggested that such an increase in MT
expression could be explained by the antioxidant role
of MT, a function that was previously demonstrated in
mussels by Viarengo et al. [60]. This increase can be
interpreted as a preparatory measure against oxidative
stress that could occur during recovery from anoxia.
In this study, we observed an induction of a putative
MT after 14 days of hypoxia exposure in the mantle,
A
B
Fig. 2. Quantification of HSP70 in C. gigas exposed to hypoxia. The
dotted line represents control samples, the full line the experimen-
tal samples, and the error bars correspond to the SD for the five
samples at the sampling time considered. *Significant difference
between control and hypoxic samples. (A) Quantification of HSP70
in digestive gland. (B) Quantification of HSP70 in gills.
A
B
Fig. 3. Quantification of MTs in C. gigas exposed to hypoxia. The
dotted line represents control samples, the full line the experimen-
tal samples, and the error bars correspond to the SD for the five
samples at the sampling time considered. *Significant difference
between control and hypoxic samples. (A) Quantification of MT in
digestive gland. (B) Quantification of MT in gills.
E. David et al. Oyster response to hypoxia exposure
FEBS Journal 272 (2005) 5635–5652 ª 2005 FEBS 5647
followed by a depression of expression. This induction
occurred as an ‘anticipatory response’ to protect
against the oxidative stress which occurs during reoxy-
genation. With exposure duration, MT gene expression
became reduced, as reoxygenation did not occur. The
same trends were observed by ELISA quantification
of MTs in gills, revealing an increase of the level of
this protein after 10 days of hypoxia exposure. In the
digestive gland, however, induction occurs later
(21 days), suggesting an organ-specific response. Quan-
tification of another stress protein family, HSP70,
revealed an induced expression of these proteins in
hypoxia-exposed oysters compared to controls. These
data indicate that hypoxia-exposed oysters were highly
stressed by the exposure, but also suggest differential
tissue-dependant time of response. Indeed, the HSP70
family is widely recognized to be induced by multiple
stressors [61], and Delaney and Klesius [62] observed
an induced HSP70 production by hypoxia in Nile til-
apia. We emphasize, however, that HSP70 transcrip-
tion appeared to be downregulated after 21 days of
hypoxia. Reduced expression of HSP70 gene in
response to hypoxia has been described in human
microvascular HMEC-1 cells [63], associated with a
reduction of HSP70 protein level, and the authors sug-
gest that expression is cell type dependent and connec-
ted to hypoxia tolerance. However, our results show
that during hypoxia HSP70 production increases in
response to the stress. This increase in the enzyme
quantity may be a consequence of signal transduction
regulation, if a pool of mRNA is already present in
cells, and perhaps of early transcriptional regulation in
some tissues. These cells are therefore ready to react
very quickly to any stress situation.
The results we report in this paper provide a prelim-
inary basis for the comprehension of adaptive strat-
egies developed by C. gigas in response to hypoxic
conditions. Future efforts will focus on the expression
of these regulated genes in wild populations of oysters
submitted to various hypoxic stress intensities in
marine estuaries, and on the search for functional
polymorphisms in these genes.
Experimental procedures
Oyster conditioning and treatment
The experiment was performed in tanks with an effective
water volume of 50 L. Tanks were supplied with a continu-
ous flow of water at 15 °C and 34 ppt salinity. Adult oysters,
collected from La pointe du Chaˆ teau (Britanny, France),
were divided into two groups of 50 animals. They were fed
three times a week with a microalgae suspension (containing
Isochrysis galbana, Pavlova lutheri and Dunaliella primolecta).
After a 7-day acclimatization period in tanks supplied with
aerated 0.22 lm-filtered seawater, oysters were exposed for
24 days either to hypoxia [30% (v ⁄ v) O
2
-saturation] or norm-
oxia [100% (v ⁄ v) O
2
-saturation, control group]. At day 0, the
start of the experiment, O
2
-concentration in the inflowing
water was decreased to 30% O
2
-saturation using an oxygen
depletion system according to Pichavant et al. [64]. Briefly,
before reaching the rearing tank, seawater flowed through a
column where nitrogen was injected. Oxygen removal was
controlled by nitrogen flow. Surface gas exchange in the rea-
ring tank was limited by setting the water inflow under the
water surface. The O
2
concentration in the tank was monit-
ored using a WTW oxymeter and adjusted when necessary to
keep hypoxia level constant all along the experiment. Norm-
oxia was obtained by equilibrating seawater with air. Ani-
mals were fed throughout the experiment in the same way as
during the acclimatization. No mortality was observed either
in the control or in the hypoxia-exposed oysters.
For each experimental condition, animals were sampled
at regular intervals (0, 3, 7, 10, 14, 17, 21 and 24 days).
Digestive gland, gills and mantle were dissected, frozen in
liquid nitrogen and stored until analyses.
Suppression subtractive hybridization
Total RNA was extracted from the digestive gland, gills
and the mantle of 10 control and 10 exposed oysters after
7–10 and 24 days of exposure using RNAble (Eurobio, les
Ulis, France) according to the manufacturer’s instructions.
Poly(A)
+
mRNA was isolated from total RNA using the
PolyATtractÒmRNA Isolation System (Promega, Madi-
son, WI, USA) according to the manufacturer’s instruc-
tions.
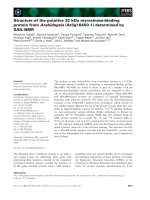
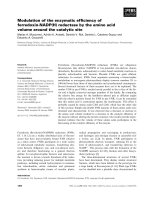
Forward and reverse subtracted libraries were made on
2 lg mRNA (1 lg mRNA from the gill, 1 lg mRNA from
the mantle for one library; 2 lg mRNA from the digestive
gland for the second library). A total of eight libraries (four
forward, four reverse, Fig. 4) was constructed using: gills
and mantle after 7–10 days, digestive gland after 7–10 days,
gills and mantle after 24 days, digestive gland after 24 days.
First and second strand cDNA synthesis, RsaI endonuc-
lease enzyme digestion, adapter ligation, hybridization, and
PCR amplification were performed as described by the
PCR-select cDNA subtraction manufacturer (Clontech,
Palo Alto, CA, USA). Differentially expressed PCR prod-
ucts were cloned into pGEM-T vector (Promega). Two
hundred white colonies per library were grown in Luria–
Bertani medium (with 100 mgÆL
)1
ampicillin). The vector
was extracted using an alkaline lysis plasmid miniprepara-
tion and screened by size after PCR amplification of the
insert (performed in 2 mm MgCl
2
and 10 pmol of T7 and
SP6 primers). A total of 1000 clones was sequenced using a
Li-COR IR
2
(Sciencetech) and Thermo Sequenase Primer
Cycle Sequencing Kit (Amersham Bioscience, Uppsala,
Oyster response to hypoxia exposure E. David et al.
5648 FEBS Journal 272 (2005) 5635–5652 ª 2005 FEBS
Sweden) and an AB3100 sequencer and Big Dye Termina-
tor V3.1 Kit (both Perkin-Elmer, Wellesley, MA, USA). All
sequences were subjected to a homology search through the
blastx program ( />Hypoxia response gene expression analysis
by RT-PCR
Total RNA was extracted from the digestive gland, the gill
and the mantle of control and oysters exposed to 0, 3, 7, 10,
14, 17, 21 and 24 days of hypoxia using a method based on
extraction in guanidium isothiocyanate. For each sample,
20 lg RNA was submitted to reverse transcription using
oligo dT anchor primer (5¢-GACCACGCGTATCGA
TGTCGACT
(16)
V-3¢) and Moloney murine leukaemia virus
(MMLV) reverse transcriptase (Promega). The amplification
of carbonic anhydrase, GPx, myc homologue, glycogen
phosphorylase, delta-9 desaturase, BTF3, a putative metal-
lothionein and HSP70 mRNA were performed in 2 mm
MgCl
2
and 10 pmol of each primer. Combinations of prim-
ers we used are shown in Table 6. 28S ribosomal RNA was
used as a PCR internal control under the same conditions
with primers sense (5¢-AAGGGCAGGAAAAGAAACT
AAC-3¢) and antisense (5¢-GTTTCCCTCTAAGTGGTTT
CAC-3¢). The number of PCR cycles was 35 for carbonic an-
hydrase, glutathione peroxidase, BTF3, myc homologue and
HSP70 expression, 40 for delta-9 desaturase, glycogen phos-
phorylase and putative metallothionein expression, and 25
for 28S amplification to avoid band intensity saturation for
optical determination. The resulting PCR products were sep-
arated by electrophoresis through a 0.5 · TBE ⁄ 1.5% agarose
gel, and visualized with UV light after staining with ethidium
bromide. Band intensities were quantified using the gene
profiler software (version 4.03, Scanalytics, Inc, Lincoln,
NE, USA).
Protein extraction and quantification of HSP70
and MTs by ELISA
On days 0, 3, 7, 10, 14, 17, 21 and 24, samples of gills and
digestive glands from exposed and control oysters (n ¼ 5
for each sample) were collected, homogenized in protein
extraction buffer (150 mm NaCl, 10 mm NaH
2
PO
4
,1mm
phenylmethanesulfonyl fluoride pH ¼ 7.2) and centrifuged.
Protein concentration was estimated with a D
c
Protein
Assay kit (Bio-Rad, Hercules, CA, USA) using BSA as the
standard. Optical density was measured at 620 nm using a
microplate reader. Microtiter plates were coated with 20 lgÆ
well
)1
of total proteins and incubated over night at 4 °C.
HSP70 and MTs concentrations were estimated by ELISA
using rabbit anti-CgHsc72 and anti-CgMt polyclonal
Fig. 4. Diagram of the different subtractions performed in C. gigas with SSH, after 7–10 days of hypoxia exposure and after 24 days of hyp-
oxia exposure, and resulting libraries with corresponding tissues. G, Gills; M, mantle; Dg, digestive gland.
Table 6. Combinations of primers used in RT-PCR expression ana-
lysis.
Genes Primer sequences
Carbonic
anhydrase
5¢-AAACAGGCGGGAAACCACAGTAACACGGT-3¢
5¢-CACTGGACGCTTTCATAACAAGGGGGCGT-3¢
Glutathione
peroxidase
5¢-GATGACGTCCCCAGTCATGAGGGGTGGTC-3¢
5¢-TGGGGGATGGAGGGTAAGACCATACACTT-3¢
Myc homologue 5¢-TTCTATAACGGAACATTATACCAACAAGG-3¢
5¢-CAACATTTACCTGGGGCAGGTGGGTTCAG-3¢
BTF3 5¢-AATCCAAAAGTGCAGGCCTCACTAGCAGC-3¢
5¢-TTGCCGACTAATTCCGGGACTCCATCATC-3¢
Glycogen
phosphorylase
5¢-CCGTCTTGCCAGAGTTTCTCCACCTCCTC-3¢
5¢-GTCGTCAACAACGATCCTGACGTTGGGGA-3¢
Delta-9
desaturase
5¢-TACTGTCTTCTGCTAAACGCCAC-3¢
5¢-GTCGTGATATTGAGGTGCCAGCC-3¢
Putative
metallothionein
5¢-GCCCAGACGGGAAAATGCGTGTG-3¢
5¢-CAGTTACACGATGCTTTGGCGCA-3¢
HSP70 5¢-GGAATAGATCTTGGAACCACATA-3¢
5¢-TTGCCAAGATATGCTTCTGCAGT-3¢
E. David et al. Oyster response to hypoxia exposure
FEBS Journal 272 (2005) 5635–5652 ª 2005 FEBS 5649
antibodies and recombinant CgHsc72 and CgMt, respect-
ively, as standards, according to procedures previously
described [65,66].
Statistical analysis
The variations in gene expression and in protein amount
were analysed by the Mann–Whitney’s U test using statis-
tica Software (Statsoft).
Acknowledgements
This research program was financially supported by
the Re
´
gion Bretagne, the interregional program
MOREST (Summer Mortality of juvenile oyster Cras-
sostrea gigas, Grant number 02-2-500022) and the
Conseil Ge
´
ne
´
ral du Finiste
`
re.
References
1 Gray SG, Wu RS & Or YY (2002) Effects of hypoxia
and organic enrichment on the coastal marine environ-
ment. Mar Ecol Prog Series 238, 249–279.
2 Jørgensen BB (1996) Material flux in the sediment. In
Eutrophication in Coastal Marine Ecosystems (Jørgensen
BB & Richardson K, eds), pp. 115–135. American Geo-
physical Union, Washington DC.
3 Cloern JE (2001) Our evolving conceptual model of the
coastal eutrophication problem. Mar Ecol Prog Series
210, 223–253.
4 Wu RSS (2002) Hypoxia: from molecular responses to
ecosystem responses. Mar Pollut Bull 45, 35–45.
5 Storey KB (1993) Molecular mechanisms of metabolic
arrest in molluscs. In Surviving Hypoxia: Mechanisms of
Control and Adaptation (Hochachka PW, Lutz PL, Sick
TJ, Rosenthal M & Thillart G, eds), pp. 253–269. CRC
Press, Boca Raton.
6 Larade K & Storey KB (2002) A profile of the meta-
bolic responses to anoxia in marine invertebrates. In
Cell and Molecular Responses to Stress, Vol. 3 (Storey
KB & Storey JM, eds), pp. 27–46. Elsevier Press,
Amsterdam.
7 Greenway SC & Storey KB (2001) Effects of seasonal
change and prolonged anoxia on metabolic enzymes of
Littorina littorea. Can J Zool 79, 907–915.
8 Hochachka PW, Buck LT, Doll CJ & Land SC (1996)
Unifying theory of hypoxia tolerance: molecular ⁄ meta-
bolic defence and rescue mechanisms for surviving oxy-
gen lack. Biochemistry 93, 9493–9498.
9 Hermes-Lima M, Storey JM & Storey KB (2001) Anti-
oxidant defenses and animal adaptation to oxygen avail-
ability during environmental stress. In Cell and Molecular
Responses to Stress, Vol. 2 (Storey KB & Storey JM,
eds), pp. 263–287. Elsevier Press, Amsterdam.
10 Wu RSS & Lam PKS (1997) Glucose-6-phosphate dehy-
drogenase and lactate dehydrogenase in the green-lipped
muscle (Perna viridis): possible biomarkers for hypoxia
in the marine environment. Water Res 11, 2797–2801.
11 Greenway SC & Storey KB (1999) The effect of pro-
longed anoxia on enzyme activities in oysters ( Crassos-
trea virginica) at different seasons. J Exp Mar Biol Ecol
242, 259–272.
12 Greenway SC & Storey KB (2000) Seasonal change and
prolonged anoxia affect the kinetic properties of phos-
phofructokinase and pyruvate kinase in oysters. J Comp
Physiol 170B, 285–293.
13 Fandrey J (1995) Hypoxia-inducible gene expression.
Respir Physiol 101, 1–10.
14 D’Angio CT & Finkelstein JN (2000) Oxygen regulation
of gene expression: a study in opposites. Mol Genet
Metab 71, 371–380.
15 Semenza GL (2001) HIF-1 and mechanisms of hypoxia
sensing. Curr Op Cell Biol 13, 167–171.
16 Hochachka PW & Lutz PL (2001) Mechanism, origin,
and evolution of anoxia tolerance in animals. Comp
Biochem Physiol 130B, 435–459.
17 Hirota K (2002) Hypoxia-inducible factor 1, a master
transcription factor of cellular hypoxic gene expression.
J Anesth 16, 150–159.
18 Minchenko O, Opentanova I & Caro J (2003) Hypoxic
regulation of the 6-phosphofructo-2-kinase ⁄ fructose-2,6-
bisphosphatase gene family (PFKFB-1–4) expression in
vivo. FEBS Lett 554, 264–270.
19 Gracey AY, Troll JV & Somero GN (2001) Hypoxia-
induced gene expression profiling in the euryoxic fish
Gillichthys mirabilis . Proc Natl Acad Sci USA 98, 1993–
1998.
20 Ma E, Xu T & Haddad GG (1999) Gene regulation by
O
2
deprivation: an anoxia- regulated novel gene in
Drosophila melanogaster. Mol Brain Res 63 , 217–224.
21 Larade K, Nimigan A & Storey KB (2001) Transcrip-
tion pattern of ribosomal protein L26 during anoxia
exposure in Littorina littorea. J Exp Zool 290, 759–768.
22 Larade K & Storey KB (2002) Characterization of a
novel gene up-regulated during anoxia exposure in the
marine snail, Littorina littorea. Gene 283, 145–154.
23 Larade K & Storey KB (2004) Anoxia-induced tran-
scriptional upregulation of sarp-19: cloning and charac-
terization of a novel EF-hand containing gene expressed
in hepatopancreas of Littorina littorea. Biochem Cell
Biol 82, 285–293.
24 Farahani R & Haddad GG (2003) Understanding the
molecular responses to hypoxia using Drosophila as a
genetic model. Respir Physiol Neurobiol 135, 221–229.
25 Brouwer M, Larkin P, Brown-Peterson N, King C,
Manning S & Denslow N (2004) Effects of hypoxia on
gene and protein expression in the blue crab, Callinectes
sapidus. Mar Environ Res 58, 787–792.
Oyster response to hypoxia exposure E. David et al.
5650 FEBS Journal 272 (2005) 5635–5652 ª 2005 FEBS
26 Tanguy A, Boutet I, Laroche J & Moraga D (2005) Mole-
cular identification and expression study of differentially
regulated genes in the Pacific oyster Crassostrea gigas in
response to pesticides exposure. FEBS J 272, 390–403.
27 Boutet I, Tanguy A & Moraga D (2004) Response of
the Pacific oyster Crassostrea gigas to hydrocarbon con-
tamination under experimental conditions. Gene 329,
147–157.
28 Bultelle F, Panchout M, Leboulenger F & Danger JM
(2002) Identification of differentially expressed genes in
Dreissena polymorpha exposed to contaminants. Mar
Environ Res 54, 385–389.
29 Willmore WG & Storey KB (1997) Antioxidant systems
and anoxia tolerance in a freshwater turtle. Trachemys
Scripta Elegans Mol Cell Biochem 170, 177–185.
30 Richier S, Merle PL, Furla P, Pigozzi D, Sola F &
Allemand D (2003) Characterization of superoxide
dismutase in anoxia- and hyperoxia-tolerant symbiotic
cnidarians. Biochem Biophy Acta 1621, 84–91.
31 Tanguy A, Guo X & Ford SE (2004) Discovery of genes
expressed in response to Perkinsus marinus challenge in
the Eastern (Crassostrea virginica) and Pacific (Crassos-
trea gigas) oysters. Gene 338, 121–131.
32 Larade K & Storey KB (2002) Reversible suppression
of protein synthesis in concert with polysome disaggre-
gation during anoxia exposure in Littorina littorea. Mol
Cell Biochem 232, 121–127.
33 Burnett LE & Burnett KG (2000) The effects of hypoxia
and hypercapnia on cellular defenses of oysters, shrimp,
and fish. Comp Biochem Physiol 126B, S1–S108.
34 Mehrani H & Storey KB (1995) Enzymatic control of
glycogenolysis during anoxic submergence in the fresh-
water turtle Trachemys scripta. Int J Biochem Cell Biol
27, 821–830.
35 Theen J, Gilboe DP & Nuttall FQ (1982) Liver glyco-
gen synthase and phosphorylase changes in vivo with
hypoxia and anesthetics. AM J Physiol 243, 182–187.
36 Zheng XM, Moncollin V, Egly JM & Chambon P
(1987) A general transcription factor forms a stable
complex with RNA polymerase B (II). Cell 50, 361–368.
37 Potashkin J, Wentz-Hunter K & Callaci J (1996) BTF3
is evolutionarily conserved in fission yeast. Biochim
Biophys Acta 1308, 182–184.
38 Grein S & Pyerin W (1999) BTF3 is a potential new
substrate of protein kinase CK2. Mol Cell Biochem 191,
121–128.
39 Evan GI, Wyllie AH, Gilbert CS, Littlewood TD, Land
H, Brooks M, Waters CM, Penn LZ & Hancock DC
(1992) Induction of apoptosis in fibroblasts by c-myc
protein. Cell 69, 119–128.
40 Mazure NM, Chauvet C, Bois-Joyeux B, Bernard MA,
Nacer-Che
´
rif H & Danan JL (2002) Repression of
a-fetoprotein gene expression under hypoxic conditions
in human hepatoma cells: characterization of a negative
hypoxia response element that mediates opposite effects
of hypoxia inducible factor-1 and c-myc. Cancer Res 62,
1158–1165.
41 Maren TH (1967) Carbonic anhydrase: chemistry, physio-
logy, and inhibition. Physiol Rev 47, 595–781.
42 De Cian MC, Bailly X, Morales J, Strub JM, Van
Dorsselaer A & Lallier FH (2003) Characterization of
carbonic anhydrases from Riftia pachyptila, a symbiotic
invertebrate from deep-sea hydrothermal vents. Proteins
51, 327–339.
43 Chegwidden WR, Dodgson S & Spencer IM (2000) The
roles of carbonic anhydrase in metabolism, cell growth
and cancer in animals. Carbonic Anhydrases New
Horizons 90, 343–363.
44 Wykoff CC, Beasley NJ, Watson PH, Turner KJ,
Pastorek J, Sibtain A, Wilson GD, Turley H, Talks KL,
Maxwell PH, Pugh CW, Ratcliffe PJ & Harris AL
(2000) Hypoxia-inducible expression of tumor-asso-
ciated carbonic anhydrases. Cancer Res 60, 7075–7083.
45 Potter C & Harris AL (2004) Hypoxia inducible carbo-
nic anhydrase IX, marker of tumour hypoxia, survival
pathway and therapy target. Cell Cycle 3, 164–167.
46 Ozols J (1997) Degradation of hepatic stearyl CoA D-9
desaturase. Mol Biol Cell 8, 2281–2290.
47 Tocher DR, Leaver MJ & Hodgson PA (1998) Recent
advances in the biochemistry and molecular biology of
fatty acyl desaturases. Prog Lipid Res 37, 73–117.
48 Nakamura MT & Nara TY (2004) Structure, function,
and dietary regulation of D6, D5, and D9 desaturases.
Ann Rev Nutrition 24, 345–376.
49 Vasconcelles MJ, Jiang Y, McDaid K, Gilooly L, Wret-
zel S, Porter DL, Martin CE & Glodberg MA (2001)
Identification and characterization of a low oxygen
response element involved in the hypoxic induction of a
family of Saccharomyces cerevisiae genes. J Biol Chem
276, 14374–14384.
50 Kinnula VL, Crapo JD & Raivio KO (1995) Generation
and disposal of reactive oxygen metabolites in the lung.
Laboratory Invest 73, 3–19.
51 Buettner GR (1998) Antioxidant enzymes and functions:
Naturally occurring antioxidants. Oxygen ‘’98, Proceed-
ings of the annual meeting of the Oxygen Society,
Washington DC, USA 1, 1–20.
52 Pannunzio TM & Storey KB (1998) Antioxidant
defenses and lipid peroxidation during anoxia stress and
aerobic recovery in the marine gastropod Littorina lit-
torea. J Exp Mar Biol Ecol 221, 277–292.
53 Ho YS, Dey MS & Crapo JD (1996) Antioxidant
enzyme expression in rat lungs during hyperoxia. Am J
Physiol 270, 810–818.
54 Hermes-Lima M, Storey JM & Storey KB (1998) Anti-
oxidant defenses and metabolic depression: The hypoth-
esis of preparation for oxidative stress in land snails.
Comp Biochem Physiol 120B, 437–448.
55 Lepore DA, Shinkel TA, Fisicaro N, Mysore TB, John-
son LE, d’Apice AJ & Cowan PJ (2004) Enhanced
E. David et al. Oyster response to hypoxia exposure
FEBS Journal 272 (2005) 5635–5652 ª 2005 FEBS 5651
expression of glutathione peroxidase protects islet beta
cells from hypoxia-reoxygenation. Xenotransplantation
11, 53–59.
56 Tanguy A & Moraga D (2001) Cloning and characteri-
zation of the gene coding for a novel metallothionein in
the Pacific oyster Crassostrea gigas: CgMT2 a case of
adaptive response to metal-induced stress? Gene 273,
123–130.
57 Suzuki Y & Cherian MG (2000) Effect of ethanol on
brain metallothionein in transgenic mice. Alcohol Clin
Exp Res 24, 315–321.
58 Murphy BJ, Andrews GK, Bittel D, Discher DJ,
McCue J, Green CJ, Yanovsky M, Giaccia A, Suther-
land RM, Laderoute KR & Webster KA (1999) Activa-
tion of metallothionein gene expression by hypoxia
involves metal response elements and metal transcrip-
tion factor-1. Cancer Res 59, 1315–1322.
59 English TE & Storey KB (2002) Freezing and anoxia
stresses induce expression of metallothionein in the foot
muscle and hepatopancreas of the marine gastropod
Littorina littorea. J Exp Biol 206, 2517–2524.
60 Viarengo A, Burlando B, Cavaletto M, Marchi B,
Ponzano E & Blasco J (1999) Role of metallothionein
against oxidative stress in the mussel Mytilus gallopro-
vincialis. Am J Physiol 277, R1612–R1619.
61 Snyder MJ, Girvetz E & Mulder EP (2001) Induction of
marine mollusc stress proteins by chemical or physiolo-
gical stress. Arch Environ Contam Toxicol 41, 22–29.
62 Delaney MA & Klesius PH (2004) Hypoxic conditions
induce Hsp70 production in blood, brain and head kid-
ney of juvenile Nile tilapia Oreochromis niloticus (L.).
Aquaculture 236, 633–644.
63 Oehler R, Schmierer B, Zellner M, Prohaska R & Roth
E (2000) Endothelial cells downregulate expression of
the 70 kDa heat shock protein during hypoxia. Biochem
Biophys Res Commun 274, 542–547.
64 Pichavant K, Person-Le-Ruyet J, Le Bayon N, Se
´
ve
`
re
A, Le Roux A, Que
´
me
´
ner L, Maxime V, Nonnotte G &
Bœuf G (2000) Effects of hypoxia on growth and meta-
bolism of juvenile turbot. Aquaculture 188, 103–114.
65 Boutet I, Tanguy A, Auffret M, Riso R & Moraga D
(2002) Immunochemical quantification of metallothio-
neins in marine molluscs: characterization of a metal
exposure bio-indicator. Environ Toxicol Chem 21, 1009–
1014.
66 Boutet I, Tanguy A, Rousseau S, Auffret M & Moraga
D (2003) Molecular identification and expression of heat
shock cognate 70 (hsc70) and heat shock protein 70
(hsp70) genes in the Pacific oyster Crassostrea gigas.
Cell Stress Chaperon 8, 76–85.
Oyster response to hypoxia exposure E. David et al.
5652 FEBS Journal 272 (2005) 5635–5652 ª 2005 FEBS