how to use excel in analytical chemistry and in general scientific data analysis pptx
Bạn đang xem bản rút gọn của tài liệu. Xem và tải ngay bản đầy đủ của tài liệu tại đây (14.01 MB, 501 trang )
how to use excel ® in analytical chemistry
and in general scientific data analysis
how to use
®
excel
in analytical
chemistry
and in general scientific
data analysis
Robert de Levie
Bowdoin College, Brunswick, ME
The Pitt Building, Trumpington Street, Cambridge, United Kingdom
The Edinburgh Building, Cambridge CB2 2RU, UK
40 West 20th Street, New York, NY 10011-4211, USA
477 Williamstown Road, Port Melbourne, VIC 3207, Australia
Ruiz de Alarcón 13, 28014 Madrid, Spain
Dock House, The Waterfront, Cape Town 8001, South Africa
© R. de Levie 2004
First published in printed format 2001
ISBN 0-511-04037-7 eBook (netLibrary)
ISBN 0-521-64282-5 hardback
ISBN 0-521-64484-4 paperback
contents
Preface
[xi]
part i introduction to using the spreadsheet
1 How to use Excel [1]
1.1 Starting Windows
[2]
1.2 A first look at the spreadsheet
[3]
1.3 A simple spreadsheet and graph
[7]
1.3a Making a graph in Excel 97 or a more recent version
1.3b Making a graph in Excel 5 or Excel 95
1.4 Addressing a spreadsheet cell
1.5 More on graphs
[13]
[15]
1.6 Mathematical operations
1.7 Error messages
[21]
[26]
1.8 Naming and annotating cells
1.9 Viewing the spreadsheet
1.10 Printing
1.11 Help!
[9]
[11]
[27]
[28]
[29]
[30]
1.12 The case of the changing options
1.13 Importing macros and data
[31]
[32]
1.14 Differences between the various versions of Excel
1.15 Some often-used spreadsheet commands
1.16 Changing the default settings
1.17 Summary
[33]
[35]
[36]
[37]
part ii statistics and related methods
2 Introduction to statistics [39]
2.1 Gaussian statistics
[39]
2.2 Replicate measurements
[45]
v
vi
Contents
2.3 The propagation of imprecision from a single parameter
[51]
2.4 The propagation of imprecision from multiple parameters
2.5 The weighted average
[58]
2.6 Least-squares fitting to a proportionality
[60]
2.7 Least-squares fitting to a general straight line
2.8 Looking at the data
2.9 What is ‘normal’?
[66]
[71]
[73]
2.10 Poissonian statistics
[78]
2.11 How likely is the improbable?
2.12 Summary
[54]
[79]
[83]
3 More on least squares [90]
3.1 Multi-parameter fitting
[90]
3.2 Fitting data to a quadratic
[93]
3.3 Least squares for equidistant data: smoothing and differentiation
3.4 Weighted least squares
[99]
3.5 Another example of weighted least squares: enzyme kinetics
3.6 Non-linear data fitting
3.6a Some kinetic data
[106]
3.6b A double exponential
3.6c False minima
[109]
[115]
3.6d Enzyme kinetics revisited
3.6e SolverAid
3.7 Summary
[103]
[105]
[116]
[117]
[118]
part iii chemical equilibrium
4 Acids, bases, and salts [121]
4.1 The mass action law and its graphical representations
[121]
4.2 Conservation laws, proton balance, and pH calculations
4.3 Titrations of monoprotic acids and bases
4.4 Schwartz and Gran plots
4.5 The first derivative
[133]
[136]
4.6 A more general approach to data fitting
4.7 Buffer action
[130]
[142]
[146]
4.8 Diprotic acids and bases, and their salts
4.9 Polyprotic acids and bases, and their salts
4.10 Activity corrections
[155]
4.11 A practical example
[161]
4.12 Summary
[172]
5 Other ionic equilibria [175]
5.1 Complex formation
[175]
[148]
[152]
[127]
[94]
Contents
vii
5.2 Chelation
[180]
5.3 Extraction
[182]
5.4 Solubility
[185]
5.5 Precipitation and dissolution
5.6 Precipitation titrations
5.7 The von Liebig titration
[190]
[194]
[200]
5.8 The graphical representation of electrochemical equilibria
5.9 Redox titrations
[211]
5.10 Redox buffer action
5.11 Summary
[204]
[217]
[220]
part iv instrumental methods
6 Spectrometry, chromatography, and voltammetry [223]
6.1 Spectrometric pKa determination
[223]
6.2 Multi-component spectrometric analysis 1
[225]
6.3 Multi-component spectrometric analysis 2
[227]
6.4 The absorbance–absorbance diagram
6.5 Chromatographic plate theory 1
[234]
6.6 Chromatographic plate theory 2
[231]
[239]
6.7 Peak area, position, and width
[243]
6.8 Determining the number of theoretical plates
6.9 Optimizing the mobile phase velocity
6.10 Polarography
[248]
[251]
6.11 Linear sweep and cyclic voltammetry 1
[257]
6.12 Linear sweep and cyclic voltammetry 2
[261]
6.13 Summary
[263]
part v mathematical methods
7 Fourier transformation [265]
7.1 Introduction to Fourier transformation
7.2 Interpolation and filtering
7.3 Differentiation
[285]
7.4 Aliasing and leakage
7.5 Convolution
[288]
[295]
7.6 Deconvolution
7.7 Summary
[265]
[277]
[304]
[309]
8 Standard mathematical operations [311]
8.1 The Newton–Raphson method
8.2 Non-linear least squares
8.3 Signal averaging
[314]
[313]
[311]
[245]
viii
Contents
8.4 Lock-in amplification
8.5 Data smoothing
[316]
[318]
8.6 Peak fitting
[324]
8.7 Integration
[328]
8.8 Differentiation
[331]
8.9 Semi-integration and semi-differentiation
8.10 Interpolation
8.11 Matrix manipulation
8.12 Overflow
8.13 Summary
[335]
[336]
[337]
[341]
[343]
9 Numerical simulation of chemical kinetics [345]
9.1 Introduction
[345]
9.2 The explicit method
[346]
9.2a First-order kinetics
[346]
9.2b Numerical accuracy
[348]
9.2c Dimerization kinetics
[350]
9.2d A user-defined function to make the spreadsheet more efficient
9.2e Trimerization kinetics
[353]
9.2f Monomer–dimer kinetics
9.2g Polymerization kinetics
[354]
[355]
9.3 Implicit numerical simulation
9.3a First-order kinetics
[359]
[359]
9.3b Dimerization kinetics
[360]
9.3c Trimerization kinetics
[361]
9.3d Monomer–dimer kinetics
9.3e Polymerization kinetics
9.4 Some applications
[363]
[365]
9.4a Autocatalysis
[362]
[365]
9.4b Heterogeneous catalysis
[367]
9.4c The steady-state approximation
[369]
9.4d Oscillating reactions: the Lotka model
9.5 Summary
[372]
[374]
part vi spreadsheet programming
10 Some useful macros [375]
10.1 What is a macro?
[375]
10.1a The macro module
[376]
10.1b Reading and modifying the contents of a single cell
[378]
10.1c Reading and modifying the contents of a block of cells
[382]
10.1d Two different approaches to modifying a block of cells
[384]
10.1e Numerical precision
[387]
[351]
Contents
ix
10.1f Communication via boxes
10.1g Subroutines
[389]
[393]
10.2 A case study: interpolating in a set of equidistant data
10.2a Step-by-step
[395]
[396]
10.2b The finished product
[401]
10.3 Propagation of imprecision
[405]
10.4 Installing and customizing a macro
10.4a Installing external macros
10.4b Assigning a shortcut key
10.4c Embedding in a menu
10.4d Miscellany
[410]
[410]
[411]
[412]
[414]
10.5 Fourier transformation
[415]
10.5a Forward Fourier transformation
10.5b Descriptive notes
[416]
[420]
10.5c A bidirectional Fourier transformation macro
10.6 Convolution and deconvolution
10.7 Weighted least squares
10.7a The algorithm
[432]
10.7b Implementation
10.8 More about Solver
[426]
[432]
[433]
[442]
10.8a Adding uncertainty estimates to Solver
10.8b Incorporating Solver into your macro
[442]
[448]
10.9 Smoothing and differentiating equidistant data
10.10 Semi-integration and semi-differentiation
10.11 Reducing data density
10.12 An overview of VBA
10.12a Objects
[463]
[466]
[467]
10.12b Properties and methods
10.12c
Data types
10.12d Expressions
[469]
10.12e Statements
10.12f
[470]
Active regions
10.12g Cells
[470]
[471]
10.12h Ranges
[472]
10.12i
Subroutines
10.12j
Macros
[473]
[474]
10.12k Functions
10.12l
[467]
[468]
[474]
Message boxes
10.12m Input boxes
10.12n Dialog boxes
[475]
[475]
[476]
10.12o Collective statements
10.12p For…Next loops
10.12q Do loops
[478]
[477]
[476]
[449]
[460]
[421]
x
Contents
10.12r
Conditional statements
10.12s
Exit statements
10.13 Summary
Index
[481]
[484]
[480]
[479]
PREFACE
Chemistry is an experimental science, and primarily lives in the laboratory. No book on
spreadsheets will change that. However, many aspects of chemical analysis have significant
quantitative, mathematical components, and many of these can be illustrated effectively
using spreadsheets. At the same time, the spreadsheet is a very accessible tool for data analysis, an activity common to all of the physical sciences. This book emphasizes the use of
spreadsheets in data analysis, while at the same time illustrating some of the underlying
principles. The basic strength of spreadsheets was summarized by the name of the very first
spreadsheet, VisiCalc, in that it facilitates the visualization of calculations, and thereby can
help to make theory and data analysis come to life.
Spreadsheets are well-recognized for their near-immediate response to changes in their
input parameters, for their ease in making graphs, for their open format and intuitive layout, and for their forgiving error-handling. For these reasons they are usually considered to
be the most easily learned computer tools for numerical data analysis. Moreover, they are
widely available, as they are often bundled with standard word processors.
Spreadsheets used to be far inferior to the so-called higher-level computer languages in
terms of the mathematical manipulations they would support. In particular, numerical
methods requiring iterations used to be awkward on a spreadsheet. Fortunately, this has
changed with the introduction, in version 5 of Excel, of a macro language (Visual BASIC for
Applications, or VBA) that allows the inclusion of standard computer code. Now the immediacy of the spreadsheet and the convenience of its graphical representations can be combined with the wide availability in the literature of sophisticated higher-level programs to
make the spreadsheet a powerful scientific as well as didactic tool.
Of course, spreadsheets cannot do everything. While they make quite competent graphs,
they lack some of the stunning three-dimensional representations of more specialized,
graphics-oriented packages. Moreover, spreadsheets cannot handle symbolic mathematics,
and they are unsuitable for highly specialized, computation-intensive tasks such as molecular modeling. However, they are unmatched for ease of learning, and for general availability
and price.
Spreadsheets can be used as glorified calculators. There is nothing wrong with that, but
there is no need to write about such rather obvious applications here, since there are already
xi
xii
Preface
a sufficient number of books devoted to this topic. Instead I have tried to illustrate some of
the more subtle aspects of data analysis, some of the more specialized features of chemical
equilibrium, some of the more abstract underpinnings of modern chemical instrumentation, and some of the finer points of numerical simulation. The choice and sequence of
topics closely follows the order in which these are typically encountered in textbooks in analytical chemistry, so that this book can readily be used in courses in quantitative or instrumental chemical analysis. Since the choice of topics is rather wide, the reader is welcome to
pick and choose from among these according to his or her own preference and need.
Most chapters start with a brief summary of the theory in order to put the spreadsheet
exercises in perspective, and to define the nomenclature used. The standard versions of
Excel 95 through Excel 2000 for Windows 95 or Windows 98 are used. Many exercises use the
Solver and the Analysis ToolPak, both of which are available in the standard Excel packages
but may have to be loaded separately, as add-ins, in case this was not done initially. When
use of chapter 10 is contemplated, the VBA help file should also be loaded.
While the specific spreadsheet instructions in this book are for Excel 97 on IBM-compatible computers, they can all be implemented readily (i.e., with no or very minor modifications) in Excel 5 (for Windows 3.1), Excel 95 (for Windows 95), Excel 98 (for the Mac), or Excel
2000 (for Windows 98 or Windows 2000). Moreover, I have indicated where Excel 5 and Excel
95 require different procedures from those in Excel 97, 98, or 2000, namely in their handling
of graphs and macros. There are some minor differences between the Excel versions for
IBM-compatible and MacIntosh computers. The most important of these are listed in
chapter 1; none of them are serious.
Many exercises also work in the earlier versions (1 through 4) of Excel. However, these
earlier versions cannot handle VBA macros, so that those spreadsheet exercises that use
macros for weighted least squares, fast Fourier transformation, and convolution, cannot be
run with versions preceding Excel 5. (Specifically, these are exercises 3.4 and beyond in
chapter 3, and all exercises in chapter 7.) Moreover, the macros described in chapter 10
cannot be used in these earlier versions.
Many of the exercises in this book can also be run on spreadsheets other than Excel. In
that case, however, apart from the impossibility to import higher-level computer programs
into the spreadsheet, the user may also lack the convenience of a powerful multi-parameter
non-linear least squares routine such as Solver. Given the choice of writing a book to fit all
spreadsheets, or one that exploits the extra power of modern Excel, I have opted for the
latter.
The purpose of this book is not to provide its readers with a set of prepackaged routines,
into which they merely enter some constants. Instead, the emphasis is on letting the readers
gain enough familiarity and experience to enable them to use spreadsheets independently,
and in other scientific contexts, while at the same time illustrating a number of interesting
features of analytical chemistry. In most cases, no theory is derived, and the reader should
consult standard texts on statistics and on quantitative and instrumental chemical analysis
for the necessary background information, as well as for a perspective on the strengths and
weaknesses of the various methods.
The reader may discover some unavoidable parallelism between the material in this book
and that in my undergraduate textbook, Principles of Quantitative Chemical Analysis,
Preface
xiii
McGraw-Hill, 1997, and even some remnants of my Spreadsheet Workbook for Quantitative
Chemical Analysis, McGraw-Hill, 1992. This is partially because I have retained some of the
didactic innovations introduced in these earlier texts, such as an emphasis on the progress
of a titration rather than on the traditional titration curve, the use of buffer strength rather
than buffer value, and the use of the abbreviations h and k in the description of electrochemical equilibria. However, the present text exploits the power of Excel to go far beyond what
was possible in those earlier books.
For a few problems that would require the reader to write some rather complex macros,
these have been provided. They are fully documented and explained in chapter 10, and can
be downloaded from Note that
their code is readily accessible, and that the reader is not only encouraged to modify them,
but is given the tools to do so. Again, the idea is to empower the reader to incorporate existing higher-language code into macros, in order to increase the reach and usefulness of Excel.
The first chapter introduces the reader to the software; it can be speed-read or skipped by
those already familiar with Windows- or Mac-based spreadsheets. The last chapter discusses macros, which can convert a spreadsheet into a powerful computing tool.
Sandwiched between these are the four main parts of this book: statistics and related
methods, chemical equilibrium, instrumental methods, and mathematical analysis. These
parts can be used independently, although some aspects introduced in chapters 2 and 3 are
used in subsequent chapters, and the spreadsheet instructions tend to become somewhat
less detailed as the text progresses.
The treatment of statistics is focused on explicit applications of both linear and nonlinear least-squares methods, rather than on the alphabet soup (F, Q, R, T, etc.) of available
tests. However, within that rather narrow framework, many practical aspects of error analysis and curve fitting are considered. They are chosen to illustrate the now almost two centuries old dictum of de Laplace that the theory of probability is merely common sense
confirmed by calculation.
Since the spreadsheet is eminently capable of doing tedious numerical work, exact mathematical expressions are used as much as possible in the examples involving chemical equilibria. Similarly, the treatment of titrations emphasizes the use of exact mathematical
relations, which can then be fitted to experimental data. In some of the exercises, the
student first computes, say, a make-believe titration curve, complete with simulated noise,
and is then asked to extract from that curve the relevant parameters. The make-believe
curve is clearly a stand-in for using experimental data, which can be subjected to the very
same analysis.
For the more instrumental methods of quantitative chemical analysis, I have taken a
rather eclectic approach, merely illustrating some aspects that are especially suitable for
spreadsheet exploration, such as Beer’s law and its applications to the analysis of multicomponent mixtures, chromatographic plate theory, polarography, and cyclic voltammetry.
Because of its important place in modern chemical instrumentation, an entire chapter is
devoted to Fourier transformation and its applications, including convolution and deconvolution. The chapter on mathematical analysis illustrates several aspects of signal handling
traditionally included in courses in instrumental analysis, such as signal averaging and
synchronous detection, that deal with the relation between signal and noise. Its main focus,
xiv
Preface
however, is on numerical analysis, and it covers such aspects as finding roots and fitting
curves, integrating, differentiating, smoothing, and interpolating data. Numerical solution
of differential equations is the focus of chapter 9, where we discuss a number of kinetic
schemes, partially to counterbalance the earlier emphasis on equilibrium behavior.
The final chapter describes the nitty-gritty of macros, and illustrates how they can be used
to make the spreadsheet do many amazing things in exchange for relatively little effort on
the part of the user, who can simply incorporate pre-existing, well-documented, widely
available algorithms.
The aim of this book, then, is to illustrate numerical applications rather than to explain
fundamental concepts. Theory is mentioned only insofar as it is needed to define the
nomenclature used, or to explain the approach taken. This book can therefore be used in
conjunction with a regular textbook in analytical chemistry, in courses on quantitative or
instrumental chemical analysis. It can also serve as a stand-alone introduction to modern
spreadsheet use for students of chemistry and related scientific disciplines, provided they
are already familiar with some of the underlying scientific concepts. Because of its emphasis
on exercises, this book is also suitable for individual, home use.
I am grateful to Drs. T. Moisio and M. Heikonen of Valio Ltd, Helsinki, for permission to use
their unpublished experimental data in chapter 4, to Professor Phillip Barak of the
University of Minnesota for permission to include his adaptive-degree least-squares algorithm in chapter 10, and to Numerical Recipes Software of Cambridge Massachusetts for
permission to use some subroutines from the Numerical Recipes.
I am indebted to Professors Nancy Gordon and Gale Rhodes of the University of Southern
Maine, Professor Barry Lavine of Clarkson University, Professors Panos Nikitas and Nanna
Papa-Louisi of Aristotle University, as well as to Mr. William H. Craig and Professors Andrew
Vogt, George Benke, and Daniel E. Martire of Georgetown University, for their many helpful
and constructive comments and suggestions. I am especially indebted to Professor Joseph T.
Maloy of Seton Hall University for his extensive advice.
I am grateful to Georgetown University for a sabbatical leave of absence, which gave me
the unbroken time to work on this book, and to Professor Nancy Gordon of the University of
Southern Maine in Portland, Maine, and Professor Panos Nikitas of Aristotle University of
Thessaloniki, Greece, for their gracious hospitality during the writing of it. Finally I thank my
son, Mark, for his invaluable help in getting me started on this project, and my wife, Jolanda,
for letting me finish it.
User comments, including corrections of errors, and suggestions for additional topics
and/or exercises, are most welcome. I can be reached at @ .
Corrections will be posted in the web site
delevie
From this web site you can also download the data set used in section 4.11, and the macros
of chapter 10.
part i: introduction to using the spreadsheet
chapter
1
how to use excel
First things first: this introductory chapter is intended for readers who have
no prior experience with Excel, and only provides the minimum information necessary to use the rest of this book. Emphatically, this chapter is not
meant to replace a spreadsheet manual; if it were, that part alone would
occupy more space than that of this entire workbook. Instead, during and
after using this workbook, you may be tempted to consult an Excel manual
(of which there will be several in your local library and bookstore) to learn
what else it can do for you – but that is up to you.
Second: this book is not intended to be read, but instead to be used while
you sit at the computer keyboard, trying out whatever is described in the
text. Learning to use a spreadsheet is somewhat like learning to swim, to ride
a bicycle, or to paint: you can only learn it by doing it. So set aside a block of
time (one or two hours should do for this chapter, unless you are really new
to computers, in which case you might want to reserve several such sessions
in order to get acquainted), make yourself comfortable, turn on the computer, and try things out as they are described in, say, the first three sections
of this chapter. (If it confuses you on your first try, and there is nobody at
hand to help you along, stop, do something else, and come back to it later, or
the next day, but don’t give up.) Then try the next sections.
In order to run Excel (or any other spreadsheet program), your computer
will need an operating system. Here we will assume that you have Windows
as the operating system on your personal computer, and that you have a
compatible version of Excel. Although there are relatively minor differences
between the various versions of Excel, they fall roughly into three categories.
Excel versions 1 through 4 did not use VBA as their macro language, and the
macros described and used in this book will therefore not run on them. The
second category includes Excel 5 and Excel 95 (also called Excel version 7;
there never was a version 6), which use VBA with readily accessible modules.
Excel 97, Excel 98 (for the Mac), and Excel 2000 make up the third category,
which has macro modules that are hidden from sight. The instructions given
1
How to use Excel
2
in this book are specifically for the second and third categories, starting with
Excel 5. While they were mostly tested in Excel 97, all versions more recent
than Excel 4 will do fine for most of the spreadsheet exercises in this book.
Because Excel is backward compatible, you can run older software in a more
recent version, but not necessarily the other way around.
When you have a Macintosh, your operating system will be different, but
Excel will be very similar. After all, both IBM and Mac versions of Excel were
written by Microsoft. With relatively minor modifications, mostly reflecting
differences between the IBM and Mac keyboards, all exercises in this book
will run on the Mac, provided you have Excel version 5 or later.
In either case, whether you use an IBM-compatible PC or a Macintosh, use
at least Excel version 5, because earlier versions lacked some of the more
useful features of Excel that will be exploited in this book. If you have Excel 4
or earlier, it is time to upgrade.
When you are already familiar with earlier versions of Windows and Excel,
you may want to use this chapter as a refresher, or scan the text quickly and
then go directly to the next chapter. When you are already familiar with
Windows 95 or Windows 98, and with Excel 95 or 97, you may skip this
chapter altogether.
1.1
Starting Windows
Windows is a so-called graphical user interface, in which many programs,
files, and instructions are shown pictorially, and in which many operations
can be performed by ‘pointing and clicking’, an approach pioneered in the
early 1970s by the Xerox Corporation, and long familiar to Macintosh users.
The pointing device is usually a mouse or a trackball; for many instructions,
equivalent typed commands can be used as well. We will use ‘mouse’ as the
generic term for whatever pointing device you may have. There are often
several ways to let the computer know what you want it to do. Here we will
usually emphasize how to do it with the mouse, because most users find that
the easiest.
In what follows we will assume that Windows and Excel have been
installed in their complete, standard forms. For some applications we will
also use the Solver and the Analysis Toolpak. These come with Excel, but
(depending on the initial installation) may have to be loaded as an add-in.
When you start Windows, your monitor will show a screen (the desktop)
which typically displays, on its left side, a number of pictures (icons), each
with its own explanatory label. The bottom icon is labeled ‘Start’, and acts as
the on switch of Windows. (There is no simple off switch, since Windows
requires a more elaborate turn-off routine, which rather illogically begins
with the Start button, and via the Shut Down command leads you to the Shut
Down Windows dialog box, where you can choose between several options.)
1.2 A first look at the spreadsheet
3
Icons, such as the start label, are also called buttons, as if you could actually push them. Move the mouse so that the sharp point of the arrow on the
screen, the pointer, indeed ‘points to’ (i.e., is inside) the start button, and
press the left mouse button once. (Left and right depend, of course, on the
orientation of the mouse. By ‘left’ we mean the left button when the two or
three mouse buttons are pointing away from you, so that you can hold the
body of the mouse with your thumb and index finger, or with the palm of
your hand, while your index finger, middle finger, and ring finger can play
with the buttons.) To briefly depress the left mouse button we will call to
click the mouse; when you need to do this twice in quick succession we will
call it double clicking, whereas briefly depressing the right mouse button
we will call right clicking.
As soon as you have clicked the start button, a dialog box will pop up
above it, showing you a number of choices. Manipulate the mouse so
that the arrow points to ‘Programs’, which will now be highlighted, and
click. A second dialog box will pop up next to the first to show you the
various programs available. One of these will be Excel; click on it to start
the spreadsheet. Alternatively, click on the Excel icon if the desktop
shows it.
1.2
A first look at the spreadsheet
After displaying the Excel logo, the monitor screen will show you a rather
busy screen, as illustrated in Fig. 1.2-1. The actual screen you will see may
have more bars, or fewer, depending on how the screen has been configured.
Please ignore such details for the moment; few if any of the instructions to
follow will depend on such local variations.
At the top of the screen is the title bar. In its right-hand corner are
three icon buttons, to minimize the screen to near-zero size, to restore it to
medium or full size, and to close it. To the left on the same bar you will find
the Excel logo and the name of the file you use, where ‘file’ is the generic
name for any unit in which you may want to store your work. Below the title
bar is the menu bar (with such menu headings as File, Edit, View, Insert,
etc.). This is usually followed by a standard bar with icons (pictograms
showing an empty sheet, an opening file folder, a diskette, a printer, etc.) and
a formula bar. At this point, the latter will show two windows, of which the
larger one will be empty.
Starting from the bottom of the screen and moving upwards, we usually
first encounter the task bar, which has the Start button in its left corner.
Next to the start button you will find the name of the Workbook you are
using. When you have not yet given it a name, Excel will just call it Book1,
Book2, etc. Above the task bar is the status bar, which may be largely empty
for now.
4
How to use Excel
Fig. 1.2-1: The left top corner of the spreadsheet.
Fig. 1.2-2: The left bottom corner of the spreadsheet.
What we have described so far is the frame around the actual spreadsheet.
Now we come to the spreadsheet itself, which is called a workbook, and is
organized in different pages.
Above the status bar you will find a tab, in Fig. 1.2-2 labeled Sheet1, which
identifies which page of the work book is open. Here, then, you see the
general organization of individual spreadsheet pages into workbooks. You
can have as many pages in your workbook as you wish (by adding or removing sheets), and again as many different workbooks as you desire. For the
exercises in the present text, you may want to use a new sheet for each exercise, and a new workbook for each chapter, and label them accordingly.
In the region between the formula bar and the status bar you will find the
actual working part of the spreadsheet page. It starts at the top with a
sequence of rectangles, each containing one letter of the alphabet on a gray
background. It ends, at the bottom, with a bar containing a series of tabs;
1.2 A first look at the spreadsheet
5
one such tab, such as the one labeled Sheet1 in Fig. 1.2-2, will have a white
background, indicating the currently open (or ‘active’) sheet, while the
others will be gray. In between these is a rectangular array of blank cells.
Each such cell can be identified by its (vertical) column and its (horizontal)
row. Columns are labeled by the letters shown just above row 1 of the
spreadsheet, while rows are labeled by the numbers shown to the left of
column A. The cell at the top left of the spreadsheet is labeled A1, the one
below it A2, the one next to A2 is B2, etc. One cell will be singled out by a
heavy black border; that is the highlighted, active cell in which the spreadsheet anticipates your next action. The address of the active cell is displayed
in the left-most window of the formula bar; in Fig. 1.2-1 it is cell A1.
To activate another cell, move the mouse so that the pointer, which should
now have the shape of a hollow cross, is within that cell, then click. The corresponding cell coordinates will show on the left-most window of the formula
bar. When you move the mouse pointer to another cell and click again, that
cell will now become the active one. Note that the left-most window in the
formula bar will track the coordinates of the active cell. Play with moving the
active cell around in order to get a feel for manipulating the mouse.
A cell can also be specified by typing its coordinates. The simplest way to
do so is by using the function key labeled F5. (The function keys are usually
located above the regular alphabet and number keys, and labeled F1
through F10 or F12. On some keyboards they are found to the left of the
alphabet keys.) A dialog box will appear, and you just type the coordinates of
the cell, say, D11, and deposit this by depressing the large ‘enter’ key (to the
right of the regular alphabet keys). Another way, initially perhaps more convenient for those used to DOS-based spreadsheets, is to use the keystroke
sequence Altϩe Altϩg. Here Altϩe denotes that you depress Alt and then,
while keeping Alt down, also depress e; follow this by Altϩg. Alt specifies that
you want to select an item from the menu bar, e selects the Edit command,
and g the Go to command, where the underlining indicates the letter to be
used: e in Edit, g in Go, o in Format, etc. As a gesture to prior users of Lotus 12-3 or QuattroPro, you can even use the slant instead of the Alternate key: / ϩ
e /ϩg . Any of the above methods will produce the dialog box in which to
type the cell coordinates.
Below we will usually indicate how to accomplish something by using the
mouse. For those more comfortable with using the keyboard rather than the
mouse, keystrokes to accomplish the same goals are often available. There is
no need to memorize these commands: just look for the underlined letters
to find the corresponding letter code. Using keystrokes is often faster than
pointing-and-shooting with a mouse, especially when you use a track ball.
Note that, inside the cell area of the spreadsheet, the mouse pointer
usually shows as a cross. Select a cell, then move the pointer away from it
and back again. You will see that, near the border of the active cell, the
pointer changes its shape and becomes an arrow. When the pointer shows
6
How to use Excel
as an arrow, you can depress the left mouse button and, while keeping it
down, move the pointer in the cell area. You will see that this will drag the cell
by its border. By releasing the mouse button you can deposit the cell in a new
location; the formula bar will then show its new coordinates.
Practice activating a set of neighboring, contiguous cells; such cell blocks
or arrays are often needed in calculations. Move your mouse pointer to a
particular cell, say cell F8, and click to activate it. You can now move
the pointer away, the cell remains active as shown by its heavy border; also,
the formula bar shows it as the active cell regardless of where you move the
mouse pointer, as long as you don’t click. Return the pointer to cell F8, and
depress the left mouse button without releasing it, then (while still keeping
the cell button down) move the mouse pointer away from cell F8 and slowly
move it in a small circle around cell F8. You are now outlining a cell block; its
size is clear from the reverse color used to highlight it (it will show as black
on a white background, except for the cell with which you started, in this
example F8, which will remain white, and which we will call the anchor cell).
The size of the block will show in the formula bar in terms of rows and
columns, e.g., 3R ϫ 2C will denote a block three rows high and two columns
wide. By releasing the mouse button you activate the entire block, while the
formula bar will return to showing the location of the anchor cell. You can
then move away from it; the active block will remain. After you have selected
the cell block, go back to it, grab its border (when the pointer is an arrow)
and move the entire block around! To deposit the block in a new location,
just release the mouse button. To abolish a block, release the mouse button
to deposit it, then move the pointer to another cell and click on it.
To activate a block of cells from the keyboard, use F5 (or Altϩe Altϩg),
then specify the block by the coordinates of its upper left cell and of its lower
right cell, separated by a colon, as in D4:E9, and deposit it with the enter key.
There is yet another way to activate a block, starting from a single active
cell. Again move the mouse pointer outside the active cell, but now
approach the small square in the right bottom corner of the border around
the active cell; this little square is the cell handle. The mouse pointer will
change into a plus sign when it points to the cell handle; you can then drag
the cell by its handle (rather than by its border) and make either columns or
rows. Again, fix your choice by releasing the mouse button. You can drag it
again to make a block out of a row or column. Practice these maneuvers to
familiarize yourself with the mouse, and see how the pointer changes from a
hollow cross (when you point at the middle of the cell ) to an arrow (at its
border) to a plus sign (at its handle). Below we will specifically indicate when
to use the cell border or the cell handle; if nothing is specified, go to the
center of the cell and use its standard pointer, the hollow cross.
1.3 A simple spreadsheet and graph
1.3
7
A simple spreadsheet and graph
The spreadsheet is designed to facilitate making calculations, especially
repeated calculations that would quickly become tedious and boring if you
had to do them by hand, or even on a pocket calculator. (Unlike humans,
computers do not tire of repetition.) The spreadsheet is also very useful
when you have computations that would be too difficult for a pocket calculator. The tabular format, resembling an accountant’s ledger, helps us to
organize the calculations, while the so-called ‘double precision’ of the
spreadsheet keeps round-off errors in check. When you change one number
somewhere in a spreadsheet, the computer automatically recalculates all
cells that depend on the one you have just changed. (There are a few exceptions to this statement: special functions and macros do not update automatically. We will alert you when we come to them.) The spreadsheet also
makes it very easy to construct graphs. We will demonstrate this now that
you know how to move around in the spreadsheet.
Among the things we can place inside a cell are a number, a label such as a
column heading, or a formula. A cell can hold only one of these items at a
time. Activate cell A1 by clicking on it, then type the letter x, followed by
depressing the ‘enter’ key, or by moving the mouse pointer to a different cell
and by then clicking on that other cell. Either method will deposit the typed
letter.
Activate cell A3; to do this, either move the mouse pointer to cell A3 and
click, or use the down arrow to get there. In cell A3 deposit the number 0. (As
with the letter x, nothing will happen until you deposit it, using the Enter
key. This lets the computer know that this is all you want to enter, rather
than, say, 0.3 or 0.0670089.) Be careful to distinguish between the number 0
and the letter O; they are close neighbors on the keyboard but they are completely different symbols to the computer. Similarly, don’t confuse the
number 1, the lowercase letter L, and the capital I.
In cell A4 deposit the number 1. The letter x in A1 will usually show as leftjustified (i.e., placed in the left corner of its cell), whereas the numbers 0 and
1 will usually be right-justified. (We hedge our bets with the ‘will usually be’
because all these features can easily be changed, as they may well have been
on the computer you are using.) Return to cell A3, then activate both cells (by
depressing the left mouse button while pointing to A3, keeping it down
while moving to cell A4, then releasing the button). Both cells should now be
active, as shown by their shared border.
Now comes a neat trick: grab both cells by their common handle (the little
square at the right-hand bottom of their common border), drag the handle
down to cell A11, and release the mouse button. With this simple procedure
you have made a whole column of numbers, each one bigger by 1 than that
in the cell above it!
8
How to use Excel
Fig. 1.3-1: Detail of the spreadsheet with its two columns and column headings.
Had you started with, say, the number 7 in cell A3, and 4.6 in cell A4,
column A would have shown 7, 4.6, 2.2, Ϫ0.2, Ϫ2.6, and so on, each successive cell differing from its predecessor by 4.6 Ϫ7 ϭϪ2.4. In other words, this
method of making a column generates constant increments or decrements,
in arithmetic progression. Try this, with different values in A3 and A4. Then
go back to deposit the series ranging from 0 to 7 with an increment of 1 or, in
mathematical notation, the series 0 (1) 7. Incidentally, there are many other
ways to fill a column, some of which we will encounter later.
In column B we will now calculate a sine wave. Activate cell B1 and deposit
the heading ‘sine’. Move to cell B3 and deposit the formula ϭsin(a3*pi()/4).
The equal sign identifies this as a formula rather than as text; the asterisk
indicates a multiplication. The spreadsheet uses the notation pi() to
denote the value of ; the brackets alert the computer that this is a function. Excel instructions do not distinguish between lower case and capitals,
but the formula bar always displays them as capitals, which are more
clearly legible. By now your spreadsheet should look like that depicted in
Fig. 1.3-1.
If you were to extend the columns to row 11, the value shown in cell B11
might baffle you, since it may not quite be 0 but a small number close to it,
reflecting computer round-off error. But don’t worry: the error will usually
be below 1 part in 1015.
There is a more convenient way to generate the second column. After you
have entered the instruction ϭsin(a3*pi()/4) in cell B3, grab its handle (at
which point the mouse arrow will show as a plus sign) and double-click. This
will copy the instruction down as far as the column to its immediate right
contains data! This is a very useful method, especially for long columns.
1.3 A simple spreadsheet and graph
9
When there are no data to its immediate right, the column to its immediate
left will do. When both are absent, the trick will not work.
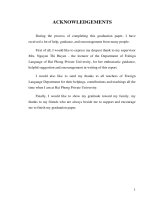
Finally we will make a graph of this sine wave. Doing so is slightly different
in Excel 97, Excel 98 for the Mac, or Excel 2000 on the one hand, and Excel 95
or Excel 5 on the other. We will here describe the procedure for each of these
two versions.
Bring the mouse pointer to cell A3, click on it, drag the pointer (while
keeping the mouse button depressed) to cell B11, then let go of the mouse
button. This will activate (and highlight) the rectangular area from cell A3
through B11 (in spreadsheet parlance: A3:B11) containing the data to be
graphed. Alternatively, you can highlight cell A3, then depress the Shift key,
and while keeping this key down depress End, ↓, End, and finally →. (The
sequence ShiftϩEnd, Shiftϩ↓ will highlight the column A3:A11, while Shift
ϩEnd, Shiftϩ→ will include column B. As with double-clicking on the cell
handle to copy an instruction, ShiftϩEnd looks for contiguous data.)
1.3a Making a graph in Excel 97 or a more recent version
If this is your first reading, and you use Excel 95 or Excel 5, skip the following,
and continue with section 1.3b.
In Excel 97 or a more recent version, go with the mouse pointer to the
menu bar, click on Insert, and in the resulting drop-down submenu click on
Chart. Or achieve the same result with the keystrokes Altϩi, Altϩh. Either
method will produce a dialog box labeled Chart Wizard – Step 1 of 4 – Chart
Type.
In the list of Chart types, click on XY (Scatter); do not select the Line plot,
which in Excel means something quite different from what a scientist might
expect. The line plot can give you very misleading graphs because it presumes that the x-values are always equidistant.
As soon as you have selected the XY plot, the right-hand side of the dialog
box will show five Chart sub-types: loose points, points connected by
smooth or straight lines, or just smooth or straight lines. For now, pick the
points connected by smooth lines – you can always change it later. (This is a
general property of working with Windows Excel: you need not agonize over
a choice, because there are almost always opportunities to change it later. So
the best strategy is: when in doubt, pick something, move on, and worry
about the details later.) Click on the Next Ͼbutton.
Step 2 of the Chart Wizard shows the Data range selected. Also, under the
Series tab, it shows which column will be used for X-values, and which for Yvalues. The default (i.e., the assumption the spreadsheet makes in case you
do not overrule it) is to use the left-most column of the selected block for Xvalues, so you need not take any action here, just press on with Next Ͼ. But it
is handy to know that you can here, in step 2 of the Chart Wizard, change the
assignments for X and Y.
10
How to use Excel
Step 3 lets you enter a Chart title and axes labels. Click on the Chart title
window, and enter Sine wave. Then click in the Value (X) Axis window, and
enter angle. Finally, click in the Value (Y) Axis window, and enter sine. A
picture will show you what your graph is going to look like.
There are other things you can specify at this point, such as the axes, gridlines, legends, and data labels, but we will forgo them here in order to keep
things simple for now, and to illustrate later how to modify the end product.
So, on to the Next Ͼ.
Step 4 defines the chart location, either As a new sheet, or As object in a
spreadsheet page. Select the latter, and Finish. This will place the graph on
the spreadsheet.
Now click on the graph, preferably inside its outer frame near its left edge,
where the computer cannot misinterpret your command. This will adorn
the graph with eight black handles, which allow you to change its size and
location. First, locate the mouse pointer on the graph, depress the mouse
button, and while keeping it down move the graph to any place you like on
the spreadsheet, preferably somewhere where it does not block data from
view. To release, simply release the mouse button. Note that the graph as it
were floats on the page, and does not obliterate the underlying information.
To fit the graph in the cell grid, depress the Alt key, then (while keeping Alt
depressed) bring the mouse pointer to a handle in the middle of the side of
the graph, where the pointer should change into a two-sided arrow, and pull
that pointer toward a cell boundary. Repeat with the other sides. For greater
efficiency you can combine this for two adjacent sides by pulling or pushing
on two opposing corners.
In the final result, click on the little rectangular box to the right of the
graph, then press Delete.
If you want to remove the gray background (which seldom prints well) just
click somewhere in the plot area (where the label shows Plot Area), rightclick, highlight Format Plot Area, and under Area either select None or, in the
choice of colors, click on white. Exit with OK.
If you want to get rid of the horizontal grid lines, point to them (the label
will identify Value (Y) Axis Major Gridlines), right-click, and select Clear.
To change the range of the x-scale, point to the axis (the label will show
Value (X) Axis), right-click, select Format Axis, and under the Scale tab pick
the scale properties you want. And, while you’re at it, please note that you
can also change the font, size, color, position, and alignment of the numbers
of the x-axis. Ditto for the numbers on the vertical axis.
To change the type of graph itself, point at the curve, right-click, and select
Format Data Series. Then for the Line pick the Style, Color, and Weight you
like, and for Marker the Style, Forground and Background color, and Size.
And so it goes: you can point at virtually every detail of the graph, and
modify it to your taste. Figure 1.3-2 shows you what you might have wrought.
1.3 A simple spreadsheet and graph
11
Sine wave
1.5
1.0
sine
0.5
0.0
-0.5
0
1
2
3
4
5
6
7
8
-1.0
-1.5
angle
Fig. 1.3-2: The graph showing your sine wave.
1.3b Making a graph in Excel 5 or Excel 95
If this is your first reading, and you use Excel 97, Excel 98, or Excel 2000, skip to
the last two paragraphs of this section.
Go with the mouse pointer to the menu bar, click on Insert, and in the
resulting drop-down submenu click on Chart. A second box will appear,
which lets you select a graph either On the spreadsheet, or As a separate
sheet. Select the former by clicking on it. You will now see a succession of
ChartWizard boxes that let you specify how the graph should look. You can
achieve the same result with the keystrokes Altϩi, Altϩh, Altϩo, Enter, with
i for Insert, h for Chart, etc. Either method will produce a dialog box labeled
Chart Wizard.
The first ChartWizard box, labeled Step 1 of 5, asks you what area of the
spreadsheet you want to be graphed. Since you already selected that area,
the window with the heading Range should show ϭ$A$3:$B$11. If it does,
move the pointer to the Next Ͼbutton, and click. If it does not, first move the
pointer to the Range window, click, if necessary replace its present contents
by A3:B11 (use the Delete key located to the right of the enter key, type
A3:B11, and click again to deposit this), then click on the Next Ͼbutton and
proceed to step 2.
The second ChartWizard box lets you specify the type of graph you want.
Click on the XY (Scatter) plot; your choice will be highlighted. (Do not select
the Line plot, because it will automatically assume that all X-values are
equidistant. This is convenient when you want to plot, e.g., income or
expense as a function of the month of the year, or the region of the country.
In scientific applications, however, it makes no sense to treat the X-values
merely as labels, and it can yield quite misleading graphs.) Click on Next Ͼto
move to the next ChartWizard.