Báo cáo khoa học: Purple membrane lipid control of bacteriorhodopsin conformational flexibility and photocycle activity An infrared spectroscopic study docx
Bạn đang xem bản rút gọn của tài liệu. Xem và tải ngay bản đầy đủ của tài liệu tại đây (274.01 KB, 6 trang )
Purple membrane lipid control of bacteriorhodopsin conformational
flexibility and photocycle activity
An infrared spectroscopic study
Richard W. Hendler
1
, Steven M. Barnett
2
, Swetlana Dracheva
1
, Salil Bose
1
and Ira W. Levin
2
1
Laboratory of Cell Biology, National Heart, Lung, and Blood Institute and
2
Laboratory of Chemical Physics,
National Institute of Diabetes and Digestive and Kidney Diseases, National Institutes of Health, Bethesda,
MD 20892-0510, USA
Specific lipids of the purple membrane of Halobacteria are
required for normal bacteriorhodopsin structure, function,
and photocycle kinetics [Hendler, R.W. & Dracheva, S.
(2001) Biochemistry (Moscow) 66, 1623–1627]. The decay
of the M-fast intermediate through a path including the O
intermediate requires the presence of a hydrophobic envi-
ronment near four charged aspartic acid residues within the
cytoplasmic loop region of the protein (R. W. Hendler &
S. Bose, unpublished results). On the basis of the unique
ability of squalene, the most hydrophobic purple membrane
lipid, to induce recovery of M-fast activity in Triton-treated
purple membrane, we proposed that this uncharged lipid
modulates an electrostatic repulsion between the membrane
surface of the inner trimer space and the nearby charged
aspartic acids of the cytoplasmic loop region to promote
transmembrane a-helical mobility with a concomitant
increase in the speed of the photocycle. We examined Triton-
treated purple membranes in various stages of reconstitution
with native lipid suspensions using infrared spectroscopic
techniques. We demonstrate a correlation between the
vibrational half-width parameter of the protein a-helical
amide I mode at 1660 cm
)1
, reflecting the motional char-
acteristics of the transmembrane helices, and the lipid-
induced recovery of native bacteriorhodopsin properties in
terms of the visible absorbance maxima of ground state
bacteriorhodopsin and the mean decay times of the photo-
cycle M-state intermediates.
Keywords: enzyme control; kinetics; lipid–protein inter-
actions; membrane protein structure.
Previous studies, summarized in [1], demonstrate the
importance of specific membrane lipids and amino-acid
residues in the cytoplasmic loop regions of bacteriorhodo-
psin for the normal operation of the bacteriorhodopsin
photocyle. Specifically, the extensive damage to the normal
photocycle caused by brief exposure of purple membrane to
dilute Triton X-100 is repaired completely by the addition of
squalene and phosphatidylglycerophosphate methyl ester
lipids extracted from purple membrane [2]. This reconstitu-
tion requires charge-screening by either high-salt concen-
trations or titration of a group with an apparent pK of 5
[3,4]. Although phosphatidylglycerophosphate methyl ester
alone completely restores the M-slow (M
s
) fi BR photo-
cycle pathway, squalene is required to re-establish the
M-fast (M
f
) fi O fi BR pathway [2,5]. The pK 5
titration implicates the involvement of peripheral acidic
amino acids of bacteriorhodopsin near the membrane
surface, namely, Asp36, Asp38, Asp102, and Asp104 within
the cytoplasmic loop region (R. W. Hendler & S. Bose,
unpublished work). These observations indicate that M
f
activity requires the site of the trimers to be in a membrane
region containing squalene, the most hydrophobic lipid in
the purple membrane, in close proximity to the four
aspartates. However, trimers located in a membrane region
containing polar lipid in the absence of squalene produce
M
s
activity. This heterogeneous distribution of lipids within
the membrane results in the formation of microdomains. As
the only difference between M
f
-andM
s
-eliciting trimers is
the presence of a hydrophobic environment for the charged
acidic amino acids, M
s
photocycles can be converted into
M
f
photocycles by providing a hydrophobic environment
(R. W. Hendler & S. Bose, unpublished results).
On the basis of the above considerations, we proposed a
mechanism for the control of bacteriorhodopsin photo-
cycles through interactions involving squalene, charged
lipids, and the four acidic amino acids in the cytoplasmic
loop region (R. W. Hendler & S. Bose, unpublished results).
Thus, in the absence of squalene, electrostatic repulsive
forces at the negatively charged membrane surface under
the loop region containing the charged acidic amino acids
should produce a strain limiting the mobility of both the
amino-acid-containing loops and the attached transmem-
brane a-helices. These interactions would then lead to the
Correspondence to I. W. Levin, Laboratory of Chemical Physics,
National Institute of Diabetes and Digestive and Kidney Diseases,
National Institutes of Health, Bethesda, MD 20892-0510, USA or
R. W. Hendler, Laboratory of Cell Biology, National Heart, Lung,
and Blood Institute.
Abbreviations: BR, ground state of bacteriorhodopsin; M
f
, M-fast
intermediate which decays through the O intermediate; M
s
, M-slow
intermediate which decays directly to bacteriorhodopsin.
(Received 13 September 2002, revised 20 January 2003,
accepted 22 January 2003)
Eur. J. Biochem. 270, 1920–1925 (2003) Ó FEBS 2003 doi:10.1046/j.1432-1033.2003.03547.x
slower kinetic forms characteristic of the M state turnover.
To examine further these relationships, we investigated the
effects of purple membrane lipids on both the M turnover
time constants and the flexibility of the bacteriorhodopsin
transmembrane a-helices.
Materials and methods
Purple membranes were extracted from the ET1001 strain
of Halobacterium salinarum as described previously [3].
Then 200 lL 1% Triton X-100 was added to a mixture of
100 lL purple membranes (5 mg bacteriorhodopsin per mL
suspension) and 1700 lL50m
M
potassium phosphate
(pH 7.2). The suspension was immediately centrifuged at
4 °C in a Beckman TL-100 centrifuge at 200 000 g (Triton
exposure time 7 min), and the pellet was washed three
times by resuspension in 3 mL water and centrifugation.
Purple membrane lipids were extracted as described previ-
ously [6,7] and resuspended to a stock concentration of
4mgÆmL
)1
. Reconstitution with lipid was performed by
mixing 10 mol of previously extracted native purple mem-
brane lipid per mol bacteriorhodopsin in the presence of
0–4
M
NaCl [3]. This is the lipid concentration present in
native purple membrane. As described previously [3], salt
was removed from the reconstituted preparation by succes-
sive centrifugations in dilute buffer. Determinations of the
wavelength of maximum absorbance were performed on a
Cary 14DS spectrophotometer. Kinetic bacteriorhodopsin
photocycle data, after an actinic light flash, were obtained
and analyzed as previously described [8,9].
Infrared spectroscopic measurements were obtained
throughfilmscastat35°ContoaBaF
2
window from
75 lL purple membrane suspension (5 mgÆmL
)1
). Meas-
urements were performed at 0.5 cm
)1
resolution on a
Bomem DA3 spectrometer equipped with a mercury
cadmium telluride detector under either vacuum or a
nitrogen purge; spectra were similar for both instrumental
conditions. Neutron scattering studies have demonstrated
that the average mean square displacements of molecular
vibrational modes in partially dried purple membrane films
are unchanged from fully hydrated systems [10]. Direct
measurements [11] for the number of water molecules per
bacteriorhodopsin molecule in our preparations yielded
values close to 300, which is close to the value of 340
determined by neutron diffraction analysis [10]. While other
low-frequency, anharmonic large-amplitude membrane
motions have been observed to precede the protein
conformational changes during the photocycle [12], the
behavior of various internal modes, such as the amide I and
amide II vibrations, provides a direct indication of the
dynamic properties of the transmembrane a-helices within
the bilayer assembly, as we have observed in variable-
temperature infrared-spectroscopic studies (unpublished
work). Vibrational spectroscopic bandwidths are functions
of dynamic parameters derived from intermolecular and
intramolecular motions. Band shapes are often analyzed in
the context of statistical mechanical theories of irreversible
processes. Interactive forces between the system and its
surrounding medium influence the vibrational relaxations of
the molecular assemblies under consideration. The duration
of the re-equilibration processes that define the lifetimes of
the upper or excited vibrational levels leads to increments in
the observed bandwidths. When molecules absorb radi-
ation, band broadening occurs from the small differences in
the environment that the molecular assembly encounters as
a consequence of its mobility; that is, the system experiences
inhomogeneous broadening effects. Additional discussion
of band profiles and reorientation effects can be found in
references [13–15].
Spectral curve-fitting procedures
Subtle protein motional changes, reflected specifically by
perturbations in the amide I spectral region, are most easily
and systematically monitored through curve-fitting methods
applied to the 1720–1480 cm
)1
spectral interval, the region
comprised primarily of the protein amide I and II vibrational
modes. Curve fitting of the infrared spectra of perturbed
purple membrane assemblies was performed with a Bomem
Grams/386. Briefly, the amide I and II envelope of the
infrared spectrum of purple membrane assemblies was
represented by seven curves initially located at 1660 cm
)1
(representing the amide I modes of the a-helices), 1680 cm
)1
(the amide I of b-turn structures), 1640 cm
)1
(the amide I of
random coil and b-sheet structures), 1545 cm
)1
(the amide II
of a-helical A mode), and 1520 cm
)1
(the amide II of a-
helical E
1
mode), with two smaller features at 1620 and
1585 cm
)1
. For all spectra fitted in this manner, the
correlation coefficient was greater than 0.99, with the
residuals being equivalent to the noise, indicating that these
seven curves provide an excellent approximation to the data.
Results
Effect of NaCl concentration on the reconstitution
of native purple membranes
The extent of normal bacteriorhodopsin photocycle activity,
generated in Triton-treated purple membranes by reconsti-
tution with native phytanyl chain lipids, is dependent on
NaCl concentration [3]. As infrared spectroscopy provides
an effective approach for detailing changes in integral
membrane protein structure [16,17] in both native and
perturbed purple membrane systems [18], we examined the
vibrational spectra of Triton-treated purple membranes
reconstituted in various concentrations of NaCl (0–4
M
)to
elucidate more specifically the protein structural changes
that correlate with the recovery of native bacteriorhodopsin
photocycle activity.
The effect of NaCl concentration on structural reorgani-
zations in the bacteriorhodopsin protein on reconstitution
of Triton-treated purple membrane with native lipids was
monitored through changes in infrared spectra in the
amide I and II regions at 1660 cm
)1
and 1545 cm
)1
,
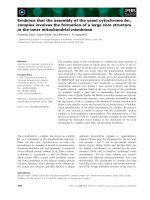
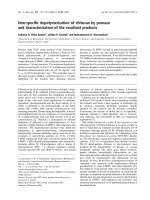
respectively. Figure 1 displays the infrared spectra from
1710 to 1490 cm
)1
(normalized to the intensity of the
amide I mode at 1660 cm
)1
) of native purple membrane
(solid line), purple membrane after mild exposure to Triton
(0.1% Triton, 7 min; dashed line), and Triton-treated
purple membrane reconstituted in the absence of NaCl
(dotted line) and with 2
M
NaCl in phosphate buffer (dash-
dot line). The decrease in half-width of the amide I mode at
1660 cm
)1
after exposure to Triton suggests decreased
a-helical conformational flexibility (bacteriorhodopsin is
Ó FEBS 2003 Control of bacteriorhodopsin conformational flexibility and photocycle activity (Eur. J. Biochem. 270)1921
composed of 65% a-helical structure [18]); that is, the
amide I mode monitors primarily the dynamics of the
protein’s transmembrane segments in contrast with the loop
regions. Increases in the width of the amide I mode are
observed in variable-temperature infrared spectroscopic
studies of the purple membrane system (unpublished
observations). In these studies, however, a decrease in peak
width of the amide I vibrational mode is accompanied by a
decrease in the intensity and bandwidth of the amide II
mode on the release of retinal induced by either heat or light
(S. Barnett & I. W. Levin, unpublished work). These small
decreases in the amide I and amide II peak parameters were
observed in the present study and in previous communica-
tions [19,20] on lipid reconstitution in the absence of NaCl
(Fig. 1, dotted line). Recovery of these parameters to levels
near those observed in native purple membrane are now
observed on reconstitution in 2
M
NaCl (Fig. 1, dash-dot
line).
Examination of the lineshape features of an infrared-
active spectroscopic feature, such as the peak heights and
bandwidths, provides insights into the molecular dynamics
of the ensemble [21]. In particular, to define more explicitly
the structural alterations in bacteriorhodopsin after expo-
sure to Triton and subsequent lipid reconstitution, the
amide I and II regions of the infrared spectra in both the
native and perturbed purple membrane systems were fitted
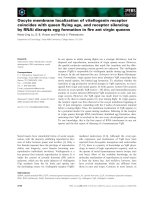
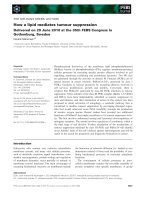
to seven mixed Gaussian–Lorentian functions. Figure 2
displays the infrared spectrum of native purple membrane
from 1720 to 1480 cm
)1
(top curve) fitted to the seven
deconvoluted curves. The amide I region is composed of a
predominant feature centered at 1660.3 cm
)1
with a half-
width (Dm
1/2
)of30.9±0.5cm
)1
(mean ± SEM from at
least eight independent measurements used on all native and
treated purple membrane preparations), assigned to the
a-helices of bacteriorhodopsin, as well as, in part, curves
typical of b-turn (1685 cm
)1
) and either random coil or
b-sheet (1638 cm
)1
) structures. The frequencies and relative
intensities of the spectroscopic features that comprise the
amide I region predict that bacteriorhodopsin is composed
of 65% a-helical structure, in agreement with previous
infrared spectroscopic studies of bacteriorhodopsin secon-
dary structure [18]; the curves displayed in Fig. 2 represent
the only combination that provided an a-helical composi-
tion of greater than 50%. Table 1 lists the deconvoluted full
width at half heights of the a-helical amide I mode at
Fig. 1. Infrared spectra from 1710 to
1490 cm
-1
of native purple membrane (solid
line), purple membrane exposed briefly to
Triton (dashed line), and purple membrane
reconstituted with purple membrane lipids in
solutions without NaCl (dotted line) and with
2
M
(dot-dash line) NaCl.
Fig. 2. Infrared spectrum of native purple membrane from 1720 to
1480 cm
-1
(top curve) and the seven mixed Gaussian–Lorentzian curves
used to fit this spectral region.
Table 1. Full width at half height of the a-helical amide I modes at
1660 cm
-1
(Dm
1/2
; obtained from deconvoluted spectra; ± 0.5 cm
-1
)for
different lipid conditions.
Conditions Dm
1/2
(cm
)1
)
Native 30.9
Triton-exposed 28.5
Reconstituted in absence of NaCl 29.0
Reconstituted in 1
M
NaCl 30.4
Reconstituted in 2
M
NaCl 31.0
Reconstituted in 4
M
NaCl 31.2
1922 R. W. Hendler et al.(Eur. J. Biochem. 270) Ó FEBS 2003
1660 cm
)1
(Dm
1/2
) for all samples in this study. We
emphasize the use of this parameter as a measure of
bacteriorhodopsin a-helical conformational flexibility,
because the 1660 cm
)1
feature arises predominantly from
a-helical structures [18].
The experimentally observed half-width of the entire
envelope comprising the amide I modes in the infrared
spectra of the purple membrane decreases 9% (from 48.4
to 44 cm
)1
) on brief exposure to Triton [19]. The curve-
fitting procedure used here permits a more accurate
evaluation of the specific structural elements affected by
Triton exposure. A decrease in intensity of the features
corresponding to the b-turn (1685 cm
)1
) and random coil/
b-sheet (1638 cm
)1
)structuresisaccompaniedbyan8%
decrease in Dm
1/2
(from 30.9 to 28.5 cm
)1
;±0.5cm
)1
)on
exposure to Triton. The recovery of Dm
1/2
to values observed
in native purple membrane on lipid reconstitution into
Triton-treated purple membrane occurs as a function of
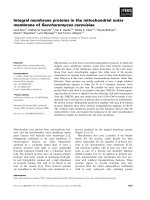
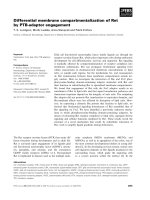
NaCl concentration used during the procedure. Figure 3
displays a plot of Dm
1/2
as a function of the NaCl
concentrations used for reconstitution. Reconstitution of
Triton-exposed membranes with purple membrane lipids
shows a strong dependence on the concentration of NaCl
such that, at the highest concentration, the half-width
parameter was restored to a value close to that found in
native purple membranes, accompanied by a recovery in the
b-turn and random coil/b-sheet regions. The observed
decrease in Dm
1/2
on exposure to Triton [19], and its recovery
on lipid reconstitution in high-saline medium (Fig. 3 and
Table 1) presents an opportunity to correlate the structural
features altered on lipid perturbation with bacteriorhodop-
sin photocycle activity after exposure to Triton.
Correlations between the recovery of bacteriorhodopsin
photocycle parameters and Dm
1/2
Infrared spectra and bacteriorhodopsin kinetic data were
obtained on samples immediately after lipid reconstitution
and removal of salt. Correlations between lipid-sensitive
bacteriorhodopsin photocycle parameters and Dm
1/2
were
performed after reconstitution in the presence of up to 4
M
NaCl. Specific parameters describing bacteriorhodopsin
structure and photocycle behavior, as noted below, correlate
well (compare Figures 3–5) with the recovery of Dm
1/2
in
the infrared spectra of reconstituted purple membrane
assemblies; other parameters (see below) displayed little or
no correlation.
The wavelength of maximum absorbance (k
max
)of
protonated retinal Schiff base analogs in solution is
446 nm [22]. Chromophore distortions induced by the
surrounding protein surface shift k
max
to 569 nm in native
purple membrane [23]. Exposure to Triton decreases k
max
to
562 nm [24]; lipid reconstitution in 1
M
NaCl restores
k
max
to 566 nm, while in higher NaCl concentrations, this
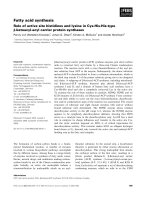
parameter returns to native-like values [3]. Figure 4 displays
aplotofk
max
vs. Dm
1/2
for Triton-treated purple membrane
Fig. 3. Plot of the half-width of the a-helical amide I mode (Dm
1/2
)vs.
NaCl concentration used for reconstitution. Thelinedrawnistheresult
of a second order polynomial fit.
Fig. 4. Plot of the wavelength of maximum absorbance for light-adapted
purple membrane (k
max
) vs. the half-width of the a-helical component of
theamideImode(Dm
1/2
) in bacteriorhodopsin for purple membrane
systems reconstituted in the absence of NaCl (Dm
1/2
= 29.2 cm
)1
)and
in 0.5
M
NaCl (Dm
1/2
= 29.6 cm
)1
), 1
M
NaCl (Dm
1/2
= 30.4 cm
)1
)
and 2
M
NaCl (Dm
1/2
= 30.8 cm
)1
).
Fig. 5. Plot of the mean M intermediate decay time (j)vs.thehalf-
width of the a-helical component of the amide I mode (Dm
1/2
) in bacte-
riorhodopsin.
Ó FEBS 2003 Control of bacteriorhodopsin conformational flexibility and photocycle activity (Eur. J. Biochem. 270)1923
systems reconstituted with native lipids at various NaCl
concentrations. The shift in k
max
on lipid perturbation by
Triton originates from twists in the retinal structure
and changes in its environment induced by a bacteriorho-
dopsin conformational change, which produces altered
protein–retinal interactions [25], while the decrease in Dm
1/2
arises from decreased mobility of the bacteriorhodopsin
a-helix structures. The linear correlation between the two
parameters demonstrates complete recovery to 569 nm as
Dm
1/2
recovers to 30.5 cm
)1
, approximately the half-width
observed in native purple membrane.
The recovery of normal bacteriorhodopsin photocycle
behavior may also be correlated with Dm
1/2
for kinetic
parameters that describe the decay of bacteriorhodop-
sin intermediates. The average decay time s of the M
410
intermediate is an important diagnostic parameter. It is the
weighted average of time constants for all forms of M present
and is influenced by the mix of M-fast and M-slow cycles. A
low value results from a preponderance of M-fast cycles,
whereas a high value results from a paucity of M-fast cycles.
In native purple membrane, the average s is 4 ms, arising
from the mix of rapidly decaying species (M
f
) with a decay
time of 2 ms and the slower component (M
s
) with a decay
time of 6 ms. Exposure to Triton increases the average s to
70 ms through loss of the M
f
decay pathway and the
generation of new, longer-lived M intermediates (R. W.
Hendler & S. Bose, unpublished work). Reconstitution in
1
M
NaCl partially recovers the M
f
pathway and lowers
average s to 19 ms, while average s decreases to less than
5 ms on full reconstitution in high saline medium [3].
Figure 5 displays a plot relating s with Dm
1/2
for the
reconstituted purple membrane systems. A linear correlation
between Dm
1/2
and the average M decay time occurs over a
wide range of decay times, illustrating that the conforma-
tional flexibility described by Dm
1/2
provides a faithful
description of the dynamics of the transmembrane helical
segments that relate to M intermediate decay during the
bacteriorhodopsin photocycle.
The number of bacteriorhodopsin molecules that under-
go a photocycle after a brief, high-intensity flash, termed the
bacteriorhodopsin turnover, is greatly diminished after
Triton exposure, reflecting the decreased ability of actinic
light to initiate the bacteriorhodopsin photocycle in the
perturbed systems [3]. This turnover may be quantified by
either the maximum decrease in absorbance at 569 nm or
increased absorbance at 410 nm (representing the M
410
formed) during the photocycle. Specifically, native purple
membrane exhibits a change in absorbance at 569 nm of
100 milli-absorbance units for specific conditions des-
cribed previously [3]. On exposure to Triton, decreased
bacteriorhodopsin turnover results in a decreased change in
absorbance of only 66 milli-absorbance units, because fewer
bacteriorhodopsin molecules undergo a photocycle for the
same conditions. On reconstitution in high-saline medium,
the bacteriorhodopsin turnover returns to native-like values
as quantified by the return to native values in the
absorbance loss at 569 nm during the photocycle. Figure 6
presents the maximum loss in absorbance at 569 nm during
the photocycle as a function of Dm
1/2
for the purple
membrane systems. The nonlinear recovery of the bacte-
riorhodopsin turnover with Dm
1/2
indicates that the struc-
tural features that govern bacteriorhodopsin turnover rate
involve other considerations than just the mobility of the
a-helices.
Discussion
The data presented here demonstrate definitive correlations
between the presence of native purple membrane lipid, the
time constants for M-turnover, and the mobility, or
motional characteristics, of the bacteriorhodopsin trans-
membrane a-helices. We emphasize the ability of infrared
spectroscopy to reflect the a-helical conformational flexibi-
lity of bacteriorhodopsin in native purple membranes after
depletion of lipids by Triton exposure and subsequent
stepwise reconstitution in lipid dispersions containing vari-
ous concentrations of NaCl which control the extent of lipid
rebinding. The intrinsic mobility of the transmembrane
a-helices of bacteriorhodopsin in purple membranes is
related specifically to the deconvoluted widths of the
a-helical amide I mode Dm
1/2
at 1660 cm
)1
. On exposure
to 0.1% Triton X-100, Dm
1/2
decreases, accompanied by
some disruption in the well-ordered purple membrane
lattice. Although lipid reconstitution in the absence of NaCl
recovers some of the structural parameters affected by
Triton exposure [3,19], the presence of NaCl is required for
a complete, functionally active system, as demonstrated by
correlations between the recovery of specific kinetic bacte-
riorhodopsin photocycle parameters and changes in Dm
1/2
(Figs 3–5).
Roles of squalene and polar lipid in bacteriorhodopsin
function
The correlation between the extent of reconstitution with
purple membrane lipid (i.e. squalene) and the degree of the
M
f
fi O fi BR photocycle activity and a-helical flexi-
ble mobility supports the proposal for bacteriorhodopsin
photocycle control being shared among squalene, polar
lipids, and acidic amino acids of the cytoplasmic loop
region. An extension of this concept accounts for all four
Fig. 6. Plot of the absorbance change at 569 nm in photoexcitation
(DmOD) vs. the half-width of the a-helical component of the amide I
mode (Dm
1/2
) in bacteriorhodopsin. Thelinedrawnistheresultofa
third-order polynomial fit.
1924 R. W. Hendler et al.(Eur. J. Biochem. 270) Ó FEBS 2003
distinct kinetic forms of M present in purple membrane
(R. W. Hendler & S. Bose, unpublished results). If we
attribute the four kinetic forms to different amounts of
modulation of charge repulsion by squalene, the simplest
model requires zero, one, two, or three squalenes per
monomer. As shown in Table 2, for 10 molecules of wild-
type bacteriorhodopsin, this requires three squalenes for
each of the four molecules displaying M
f
activity and two
squalenes for each of the six molecules displaying M
s
activity, yielding a squalene/bacteriorhodopsin ratio of
24 : 10. Similarly, to account for the three forms of
bacteriorhodopsin found in a the Triton-treated case listed
in Table 2, the ratio would be 5 : 10. Recent redetermina-
tions of squalene/bacteriorhodopsin stoichiometries in
native purple membrane using NMR procedures raise the
originally determined value of 1–2, a value closer to that
for the control shown in Table 2 [26].
The type of interaction described in R. W. Hendler &
S. Bose (unpublished results) here between a membrane
lipid and specific amino-acid residues of an active integral
protein such as to influence and control the structure and
function of the protein may be a prototype for similar
interactions in other membrane-protein systems.
References
1. Hendler, R.W., Dracheva, S. & Biochemistry (Moscow) (2001)
Importance of lipids for bacteriorhodopsin structure. Photocycle
Function 66, 1623–1627.
2. Joshi, M.K., Dracheva, S., Mukhopadyay, A.K., Bose, S. &
Hendler, R.W. (1998) Importance of specific native lipids in con-
trolling the photocycle of bacteriorhodopsin. Biochemistry 37,
14463–14470.
3. Mukhopadhyay, A.K., Dracheva, S., Bose, S. & Hendler, R.W.
(1996) Control of the integral membrane proton pump, bacterio-
rhodopsin, by purple membrane lipids of Halobacterium halobium.
Biochemistry 28, 9245–9252.
4. Bose, S., Mukhopadhyay, A.K., Dracheva, S. & Hendler, R.W.
(1997) Role of salt in reconstituting photocycle behavior in triton-
damaged purple membranes by addition of native lipids. J. Phys.
Chem. B 101, 10584–10587.
5. Hendler, R.W., Shrager, R.I. & Bose, S. (2001) Theory and pro-
cedures for finding a correct kinetic model for the bacterio-
rhodopsin photocycle. J. Phys. Chem. B 105, 3319–3328.
6. Kates, M., Kushwaha, S.C. & Sprott, G.D. (1982) Lipids of purple
membrane from extreme halophiles and of methanogenic bacteria.
Methods Enzymol. 88, 98–111.
7. Dracheva, S., Bose, S. & Hendler, R.W. (1996) Chemical and
functional studies on the importance of purple membrane lipids
in bacteriorhodopsin photocycle behavior. FEBS Lett. 382,
209–212.
8. Hendler, R.W., Dancshazy, Z., Bose, S., Shrager, R.I. & Tokaji,
Z. (1994) Influence of excitation energy on the bacteriorhodopsin
photocycle. Biochemistry 33, 4604–4610.
9. Hendler, R.W. & Shrager, R.I. (1994) Deconvolutions based on
singular value decomposition and the pseudoinverse: a guide for
beginners. J. Biochem. Biophys. Methods 28, 1–33.
10. Fitter, J., Lechner, R.E., Bu
¨
ldt, G. & Dencher, N.A. (1996)
Internal molecular motions of bacteriorhodopsin: hydration-
induced flexibility studied by quasielastic incoherent neutron
scattering using oriented purple membranes. Proc.NatlAcad.Sci.
USA 93, 7600–7605.
11. Braiman, M.S., Ahl, P.L. & Rothschild, K.J. (1987) Millisecond
Fourier-transform infrared difference spectra of bacterio-
rhodopsins M412 photoproduct. Proc.NatlAcad.Sci.USA84,
5221–5225.
12. Ferrand, M., Dianoux, A.J., Petry, W. & Zaccai, G. (1993)
Thermal motions and function of bacteriorhodopsin in purple
membranes: effects of temperature and hydration studied by
neutron-scattering. Proc. Natl Acad. Sci. USA 90, 9668–9672.
13. Clarke, J.H.R. (1978) Band shapes and molecular dynamics in
liquids. In Advances in Infrared and Raman Spectroscopy
(Clarke, R.J.H. & Hester, R.E., eds), Vol. 4, pp. 109–193. Heyden,
London.
14. Rothschild, W.G. (1984) Dynamics of Molecular Liquids.John
Wiley and Sons, New York.
15. Steinfeld, J.I. (1974) Molecules and Radiation.Harper&Row,
New York.
16. Arkin, I.T., Rothman, M., Ludlam, C.F.C., Aimoto, S., Engel-
man, D.M., Rothschild, K.J. & Smith, S.O. (1995) Structural
model of the phospholamban ion-channel complex in phospho-
lipid-membranes. J. Mol. Biol. 248, 824–834.
17. Ban
˜
uelos, S., Arrondo, J.L.R., Gon
˜
i, F.M. & Pifat, G. (1995)
Surface-core relationships in human low-density-lipoprotein as
studied by infrared-spectroscopy. J. Biol. Chem. 270, 9192–9196.
18. Cladera, J., Sabe
´
s, M. & Padro
´
s, E. (1992) Fourier-transform
infrared-analysis of bacteriorhodopsin secondary structure. Bio-
chemistry 31, 12363–12368.
19. Barnett, S.M., Dracheva, S., Hendler, R.W. & Levin, I.W. (1996)
Lipid-induced conformational changes of an integral membrane
protein: an infrared spectroscopic study of the effects of Triton
X-100 treatment on the purple membrane of Halobacterium
halobium ET1001. Biochemistry 35, 4558–4567.
20. Barnett, S.M., Edwards, C.M., Butler, I.S. & Levin, I.W. (1997)
Pressure-induced transmembrane Alpha (II)- to Alpha (I)-helical
conversion in bacteriorhodopsin: an infrared spectroscopic study.
J. Phys. Chem. B 45, 9421–9425.
21. Mayer, E. (1994) FTIR spectroscopic study of the dynamics of
conformational substates in hydrated carbonyl-myoglobin films
via temperature dependence of the CO stretching band param-
eters. Biophys. J. 67, 862–873.
22. Hamm, P., Zurek, M., Ro
¨
schinger, T., Patzelt, H., Oesterhelt, D.
& Zinth, W. (1996) Femtosecond spectroscopy of the photo-
isomerisation of the protonated Schiff base of all-trans retinal.
Chem. Phys. Lett. 263, 613–621.
23. Casadio, R., Gutowitz, H., Mowery, P., Taylor, M. & Stoeck-
enius, W. (1980) Light-dark adaptation of bacteriorhodopsin
in Triton-treated purple membrane. Biochim. Biophys. Acta 590,
13–23.
24. Mukhopadhyay, A., Bose, S. & Hendler, R.W. (1994) Membrane-
mediated control of the bacteriorhodopsin photocycle. Biochem-
istry 33, 10889–10895.
25. Messaoudi, S., Lee, K H., Beaulieu, D., Baribeau, J. & Boucher,
F. (1992) Equilibria between multiple spectral forms of bacterio-
rhodopsin: effect of delipidation, anesthetics and solvents on their
pH-dependence. Biochim. Biophys. Acta 1140, 45–52.
26. Corcelli, A., Lattenanzio, M.T., Mascolo, G., Papadia, P. &
Fanizzi, F. (2002) Lipid-protein stoichiometries in a crystalline
biological membrane: NMR quantitative analysis of the lipid
extractofthepurplemembrane.J. Lipid Res. 43, 132–140.
Table 2. Model for squalene regulation of M-turnover. The values in
parentheses are the number of squalenes per bacteriorhodopsin for the
kinetic species of M. SQ, Squalene; BR, bacteriorhodopsin.
M
f
(3) M
s
(2) M
10
(1) M
70
(0) SQ/BR
Control 40% 60% – – 2.4
Triton 0% 10% 30% 60% 0.5
Ó FEBS 2003 Control of bacteriorhodopsin conformational flexibility and photocycle activity (Eur. J. Biochem. 270)1925