Báo cáo khoa học: Isolation, characterization and expression analysis of a hypoxia-responsive glucose transporter gene from the grass carp, Ctenopharyngodon idellus potx
Bạn đang xem bản rút gọn của tài liệu. Xem và tải ngay bản đầy đủ của tài liệu tại đây (301.7 KB, 8 trang )
Isolation, characterization and expression analysis of a
hypoxia-responsive glucose transporter gene from the grass carp,
Ctenopharyngodon idellus
Ziping Zhang, Rudolf S. S. Wu, Helen O. L. Mok, Yilei Wang, Winnie W. L. Poon, Shuk H. Cheng
and Richard Y. C. Kong
Department of Biology and Chemistry and Centre for Coastal Pollution and Conservation, City University of Hong Kong,
Kowloon Tong, Hong Kong Special Administrative Region, People’s Republic of China
Glucose transporters (GLUTs) have been implicated in
adaptive and survival responses to hypoxic stress in mam-
mals. In fish, the expression and regulation of GLUT in
relation to hypoxia remains unexplored. Here we describe
the identification of a hypoxia-responsive glucose transpor-
ter gene (gcGLUT) and the corresponding full-length cDNA
from the grass carp. The gene spans 11 kb of genomic
sequence and consists of 12 exons and 11 introns, and an
open reading frame (ORF) of 1599 bp encoding a poly-
peptide of 533 amino acids, with a predicted molecular mass
of 57 kDa and a pI of 8.34.
BLASTX
analysis showed that
the ORF shared high sequence identity with the GLUT1
(57–59%), GLUT3 (59–60%) and GLUT4 (55–59%) pro-
teins from different vertebrates. Comparative analysis of
GLUT genomic structures showed that the arrangement of
exons and position of split codons are highly conserved
amongst members of the class I GLUTs suggesting that
these genes share a common ancestor. Phylogenetic ana-
lysis indicated that gcGLUT is most closely related to the
GLUT3 proteins. Northern blot analysis showed that the
3.1-kb gcGLUT transcript was most abundantly expressed
and responsive to hypoxia in kidney. Up-regulated
expression by hypoxia was also evident in eye and gill, but
differential patterns of expression were observed. Low
expression levels detected in brain, heart, liver and muscle
were not responsive to hypoxic stress.
Keywords: Ctenopharyngodon idellus; glucose transporter;
grass carp; hypoxia; split codon.
Glucose transporters (GLUTs) are members of a structur-
ally related family of membrane glycoproteins that facilitate
cellular uptake of glucose and are ubiquitiously expressed in
mammalian cells in a tissue-specific manner [1]. At least 13
different GLUT isoforms have been described in vertebrates
to date, and based on amino acid sequence similarities they
can be grouped into three subclasses [2]. Class I members
include GLUTs 1–4; class II members include GLUTs 5, 7,
9 and 11; and class III members include GLUTs 6, 8, 10, 12
and the proton/myoinositol cotransporter [3]. Although
structurally very similar, these isoforms have different tissue
distribution, subcellular localizations, kinetic characteristics,
and regulatory properties [1,4] and may be attributed to a
different glucose requirement by various embryonic [5] and
adult [6] tissues.
Expression of the GLUT1 and GLUT3 genes in mammals
is known to be induced by hypoxic stress and is mediated by
the basic helix-loop-helix transcription factor, hypoxia-
inducible factor-1 [7], presumably via its binding to the
hypoxia-responsive DNA elements in these genes [8].
Increased expression of these genes in hypoxic tissues has
been associated with enhanced glucose utilization to facili-
tate the supply of metabolic energy [9]. While much is
known about the distribution and regulation of these genes
and their responses to hypoxia in mammals, the corres-
ponding information in fish is not known. Although a
number of GLUT genes have recently been described in
various fish species [10–13], nothing is known about the
hypoxia responsiveness of these genes. Here, we describe
the cloning and genomic structure of a hypoxia-responsive
glucose transporter gene, gcGLUT from the grass carp and
the characterization of its in vivo expression and response
pattern to short- and long-term hypoxia.
Experimental procedures
Animals
Grass carp, Ctenopharyngodon idellus, weighing around
500 g, were obtained from a commercial hatchery and
acclimated in 300-L fibreglass tanks with circulating, filtered
and well-aerated tap water at 20 °C for 1 week prior to
experimentation. Fish were fed daily with lettuce that
amounted to 1% of body weight. Fish were then divided
into two groups, one group was reared under normoxia
Correspondence to R. Y. C. Kong, Department of Biology and
Chemistry, City University of Hong Kong, 83 Tat Chee Avenue,
Kowloon Tong, Hong Kong.
Fax: + 852 2788 7406, Tel.: + 852 2788 7794,
E-mail:
Abbreviation: GLUT, glucose transporter.
(Received 28 February 2003, revised 3 May 2003,
accepted 19 May 2003)
Eur. J. Biochem. 270, 3010–3017 (2003) Ó FEBS 2003 doi:10.1046/j.1432-1033.2003.03678.x
(7.0 ± 0.2 mg O
2
ÆL
)1
) and the other under hypoxia
(0.5 ± 0.3 mg O
2
ÆL
)1
) in a continuous flow system des-
cribed by Zhou et al. [14]. The levels of dissolved oxygen
were monitored continuously using a YSI Model 580
dissolved oxygen meter. After the exposure period, fish were
anaesthetized by immersion in 2-phenoxyethanol (0.05%
v/v) for 5 min, and killed by a blow to the head. Tissues
were then dissected out and snap-frozen in liquid nitrogen,
and stored at )80 °C. Animal care and experiments were
conducted in accordance with the City University of Hong
Kong animal care guidelines.
RNA isolation and cloning of full-length cDNAs
Total RNA was prepared from grass carp tissues using the
Trizol reagent (Invitrogen) according to the manufacturer’s
instructions. Poly(A)
+
RNA was purified from total RNA
using the PolyATract System kit (Promega). The primers
GLUT1-F (5¢-ATGAGCAGAAATCGAGGGCTCTC-3¢)
and GLUT1-R (5¢-ACAGCCCTCAGAGGAGCCCTT-
3¢) derived from the common carp GLUT1 sequence
(AF247730), were used to amplify a 0.2-kb GLUT1-like
cDNA fragment by RT-PCR with total RNA from grass
carp kidney. PCR in a 100-uL mixture was performed on
first-strand cDNAs that were reverse transcribed from total
RNA by use of Superscript II reverse transcriptase (Invi-
trogen) and consisted of 20 ng of first strand cDNA,
1 · PCR buffer (20 m
M
Tris/HCl pH 8.4, 50 m
M
KCl),
1 l
M
of each primer, 0.2 m
M
of dNTPs, 1.5 m
M
MgCl
2
and
5U of Taq DNA polymerase (Invitrogen). The PCR
program consisted of predenaturation at 94 °Cfor3min,
followed by 35 cycles of amplification (denaturation at
94 °C for 20 s, annealing at 55 °C for 1 min, and extension
at 72 °C for 1 min) and a final extension at 72 °Cfor10 min
in a Gene Cycler (Bio-Rad, USA). The amplified DNA
fragment was subcloned into a pGEM-T vector (Promega)
and DNA sequencing showed that it shared 100% nucleo-
tide similarity to common carp GLUT1. The 0.2-kb cDNA
subclone (designated as RK-1) was used as a probe to screen
a grass carp kidney cDNA library that was prepared in
kTriplEx2 in our laboratory using the Smart cDNA library
construction kit (Clontech). A single 1.6-kb cDNA clone
(RK-2) was obtained and DNA sequencing showed that it
shared 76% nucleotide similarity with RK-1. 5¢-RACE and
3¢-RACE were performed using the Marathon cDNA
amplification kit (Clontech) to obtain the full-length cDNA
sequence for RK-2 with poly(A)
+
RNA purified from
the kidney of a hypoxic grass carp. The adaptor primers
AP1 and AP2 were purchased from Clontech. Gene-specific
nested primers for 5¢-RACE were: Primer A, 5¢-TGTC
AGTCCTGTACAAAGAC-3¢ and Primer B, 5¢-CAT
CAGGCTTCCCCATA-3¢. Gene-specific nested primers
for 3¢-RACE were: Primer C, 5¢-CCAGTGTCCCCAT
CATCAG-3¢ and Primer D, 5¢-GGCAATTTTAAA
GTCATTATGGCGCAAA-3¢. First strand cDNAs were
synthesized using Superscript II RNase H
–
reverse tran-
scriptase (Invitrogen) according to the manufacturer’s
instructions. PCRs were performed using 1 · Advantage2
Taq polymerase mix (Clontech) in 50-uL reactions which
contained 20 ng of first strand cDNA, 1 · PCR buffer
(20 m
M
Tris/HCl pH 8.4, 50 m
M
KCl), 0.2 l
M
of each
primer, 1.5 m
M
MgCl
2
and 0.2 m
M
of dNTPs. PCR
amplification was performed in a Gene Cycler (Bio-Rad,
USA) under the following conditions: 94 °C, 30 s followed
by 94 °C, 5 s; 72 °C, 3 min (5 cycles); 94 °C, 5 s, 70 °C,
3 min (5 cycles); 94 °C, 5 s; 68 °C, 3 min (25 cycles). RACE
products were cloned into a pGEM-T vector (Promega) for
DNA sequencing. Full-length cDNAs were obtained by
reverse-transcription PCR using gene-specific primers:
GT1-F, 5¢-CCTGATCGACGCACGAGT-3¢ and GT1-R,
5¢-TTTTGCAAGTCATAGTAATCAGTTT-3¢ for GT-
cDNA1 (2150 bp); and GT2-F, 5¢-CACCAGCAACTAC
CTGATCGA-3¢ and GT2-R, 5¢-CACAAAATATGCTT
CCAAGTGC-3¢ for GT-cDNA2 (3043 bp).
Construction and screening of a grass carp
genomic DNA library
Genomic DNA was extracted from grass carp liver by the
use of Genomic-tips (Qiagen) according to the manufac-
turer’s instructions. Genomic DNA was partially digested
with Sau3AI and fragments larger than 9.5 kb were ligated
into BamHI-digested EMBL3 arms (Stratagene) and pack-
aged into Escherichia coli XL1-Blue MR cells using
Gigapack Gold Packaging Extract (Stratagene). Approxi-
mately 30 000 plaque forming units were screened with the
3-kb GT-cDNA2 fragment radiolabeled with [a-
32
P]dCTP
by random priming. Hybridization was performed in
ExpressHyb solution (Clontech) at 65 °C for 2 h and one
strongly hybridizing phage clone (kgH-1) was identified and
further characterized by restriction enzyme digestion with
BstXI, HindIII, PstIandXbaI, and southern hybridization
analysis using GT-cDNA2 as a probe.
Northern blot analysis
Total RNA (20 lg) from different tissues was electropho-
resed on 1% agarose/formaldehyde gels and blotted onto
nylon membrane (Hybond-XL, Amersham Biosciences).
DNA probes were radiolabeled by the random priming
method and 2.0 · 10
6
c.p.m.ÆmL
)1
were used in northern
hybridizations and were carried out at 65 °Cfor2hin
ExpressHyb solution (Clontech). Blots were washed thrice
in 2 · NaCl/Cit (1 · NaCl/Cit ¼ 0.15
M
NaCl, 0.015
M
sodium citrate), 0.05% (w/v) SDS at room temperature
for 10 min, and twice in 0.1 · NaCl/Cit, 0.1% SDS at
50 °C for 20 min. Blots were exposed on a phosphor screen
(Kodak-K) at room temperature for 20 h, and the signals
were captured using the Molecular Imager FX System (Bio-
Rad). A 115-bp 28S rDNA fragment was amplified from
grass carp genomic DNA using primers 28S-F (5¢-GAT
CCTTCGATGTCGGCTCT-3¢) and 28S-R (5¢-CTAA
CCTGTCTCACGACGGT-3¢), and was used as an internal
control probe in Northern hybridization for normalization
of gcGLUT expression.
Phylogenetic analysis
Phylogenetic analysis was performed by maximum parsi-
mony using the
PROTPARS
program of the
PHYLIP
package
version 3.57c [15]. Support for the inferred clades was
obtained by bootstrap analysis from 1000 replications of the
data set using the
SEQBOOT
and
CONSENSE
programs.
Phylogenetic tree was displayed using
TREEVIEW
[16].
Ó FEBS 2003 A hypoxia-responsive glucose transporter gene from grass carp (Eur. J. Biochem. 270) 3011
Sequence analyses and homology searches were performed
using the online
BLAST
suite of programs (NCBI, USA).
Statistical analysis
A nonparametric v
2
test was used to test the hypothesis that
the ratio of expression level in the hypoxic treatment group
(n ¼ 4) was not significantly different from the normoxic
control (n ¼ 4) at different time intervals. A one-way
ANOVA
was used to test if there was any significant difference
in gene expression levels between different exposure periods.
Where the null hypothesis was rejected, a Tukey’s test was
performed to identify significant difference between indi-
vidual means; a ¼ 0.05 was used in all statistical tests.
Results
Isolation of two gcGLUT cDNAs generated
from alternative polyadenylation sites
In an attempt to identify GLUT-like cDNA sequences, a
grass carp kidney cDNA library was screened with a 0.2-kb
grass carp GLUT1-likecDNA(RK-1)fragmentthatwas
derived by RT-PCR. A single 1.6-kb cDNA clone (desig-
nated as RK-2) that showed strong positive hybridization
was identified and DNA sequencing showed that it shared
76% nucleotide sequence similarity with the RK-1 DNA
probe. Further analysis indicated that RK-2 contained an
incomplete GLUT ORF and lacked the start codon. Using
5¢-and3¢-RACE PCR, two overlapping full-length cDNA
clones of 2.1 kb (GT-cDNA1) and 3.1 kb (GT-cDNA2)
that shared 100% nucleotide sequence identity were
obtained. Sequence analysis showed that both GT-cDNA1
and GT-cDNA2 contain a 5¢-UTR of 203 bp and a coding
region of 1599 bp (excluding the stop codon), but the
3¢-UTR of GT-cDNA1 is 345 bp while that of GT-
cDNA2 is 1238 bp (Fig. 1A; GenBank accession number
AY231475). The results indicated that GT-cDNA1 and
GT-cDNA2 are derived from the same GLUT gene from
alternative use of polyadenylation sites. This was corrob-
orated by Northern blot analysis in which two transcripts
2.1and3.1kbinsizeweredetectedinthetotalRNAof
grass carp kidney; the larger transcript showed a 30-fold
higher expression level than the former (data not shown).
Further analysis of the ORF showed that it encodes a
putative polypeptide of 533 amino acids, with a predicted
molecularmassof 57 kDa and a pI of 8.34. A database
search using
BLASTX
showed that the ORF shared high
sequence identity with the GLUT1 (57–59%), GLUT3
(59–60%) and GLUT4 (55–59%) proteins, and moderate
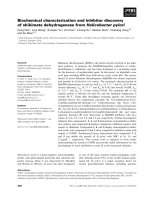
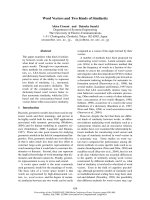
Fig. 1. Organization of the gcGLUT gene. (A)
The 12 exons of the gcGLUT gene are shown
as boxes. Filled and open boxes indicate
translated and untranslated regions, respect-
ively. The position of the start (ATG) and stop
(TAA) codons are indicated by inverted
arrows (fl).The 5¢-end of exon 1 was inferred
by 5¢-RACE and the two alternate 3¢-ends of
exon 12 were deduced by 3¢-RACE, and are
delineated by the full-length cDNA clones,
GT-cDNA1 and GT-cDNA. The two puta-
tive polyadenylation sites (ATTAAA) are
indicated by an upright arrow (›). (B) The
exon/intron boundaries of the split codons for
arginine (between exon 4 and exon 5) and
valine (between exons 6 and exon 7) are
shown. Exonic regions are shown in uppercase
and intronic regions are in lowercase. The split
codons are boxed and highlighted in gray.
3012 Z. Zhang et al. (Eur. J. Biochem. 270) Ó FEBS 2003
(GLUT2; 48–50%) to low (GLUTs 5–13; < 40%)
sequence identity with other GLUT types from various
vertebrate species.
Characteristics of the deduced amino acid sequence
of gcGLUT
Analysis of the deduced amino acid sequence of GT-
cDNA1 with the
HMMTOP
program ( />hmmtop/) [17] indicated the presence of 12 putative
transmembrane helices, and alignment to human GLUT1,
GLUT3 and GLUT4 (with which it shares high sequence
identity) indicated a high degree of structural conservation
and the presence of typical sugar transporter motifs
common to all members of the class I GLUTs [2]. These
include: a putative N-glycosylation site in extracellular loop
1; the STSIF motif in loop 7 (the third S residue is
substituted by an E); the PESPR/PETKGR motifs after
transmembrane helix 6 and 12; GRR motifs in intracellular
loops 2 and 8; glutamate and arginine residues in intracel-
lular loops 4 and 10; the QL motif in transmembrane helix
5; the QLS motif in transmembrane helix 7; and the three
tryptophan residues in transmembrane helix 2, 6 and 11
(motifs are highlighted in bold type in Fig. 2). These features
suggest that GT-cDNA1 encodes for a class I glucose
transporter and is hereupon designated as gcGLUT. A
striking feature of gcGLUT is the presence of a relatively
longer loop 9 sequence that contains a putative N-glycosy-
lation site that is not present in GLUT1–GLUT4. Moreover,
the FGY motif which is highly conserved in transmembrane
helix 1 is changed to FGF in gcGLUT; a change which was
alsoobservedinmammalianGLUT8[18].
In an attempt to ascertain the phylogenetic affinity of
gcGLUT, a phylogenetic tree consisting of GLUT1,
GLUT2, GLUT3 and GLUT4 proteins was constructed
by maximum parsimony (
PROTPARS
) and bootstrapped
with 1000 replications using the
PHYLIP
package version
3.57c [15]. As shown in Fig. 3, gcGLUT was found to
cluster in the same clade with the GLUT3 proteins,
although it was supported by a bootstrap value of only
41%. Phylogenetic analysis using the neighbor-joining
method also produced a similar tree of the same topology
(data not shown).
Genomic structure of
gcGLUT
GT-cDNA2 was used to screen a kEMBL-3 grass carp
genomic library from which a phage clone (kgH-1) was
obtained and was characterized by restriction mapping and
Southern blot analyses (data not shown). Appropriate
fragments that showed positive hybridization were cloned
into pBluescript and sequenced on both strands, and gaps in
the sequences were filled by primer walking. A contiguous
stretch of 14 kb of genomic sequence was obtained. The
exon/intron boundaries were identified by comparing the
genomic sequence with the full-length cDNA sequence and
conform to the invariant gt/ag sequences at the 5- and
3-splice sites, respectively (data not shown). As shown in
Fig. 1A, the gcGLUT gene (GenBank accession number
AY231476) spans 11 kb of genomic DNA and contains
12 exons and 11 introns. The 5¢-UTR (203 bp) is contained
in exons 1 and 2; the coding region (1599 bp) is distributed
across exons 2–12 and the 3¢-UTR is located within a
1238-bp stretch of sequence (corresponding to 3¢-UTR of
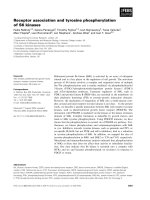
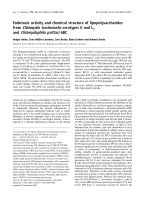
Fig. 2. Alignment of gcGLUT with the human
GLUT1, GLUT3 and GLUT4 proteins.
hGLUT1 (accession number AAA52571),
hGLUT3 (accession number AAB61083),
hGLUT4 (accession number AAA59189).
Amino acids are designated by single-letter
codes. Dashes (–) indicate gaps inserted for
improved alignment. Amino acid positions are
indicated on the right. Boxshade is used to
highlight regions with different levels of
sequence identity: identical amino acids in at
least three sequences are in black, and similar
amino acids in at least two sequences are in
gray. Functional motifs described in other
GLUTs are highlighted in boldtype (see text).
The putative 12-transmembrane helices are
boxed and labeled transmembrane helix 1–12.
Upright triangles (n) indicate the exon
splice sites and corresponding exon domains.
Filled triangles (m) indicate codon splitting
positions of arginine-96 and valine-231.
Ó FEBS 2003 A hypoxia-responsive glucose transporter gene from grass carp (Eur. J. Biochem. 270) 3013
GT-cDNA2) at the 3¢ end of exon 12. Examination of the
3¢-flanking genomic sequence revealed two putative poly-
adenylation (ATTAAA) signals: one is located 18 bp
upstream from the poly(A) of GT-cDNA1 and another is
located 11 bp upstream from the poly(A) of GT-cDNA2
(data not shown). Of particular interest is the presence of
eight AUUUA motifs in the 3¢-UTR of GT-cDNA2
compared to only one in GT-cDNA1 (data not shown).
This sequence motif is a potential adenosine-uridine-binding
factor site that has been identified as important for
regulating mRNA stability [19], as has been also reported
for GLUT1 [20] and GLUT3 [21].
Comparative analysis of gcGLUT to members of the
class I (human GLUT1, GLUT2, GLUT3 and GLUT4),
class II (human GLUT5) and class III (human GLUT10)
extended GLUT family [2] revealed marked structural
similarities in genomic organization amongst members of
the class I subfamily (Table 1). Six of the exons of gcGLUT
(exons 4–9) encoding for the region spanning transmem-
brane helix 2 to transmembrane helix 9 (Fig. 2) are identical
in size to six respective exons (exons 3–8) in human GLUT1
and GLUT3 (exons 3–8), and four in human GLUT2 (exons
7–10) and GLUT4 (exons 6–9) (Table 1). The codons for
arginine (96) and valine (231) in gcGLUT (Fig. 2) are split
between exons 4 and 5, and exons 6 and 7, respectively
(Fig. 1B). Whilst computer analysis indicated that codon
splitting at the first site is also conserved in human GLUT1
and GLUT3, codon splitting at the second site is conserved
in all four class I human GLUTs (data not shown). These
observations therefore suggest that gcGLUT and human
GLUTs1–4 arose by duplication of a common ancestral
gene encoding these specific domains.
In vivo
expression and response pattern of
gcGLUT
to short and long-term hypoxia
To study the in vivo expression and response pattern of
gcGLUT to hypoxia, grass carp were exposed to normoxic
(7 mg O
2
ÆL
)1
) and hypoxic (0.5 mg O
2
ÆL
)1
) conditions and
fish (n ¼ 4) were sampled from each treatment group and
control after 4, 96 and 170 h. Total RNA was isolated from
seven different tissues of each of four fish from the normoxic
and hypoxic groups at each time point for Northern blot
analysis. A representative autoradiogram is given in Fig. 4.
Under normoxic conditions, the 3.1-kb gcGLUT mRNA
transcript was most abundantly expressed in kidney;
however, lower levels of expression were also detected in
all other tissues examined; brain, eye, gill, heart, liver and
muscle. Exposure to hypoxia for 4, 96 and 170 h resulted in
a marked and persistent increase in gcGLUT expression in
kidney, while hypoxic induction was only observed in gill at
4 h, and eye at 4 and 170 h. In vivo expression of 3.1-kb
gcGLUT transcript was seemingly unaffected by both short
and long-term hypoxia in brain, heart, liver and muscle of
grass carp at all time points examined. Interestingly, the less
abundant 2.1-kb gcGLUT transcript also showed promin-
ent expression and hypoxia up-regulation ( threefold) in
kidney; however, it was barely detectable in all other tissues
examined under both normoxic and hypoxic conditions
(data not shown).
Expression levels of gcGLUT in all replicates of each
tissue under normoxic and hypoxic conditions were nor-
malized against 28S rRNA and were found to vary
considerably within each tissue type as well as each time
point. A Chi square test was used to identify whether
expression level was significantly different between each
hypoxic treatment and the respective normoxic control.
One way analysis of variance was performed to test the
hypothesis that there was no significant difference in
expression level between different time points within each
tissue type. Where significant differences were identified
(P<0.05), pairwise comparisons were carried out using a
Dunnett’s test. All statistical analyses were carried out using
Graphpad
PRISM
(version2). The analysis showed that
statistically significant increases in gcGLUT expression
levels were observed only in eye (1.5 ± 0.2 fold at 4 and
170 h; P < 0.05), gill (1.7 ± 0.13 and 1.4 ± 0.19 fold at
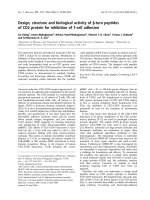
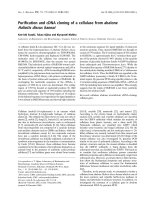
Fig. 3. Phylogenetic analysis of gcGLUT. An unrooted tree depicting
the phylogenetic relatedness of gcGLUT to the known GLUT1–
GLUT4 proteins from fish, avian or mammalian sources. The protein
sequences obtained from the GenBank/EMBL/Swissprot databases
include: common carp ccGLUT1 (AAF75683); rainbow trout
rtGLUT1A (AAF75681); chicken GLUT1 (AAB02037); mouse
GLUT1 (AAA37752); rat GLUT1 (P11167) rabbit GLUT1 (P13355);
bovine GLUT1 (P27674); human GLUT1 (AAA52571); rtGLUT2
(AAK09377); chicken GLUT2 (Q90592); human GLUT2
(AAA59514); mouse GLUT2 (P14246); rat GLUT2 (P12336); chicken
GLUT3 (AAA48662); mouse GLUT3 (AAH34122); rat GLUT3
(Q07647); rabbit GLUT3 (Q9XSC2); human GLUT3 (AAB61083);
dog GLUT3 (P47842); bovine GLUT3 (AAK70222); sheep GLUT3
(P47843); brown trout btGLUT4 (AAG12191); bovine GLUT4
(Q27994); rat GLUT4 (P19357); mouse GLUT4 (P14142); and human
GLUT4 (AAA59189). The bootstrap support (SEQBOOT program,
PHYLIP
package) for each branch (1000 replications) is shown.
3014 Z. Zhang et al. (Eur. J. Biochem. 270) Ó FEBS 2003
4 and 170 h, respectively; P < 0.05) and kidney (2 ± 0.35
fold at 4 h, 2.7 ± 0.9 fold at 96 h and 2.2 ± 0.2 fold
at 170 h; P < 0.05).
Discussion
In the present study, we have isolated and characterized the
structure and expression pattern of a hypoxia-responsive
glucose transporter gene, gcGLUT, from the grass carp.
Computer analysis of the deduced amino acid sequence
predicted that gcGLUT is a 12-transmembrane spanning
protein and that it possesses all the major structural features
and sequence motifs characteristic of a functional class I
glucose transporter, and include: (1) the QLS residues in
transmembrane helix 7 which is required for high-affinity
transport of glucose [22]; (2) the two arginine residues (336/
337) in the conserved GRR motif in intracellular loop 8 [23]
and proline residues in transmembrane helix 6 and trans-
membrane helix 10 [24] which are essential for glucose
transport activity; and (3) the serine/threonine residues at
positions 298 and 299 in loop 7 (Fig. 2) that are involved
in conformational change of the GLUT protein during
transport [25].
To date, cDNAs of five GLUT isotypes have been
described in fish and sequence comparison showed that
gcGLUT shares a sequence identity of 58% with GLUT1
of common carp [13], 57% with GLUT1A of rainbow
trout [12], 59% with GLUT4 of brown trout [10], 58%
with the GLUT4-like protein (accession number
AAM22227) of coho salmon, and 50% with GLUT2 of
rainbow trout [11]. No report of GLUT3 has yet been
described in fish. Although we were unable to predict the
actual isoform of gcGLUT based on sequence identity
scores, maximum parsimony (Fig. 3) and neighbor-joining
(data not shown) analyses both indicated that gcGLUT is
phylogenetically more similar to GLUT3 than to other
class I GLUTs.
Comparative analysis of the genomic organization of
gcGLUT with different human GLUT genes showed that
exons 4–9 of the gcGLUT gene, that encode for the
region spanning transmembrane helix 2 to transmembrane
helix 9 (Fig. 2), share strong structural homology with six
of the respective exons in the hGLUT1 and hGLUT3
Table 1. Exonic structure conservation in gcGLUT and selected human GLUT genes. Values are shown as the exon size (bp) distribution. The stretch
of homologous exons that are conserved amongst different GLUT genes are highlighted in bold type. Accession numbers of the respective GLUT
genes are in parentheses.
Exon
Class I (human)
Class II (human)
GLUT5 (NT_028054)
Class III (human)
GLUT10 (NT_011362)
gcGLUT
(AY231476)
GLUT1
(NT_004852)
GLUT2
(NT_034563)
GLUT3
(NT_024397)
GLUT4
(NT_010823)
1 86 197 279 256 233 207 253
2 141 96 45 93 117 99 1284
3 102 161 93 161 173 161 123
4 161 241 263 241 125 125 136
5 241 163 125 163 116 153 2590
6 163 188 116 188 163 126
7 188 105 163 105 188 188
8 105 102 188 102 105 111
9 102 204 105 204 102 102
10 57 1398 102 219 204 76
11 201 2566 2615 657 128
12 1468 845
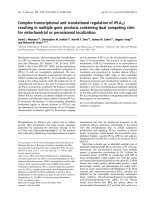
Fig. 4. In vivo expression and response pattern to hypoxia of gcGLUT.
A representative Northern blot derived from the tissues of one
normoxic and one hypoxic fish from a total of four in each group is
shown. Total RNA (20 lg) samples from different tissues of fish
subjected to normoxia (N) and hypoxia (H) for 4 h, 96 h and 170 h
were analysed by Northern hybridization using GT-cDNA2
(gcGLUT) and a 115-bp grass carp 28S rDNA fragment as probes.
Quantitation was performed by normalizing gcGLUT expression levels
against the 28S rRNA.
Ó FEBS 2003 A hypoxia-responsive glucose transporter gene from grass carp (Eur. J. Biochem. 270) 3015
genes, and four of the respective exons in hGLUT2 and
hGLUT4 (homologous exons are shown in bold type in
Table 1). Moreover, whilst the nature and position of the
split codon for arginine 96 (divided between exons 4 and
5; Fig. 2) is conserved in gcGLUT, hGLUT1 and
hGLUT3; the position of the split codon for valine-231
(divided between exon 6 and exon 7) is conserved in
gcGLUT, hGLUT1, hGLUT2, hGLUT3 and hGLUT4.
Overall, the analysis indicated that the genomic organiza-
tion of gcGLUT is structurally more similar to the
hGLUT1 and hGLUT3 genes. Computer analysis of the
mouse GLUT1–GLUT4 genes, which are highly homo-
logous to the human counterparts, also showed conserved
homology in these stretch of exons (data not shown).
Moreover, when version 3 of the Fugu rubripes genome
( was
queried with the gcGLUT coding sequence, four candidate
Fugu GLUT genes that share 56–70% sequence identity
with gcGLUT were obtained, and all showed a pattern of
exon sizes similar to gcGLUT. Overall, these observations
strongly indicate that members of the class I GLUT
subfamily may have arisen by duplication of a common
ancestral gene encoding these domains and that there is a
high selective pressure to maintain the arrangement of
these exons.
In mammals, hypoxic stress is known to increase
GLUT1 and GLUT3 expression in specific tissues to
enhance the uptake rate of glucose both to facilitate the
supply of metabolic energy [9] and to protect cells from
hypoxic injury [26]. Fish often have to contend with low
and variable oxygen levels in the aquatic environment.
Although, it has been reported that hypoxia causes
significant changes in plasma glucose level [27,28] and
glucose flux [29] in fish, until now, nothing has been
known about the regulation or tissue-specific expression
pattern of fish GLUTs in response to hypoxic stress. Here,
we have demonstrated for the first time a hypoxia-
responsive GLUT gene that is both most prominently
expressed and responsive to hypoxia in the carp kidney.
Moreover, although gcGLUT expression was markedly
lower in eye and gill, up-regulated differential expression
patterns during short (4 h) and long-term (96 and 170 h)
hypoxia were also evident in these two organs (Fig. 4),
implying a difference in glucose transport and regulation
in different tissues during hypoxic stress. It is conceivable
that modulation of glucose transport for a continuous
supply of energy is important in the fish kidney (for
osmoregulatory activities), an organ which is known to
show high glucose uptake rates [30]. So far, no GLUT
gene that shows predominant expression in kidney has
been reported, and further studies have yet to be done to
determine the functional characteristics and regulation of
this apparent kidney-specific GLUT, in particular its
physiological role(s) in relation to hypoxia adaptation and
tolerance in fish.
Acknowledgements
This work was supported by a Central Earmarked Research Grant
(Project No. CityU1057/99
M
) from the Research Grants Council of
Hong Kong Special Administrative Region, People’s Republic of
China.
References
1. Mueckler, M. (1994) Facilitative glucose transporters. Eur. J.
Biochem. 219, 713–725.
2. Joost, H.G. & Thorens, B. (2001) The extended GLUT-family of
sugar/polyol transport facilitators: nomenclature, sequence char-
acteristics, and potential function of its novel members. Mol.
Memb. Biol. 18, 247–256.
3. Uldry, M., Ibberson, M., Horisberger, J.D., Chatton, J.Y., Rie-
derer, B. & Thorens, B. (2001) Identification of a mammalian H
+
-
myoinositol symporter expressed predominantly in the brain.
EMBO J. 20, 4467–4477.
4. Baldwin, S.A. (1993) Mammalian passive glucose transporters:
members of an ubiquitous family of active and passive transport
proteins. Biochim. Biophys. Acta. 1154, 17–49.
5. Carver, F.M., Shibley, I.A. Jr, Pennington, J.S. & Pennington,
S.N. (2001) Differential expression of glucose transporters during
chick embryogenesis. Cell. Mol. Life. Sci. 58, 645–652.
6. Bell, G.I., Burant, C.F., Takeda, J. & Gould, G.W. (1993)
Structure and function of mammalian facilitative sugar transpor-
ters. J. Biol. Chem. 268, 19161–19164.
7. Iyer,N.V.,Kotch,L.E.,Agani,F.,Leung,S.W.,Laughner,E.,
Wenger, R.H., Gassmann, M., Gearhart, J.D. & Lawler, A.M.,
Yu, A.Y. & Semenza, G.L. (1998) Cellular and developmental
control of O
2
homeostasis by hypoxia-inducible factor 1a. Genes
Dev. 12, 149–162.
8. Ebert, B.L., Firth, J.D. & Ratcliff, P.J. (1995) Hypoxia
and mitochondrial inhibitors regulate expression of glucose
transporter-1 via distinct cis-acting sequences. J. Biol. Chem. 270,
29083–29089.
9. Bunn, H.F. & Poyton, R.O. (1996) Oxygen sensing and molecular
adaptation to hypoxia. Physiol. Rev. 76, 839–885.
10. Planas, J.V., Capilla, E. & Gutierrez, C.J. (2000) Molecular
identification of a glucose transporter from fish muscle. FEBS
Lett. 481, 266–270.
11. Krasnov, A., Teerijoki, H. & Molsa, H. (2001) Rainbow trout
(Onchorhynchus mykiss) hepatic glucose transporter. Biochim.
Biophys. Acta. 1520, 174–178.
12. Teerijoki, H., Krasnov, A., Pitkanen, T.I. & Molsa, H. (2000)
Cloning and characterization of glucose transporter in teleost fish
rainbow trout (Oncorhynchus mykiss). Biochim. Biophys. Acta.
1494, 290–294.
13. Teerijoki, H., Krasnov, A., Pitkanen, T.I. & Molsa, H. (2001)
Monosaccharide uptake in common carp (Cyprinus carpio)EPC
cells is mediated by a facilitative glucose carrier. Comp. Biochem.
Physiol. (Part B). 128, 483–491.
14. Zhou, B.S., Wu, R.S.S., Randall, D.J. & Lam, P.K.S.
(2001) Bioenergetics and RNA/DNA ratios in the common
carp (Cyprinus carpio) under hypoxia. J. Comp. Physiol. B. 171,
49–57.
15. Felsenstein, J. (1995)
PHYLIP
(Phylogeny Inference Package),
Version 3.572. Distributed over the World Wide Web, Seattle.
16. Page, R.D.M. (1996) TREEVIEW: An application to display
phylogenetic trees on personal computers. Comp. Appl. Biosci. 12,
357–358.
17. Tusnay, G.E. & Simon, I. (1998) Principles governing amino acid
composition of integral membrane proteins: Applications to
topology prediction. J. Mol. Biol. 283, 489–506.
18. Doege, H., Schurmann, A., Bahrenberg, G., Brauers, A. & Joost,
H.G. (2000) GLUT8, a novel member of the sugar transport
facilitator family with glucose transport activity. J. Biol. Chem. 21,
16275–16280.
19. Asson-Batres, M., Spurgeon, S., Diaz, J., DeLoughery, T. &
Bagby, G. (1994) Evolutionary conservation of the AU-rich
3¢-untranslated region of messenger RNA. Proc.NatlAcad.Sci.
USA 91, 1318–1322.
3016 Z. Zhang et al. (Eur. J. Biochem. 270) Ó FEBS 2003
20. Boada, R.J. & Pardridge, W.M. (1993) Glucose deprivation causes
post-transcriptional enhancement of brain capillary endothelial
glucose transporter gene expression via GLUT1 mRNA stabili-
zation. J. Neurochem. 60, 2290–2296.
21. Borson, N.D., Salo, W.L. & Drewes, L.R. (1996) Canine brain
glucose transporter 3: gene sequence, phylogenetic comparisons
and analysis of functional sites. Gene 168, 251–256.
22. Seatter, M.J., De La Rue, S.A., Porter, L.M. & Gould, G.W.
(1998) QLS motif in transmembrane helix VII of the glucose
transporter family interacts with the C-1 position of
D
-glucose and
is involved in substrate selection at the exofacial binding site.
Biochemistry 37, 1322–1326.
23. Wandel, S., Schuermann, A., Becker, W., Summers, S.A.,
Shanahan, M.F. & Joost, H.G. (1995) Mutation of two conserved
arginine residues in the glucose transporter GLUT4 suppresses
transport activity, but not glucose-inhibitable binding of
inhibitory ligands. Naunyn-Schmiedeberg’s Arch. Pharmacol. 353,
36–41.
24. Wellner, M., Monden, I., Mueckler, M.M. & Keller, K. (1995)
Functional consequences of proline mutations in the putative
transmembrane segments 6 and 10 of the glucose transporter
GLUT1. Eur. J. Biochem. 227, 454–458.
25. Doege, H., Schurmann, A., Ohnimus, H., Monser, V., Holman,
G.D. & Joost, H.G. (1998) Serine-s94 and threonine-295 in the
exofacial loop domain between helixes 7 and 8 of glucose trans-
porters (GLUT) are involved in the conformational alterations
during the transport process. Biochem. J. 329, 289–293.
26. Lin, Z., Weinberg, J.M., Malhotra, R., Merritt, S.E., Holzman,
L.B. & Brosius, F.C.I.I.I. (2000) GLUT-1 reduces hypoxia-
induced apoptosis and JNK pathway activation. Am.J.Physiol.
Endocrinol. Metab. 278, E958–E966.
27. White, A. & Fletcher, T.C. (1989) The effect of physical dis-
turbance, hypoxia and stress hormones on serum components of
the plaice, Pleuronectes platessa L. Comp. Biochem. Physiol. 93A,
455–461.
28. Kakuta, I., Namba, K., Uemaisu, K. & Murachi, S. (1992) Effects
of hypoxia on renal function in carp, Cyprinus carpio. Comp.
Biochem. Physiol. 101A, 769–774.
29. Haman, F., Zwingelstein, G. & Weber, J.M. (1997) Effects of
hypoxia and low temperature on substrate fluxes in fish: plasma
metabolite concentrations are misleading. Am. J. Physiol. 273,
R2046–R2054.
30. Blasco, J., Fernandez-Borras, J., Marimon, I. & Requena, A.
(1996) Plasma glucose kinetics and tissue uptake in brown trout
in vivo: effect of an intravascular glucose load. J. Comp. Physiol.
165B, 534–541.
Ó FEBS 2003 A hypoxia-responsive glucose transporter gene from grass carp (Eur. J. Biochem. 270) 3017