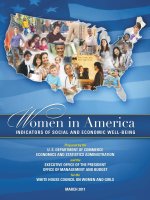
WOMEN IN AMERICA Indicators of Social and Economic Well-Being potx
Bạn đang xem bản rút gọn của tài liệu. Xem và tải ngay bản đầy đủ của tài liệu tại đây (2.03 MB, 97 trang )
final Women's covers.qxd 2/23/11 10:26 AM Page 1
final Women's covers.qxd 2/23/11 10:26 AM Page 2
WOMEN IN AMERICA
Indicators of Social and Economic
Well-Being
March 2011
Prepared by
U. S. Department of Commerce
Economics and Statistics Administration
and
Executive Office of the President
Office of Management and Budget
In cooperation with
Bureau of Justice Statistics
Bureau of Labor Statistics
Census Bureau
National Center for Education Statistics
National Center for Health Statistics
National Center for Science and Engineering Statistics
for
White House Council on Women and Girls
v2 Women in America Rpt.qxd 2/23/11 10:27 AM Page a
v2 Women in America Rpt.qxd 2/23/11 10:27 AM Page b
Table of Contents
Foreword . . . . . . . . . . . . . . . . . . . . . . . . . . . . . . . . . . . . . . . . . . . . . . . . . . . . . . . . . . . . . . . . . . . . . iii
Acknowledgements . . . . . . . . . . . . . . . . . . . . . . . . . . . . . . . . . . . . . . . . . . . . . . . . . . . . . . . . . . . . . v
Introduction
. . . . . . . . . . . . . . . . . . . . . . . . . . . . . . . . . . . . . . . . . . . . . . . . . . . . . . . . . . . . . . . . . . . . . . . . . . . . 1
I. People, Families, and Income . . . . . . . . . . . . . . . . . . . . . . . . . . . . . . . . . . . . . . . . . . . . . . . . . . 3
1. While the populations of both men and women are aging, women continue
to outnumber men at older ages . . . . . . . . . . . . . . . . . . . . . . . . . . . . . . . . . . . . . . . . . . . . . . 7
2. Both women and men are delaying marriage . . . . . . . . . . . . . . . . . . . . . . . . . . . . . . . . . . . . . 8
3. Fewer women are married than in the past . . . . . . . . . . . . . . . . . . . . . . . . . . . . . . . . . . . . . . 9
4. More women than in the past have never had a child . . . . . . . . . . . . . . . . . . . . . . . . . . . . . 10
5. Women are giving birth to their first child at older ages . . . . . . . . . . . . . . . . . . . . . . . . . . . 11
6. Women are having fewer children . . . . . . . . . . . . . . . . . . . . . . . . . . . . . . . . . . . . . . . . . . . . 12
7. Most adults live in households headed by married couples; single-mother
households are more common than single-father households . . . . . . . . . . . . . . . . . . . . . . . 13
8. Women are more likely than men to be in poverty . . . . . . . . . . . . . . . . . . . . . . . . . . . . . . . 14
II. Education . . . . . . . . . . . . . . . . . . . . . . . . . . . . . . . . . . . . . . . . . . . . . . . . . . . . . . . . . . . . . . . . . . . 15
1. Women’s gains in educational attainment have significantly outpaced those of
men over the last 40 years . . . . . . . . . . . . . . . . . . . . . . . . . . . . . . . . . . . . . . . . . . . . . . . . . . 19
2. Female students score higher than males on reading assessments and lower than
males on mathematics assessments . . . . . . . . . . . . . . . . . . . . . . . . . . . . . . . . . . . . . . . . . . . 20
3. Higher percentages of women than men age 25–34 have earned a college degree . . . . . . . . 21
4. More women than men have received a graduate education . . . . . . . . . . . . . . . . . . . . . . . . 22
5. Women earn the majority of conferred degrees overall but earn fewer degrees
than men in science and technology . . . . . . . . . . . . . . . . . . . . . . . . . . . . . . . . . . . . . . . . . . 23
6. Higher percentages of women than men participate in adult education . . . . . . . . . . . . . . . 24
III. Employment . . . . . . . . . . . . . . . . . . . . . . . . . . . . . . . . . . . . . . . . . . . . . . . . . . . . . . . . . . . . . . . . 25
1. After decades of significant increases, the labor force participation rate for
women has held steady in recent years . . . . . . . . . . . . . . . . . . . . . . . . . . . . . . . . . . . . . . . . 29
2. Unemployment rates for women have risen less than for men in
recent recessions . . . . . . . . . . . . . . . . . . . . . . . . . . . . . . . . . . . . . . . . . . . . . . . . . . . . . . . . . 30
3. More women than men work part time, and women and men have roughly
equal access to flexible work schedules . . . . . . . . . . . . . . . . . . . . . . . . . . . . . . . . . . . . . . . . 31
i
v2 Women in America Rpt.qxd 2/23/11 10:27 AM Page i
WOMEN IN AMERICA: Indicators of Social and Economic Well-Being
Table of Contents
4. Education pays for both women and men, but the pay gap persists . . . . . . . . . . . . . . . . . . 32
5. Women and men continue to work in different occupations . . . . . . . . . . . . . . . . . . . . . . . . 33
6. Female-headed families have the lowest family earnings among all family types . . . . . . . . . 34
7. In families where both husband and wife are employed, employed wives
spend more time in household activities than do employed husbands . . . . . . . . . . . . . . . . 35
8. Women are more likely than men to do volunteer work . . . . . . . . . . . . . . . . . . . . . . . . . . . 36
IV. Health . . . . . . . . . . . . . . . . . . . . . . . . . . . . . . . . . . . . . . . . . . . . . . . . . . . . . . . . . . . . . . . . . . . . . 37
1. Women have longer life expectancy than men, but the gap
is decreasing . . . . . . . . . . . . . . . . . . . . . . . . . . . . . . . . . . . . . . . . . . . . . . . . . . . . . . . . . . . . 41
2. Women are almost 40 percent more likely than men to report
difficulty walking . . . . . . . . . . . . . . . . . . . . . . . . . . . . . . . . . . . . . . . . . . . . . . . . . . . . . . . . 42
3. More women than men report having a chronic medical condition . . . . . . . . . . . . . . . . . . 43
4. Females age 12 and older are more likely than males to report
experiencing depression . . . . . . . . . . . . . . . . . . . . . . . . . . . . . . . . . . . . . . . . . . . . . . . . . . . 44
5. More than one-third of all women age 20 and older are obese . . . . . . . . . . . . . . . . . . . . . . 45
6. Less than half of all women meet the Federal physical activity guidelines
for aerobic activity . . . . . . . . . . . . . . . . . . . . . . . . . . . . . . . . . . . . . . . . . . . . . . . . . . . . . . . 46
7. In 2008, the cesarean rate was the highest ever reported in the United States . . . . . . . . . . . 47
8. Many women do not receive specific recommended preventive care . . . . . . . . . . . . . . . . . . 48
9. The share of women age 18–64 without health insurance has increased . . . . . . . . . . . . . . . 49
10. One out of seven women age 18–64 has no usual source of health care . . . . . . . . . . . . . . 50
V. Crime and Violence . . . . . . . . . . . . . . . . . . . . . . . . . . . . . . . . . . . . . . . . . . . . . . . . . . . . . . . . . . 51
1. Nonfatal violent crimes against women declined between 1993 and 2008 . . . . . . . . . . . . . 55
2. Homicides of females declined between 1993 and 2008 . . . . . . . . . . . . . . . . . . . . . . . . . . . 56
3. Nonfatal attacks on women by intimate partners declined between
1994 and 2008 . . . . . . . . . . . . . . . . . . . . . . . . . . . . . . . . . . . . . . . . . . . . . . . . . . . . . . . . . .57
4. Reported rape rates declined during the 1990s and have remained stable
in recent years . . . . . . . . . . . . . . . . . . . . . . . . . . . . . . . . . . . . . . . . . . . . . . . . . . . . . . . . . . . 58
5. Women are at greater risk than men for stalking victimization . . . . . . . . . . . . . . . . . . . . . . 59
6. Females account for a small but growing share of persons arrested for
violent crimes other than homicide . . . . . . . . . . . . . . . . . . . . . . . . . . . . . . . . . . . . . . . . . . . 60
7. Females are convicted more frequently for property crimes than for violent crimes . . . . . . . 61
8. The imprisonment rate for females has increased significantly . . . . . . . . . . . . . . . . . . . . . . 62
Detailed Sources and Notes . . . . . . . . . . . . . . . . . . . . . . . . . . . . . . . . . . . . . . . . . . . . . . . . . . . . 63
ii
v2 Women in America Rpt.qxd 2/23/11 10:27 AM Page ii
iii
Foreword
T
he White House Council on Women and Girls was created by President Obama in early 2009
to enhance, support and coordinate the efforts of existing programs for women and girls. When
President Obama signed the Executive Order creating the Council on Women and Girls, he
noted that the issues facing women today “are not just women’s issues.” When women make less than
men for the same work, it impacts families who then find themselves with less income and often
increased challenges in making ends meet. When a job does not offer family leave, it impacts both
parents and often the entire family. When there’s no affordable child care, it hurts children who wind up
in second-rate care, or spending afternoons alone in front of the television set.
The Council’s mission is to provide a coordinated Federal response to the challenges confronted by
women and girls and to ensure that all Cabinet and Cabinet-level agencies consider how their policies
and programs impact women and families. The Council also serves as a resource for each agency and
the White House so that there is a comprehensive approach to the Federal government’s policy on
women and girls.
In support of the Council on Women and Girls, the Office of Management and Budget and the
Economics and Statistics Administration within the Department of Commerce worked together to
create this report, which for the first time pulls together information from across the Federal statistical
agencies to compile baseline information on how women are faring in the United States today and how
these trends have changed over time. We believe that the information in this report is vitally important
to inform the efforts of the Council on Women and Girls—and may be equally important in providing
facts to a broad range of others who are concerned with the well-being of women and girls, from
policymakers to journalists to researchers.
This report provides a statistical picture of women in America in five critical areas: demographic and
family changes, education, employment, health, and crime and violence. By presenting a quantitative
snapshot of the well-being of American women based on Federal data, the report greatly enhances our
understanding both of how far American women have come and the areas where there is still work
to be done.
Each page of this report is full of the most up-to-date facts on the status of women. Of particular note
are the following:
■
As the report shows, women have made enormous progress on some fronts. Women have not
only caught up with men in college attendance but younger women are now more likely than
younger men to have a college or a master’s degree. Women are also working more and the
number of women and men in the labor force has nearly equalized in recent years. As women’s
work has increased, their earnings constitute a growing share of family income.
■
Yet, these gains in education and labor force involvement have not yet translated into wage and
income equity. At all levels of education, women earned about 75 percent of what their male
counterparts earned in 2009. In part because of these lower earnings and in part because
v2 Women in America Rpt.qxd 2/23/11 10:27 AM Page iii
unmarried and divorced women are the most likely to have responsibility for raising and
supporting their children, women are more likely to be in poverty than men. These economic
inequities are even more acute for women of color.
■
Women live longer than men but are more likely to face certain health problems, such as
mobility impairments, arthritis, asthma, depression, and obesity. Women also engage in lower
levels of physical activity. Women are less likely than men to suffer from heart disease or
diabetes. Many women do not receive specific recommended preventative care, and one out of
seven women age 18-64 has no usual source of health care. The share of women in that age
range without health insurance has also increased.
■
Women are less likely than in the past to be the target of violent crimes, including homicide.
But women are victims of certain crimes, such as intimate partner violence and stalking, at
higher rates than men.
Facts alone can never substitute for actions that directly address the challenges faced by women of all
ages and backgrounds. But facts are deeply important in helping to paint a picture of how the lives of
American women are changing over time and in pointing toward the actions and policies that might be
most needed. The White House Council on Women and Girls has supported Administration efforts to
ease the burden of going to college; increase the number of girls interested in science, technology,
engineering and math; and promote equal pay for women. We also fought for passage of the Affordable
Care Act, which provides health insurance to millions, and coordinated an unprecedented government-
wide effort to end violence against women and girls. Yet, we know there is much more to do. The
Council on Women and Girls is committed to raising the visibility of women’s lives, as well as thinking
strategically about how to address these challenges. Reports like this one help us to achieve that goal.
We thank those who worked on putting this report together, and are particularly grateful to the Federal
statistical agencies that regularly collect and report these data so that all Americans can better
understand the society and economy in which we live.
Valerie Jarrett Christina Tchen
Chair, Council on Women and Girls Executive Director, Council on Women
and and Girls,
Assistant to the President and Senior Advisor Assistant to the President,
and
Chief of Staff to the First Lady
iv
WOMEN IN AMERICA: Indicators of Social and Economic Well-Being
Foreward
v2 Women in America Rpt.qxd 2/23/11 10:27 AM Page iv
v
Acknowledgements
T
his report was conceived at the Office of Management and Budget to support the White House
Council on Women and Girls. To facilitate agency decision-making and priority-setting on the
basis of firm evidence, this report assembles the Federal government’s significant data and
statistical resources to present a portrait of the well-being of American women in several key areas.
The report is a product of many people’s work. The Department of Commerce’s Economics and
Statistics Administration was asked to coordinate the work and prepare the final report. Our efforts
relied heavily on the work of individuals in Federal statistical agencies who provided the data and
substantive portions of the report. Our thanks go, in particular, to the following individuals who
contributed significantly to various chapters of the report and provided the statistical content on which
this report is based.
Chapters Agencies Staff
People, Families, Census Bureau Amy Symens Smith
and Income Department of Commerce Carrie A. Werner
Martin T. O’Connell
Kristy Krivickas
Trudi J. Renwick
Laryssa Mykyta
Education National Center for Education Statistics Val Plisko
Department of Education John Ralph
National Center for Science and Lynda T. Carlson
Engineering Statistics Joan S. Burrelli
National Science Foundation Jaquelina C. Falkenheim
Rolf Lehming
Employment Bureau of Labor Statistics Tom Nardone
Department of Labor Marianne Reifschneider
Dorinda Allard
Rachel Krantz-Kent
Mary Bowler
Karen Kosanovich
Census Bureau Edward J. Welniak, Jr.
Department of Commerce
Health National Center for Health Statistics Edward J. Sondik
Department of Health and Human Services Jennifer H. Madans
Kate M. Brett
Crime and Violence Bureau of Justice Statistics James P. Lynch
Department of Justice Allen J. Beck
Donald J. Farole
v2 Women in America Rpt.qxd 2/23/11 10:27 AM Page v
WOMEN IN AMERICA: Indicators of Social and Economic Well-Being
Acknowledgements
We have also benefited greatly from the comments and suggested edits that were made by our colleagues
who reviewed this report. Their astute observations greatly enhanced our work.
We are particularly grateful for the work done by the staff at the Economics and Statistics
Administration in the preparation of this report. Jane W. Molloy coordinated the work with the data
agencies while David Beede, Beethika Khan, Francine Krasowska, and Rebecca Lehrman provided
substantive comments and edits. We also appreciate the work of James K. White and Sabrina Montes,
who assisted in editing the final product.
We also want to thank Katherine K. Wallman, Chief Statistician, Office of Management and Budget,
and Rochelle W. Martinez of her office for their help in conceptualizing this report and engaging the
statistical agencies in this collaboration.
Finally, we deeply appreciate the work of the staff in the Office of Management and Budget, for their
input and assistance. Meaghan Mann, Ariel D. Levin, Rebecca Leventhal, and Pooja Kadakia all helped
to plan, design, and edit this report.
Rebecca M. Blank Preeta D. Bansal
Acting Deputy Secretary General Counsel and Senior Policy Advisor
and Office of Management and Budget
Under Secretary for Economic Affairs Executive Office of the President
U. S. Department of Commerce
vi
v2 Women in America Rpt.qxd 2/23/11 10:27 AM Page vi
Introduction
T
his report, prepared for the White House Council on Women and Girls, presents selected
indicators of women’s social and economic well-being currently and over time. The report is
intended for a general audience, with the hope that it will be useful to policymakers, policy
analysts, journalists, policy advocates, and all those interested in women’s issues.
The indicators have been grouped into five areas of interest:
■
People, Families, and Income. This section describes various demographic characteristics and
trends in women’s marriage, living arrangements, childbearing, and poverty. The Census Bureau
is the primary source of the data (census.gov).
■
Education. This section describes levels and trends in women’s educational attainment, school
enrollment, and fields of study. The data are primarily from the National Center for Education
Statistics (nces.ed.gov).
■
Employment. This section describes levels and trends in women’s employment, earnings, and
time use. The Bureau of Labor Statistics is the main source of the data (bls.gov).
■
Health. This section describes levels and trends in women’s life expectancy, prevalence of
chronic health conditions, access to health care, and health insurance coverage. The data come
primarily from the National Center for Health Statistics (cdc.gov/nchs).
■
Crime and Violence. This section describes levels and trends in women’s victimization, crime,
and involvement in the criminal justice system. The data come primarily from the Bureau of
Justice Statistics (bjs.ojp.usdoj.gov).
Using the Document
Each section of this report consists of a two-page narrative introduction followed by a single page for
each of the indicators. Each indicator page has bullet points about the indicator, followed by a chart
illustrating some of the bullet points. References for the introductions, bullets, and charts, as well as
explanatory notes, are located in the Detailed Sources and Notes section at the end of the report.
Unless otherwise indicated, all comparisons of statistics for various subpopulations at a particular point
in time, as well as comparisons of statistics over time, are statistically significant.
Racial and ethnic data were included when they were available; however, in many instances such data
were not available. For example, racial and ethnic data about the Asian American and Pacific Islander
communities, in particular, were less available than data about the non-Hispanic White, Hispanic, and
African American populations—a data shortcoming that President Obama’s Executive Order 13515,
“Increasing Participation of Asian Americans and Pacific Islanders in Federal Programs” (October 14,
2009), is designed in part to address over time.
1
For more information, see Detailed Sources and Notes at the end of this report.
v2 Women in America Rpt.qxd 2/23/11 10:27 AM Page 1
While there is interest in the economic and demographic characteristics and needs of lesbian, gay,
bisexual and transgender individuals and families, no data are currently available from Federal data
sources, so such information is not included in this report.
Getting Additional Information
The statistical agency websites listed above and the references listed in the Detailed Sources and Notes
section at the end of the report contain a wealth of additional information about women’s social and
economic well-being. Anyone who wants additional information on these topics is strongly encouraged
to look at these resources.
2
For more information, see Detailed Sources and Notes at the end of this report.
WOMEN IN AMERICA: Indicators of Social and Economic Well-Being
Introduction
v2 Women in America Rpt.qxd 2/23/11 10:27 AM Page 2
v2 Women in America Rpt.qxd 2/23/11 10:27 AM Page 3
v2 Women in America Rpt.qxd 2/23/11 10:27 AM Page 4
I. People, Families, and Income
T
he demographic landscape of the United States has changed considerably in recent decades. Life
expectancy has increased significantly. Changing roles of women have reshaped patterns in
marriage and divorce, childbearing, living arrangements, and aspirations for education and
career development. Immigration has increased. These trends have in turn affected the age, sex, racial
and ethnic composition of the population. All these trends both affect—and are affected by—economic
growth and technological change. A comprehensive sorting out of the causes and effects of these many
demographic changes is beyond the scope of this report. However, it is clear that these complex and
multidimensional phenomena affect women and men differently.
Demographic changes have resulted in an aging population with a larger female share. Until about
1950, the population was majority male. Now, nearly 51 percent of the population is female, with four
million more females than males. The long-term trends that resulted in a female majority in the
population were driven in part by midcentury reductions in immigration (particularly by men) coupled
with life expectancy increases for women that outpaced those of men. The gender imbalance is even
larger at age 65 and older, where women have a 57 percent population share.
1
Marriage and Childbirth
Major changes have occurred in marriage and family formation patterns over the past 50 years. At the
peak of the 1946–1964 baby boom, both women and men were typically marrying in their late teens or
early twenties. The median age at first marriage has increased since the 1960s for both sexes. Women
continue to be younger than men (by about two years) when first married. At age 65 or older, 95
percent of both men and women have married at least once; however, at these older ages, three times as
many women as men are widowed.
The typical age at which women have their first child has been rising in recent decades. Since the mid-
1970s, there has been a sharp decline in the proportion of women in their twenties who have had a
child. The likelihood of a woman having her first child at age 30 or older increased roughly six-fold
from about 4 percent of all first-time mothers in the 1970s to 24 percent in 2007. Delays in marriage
and childbearing are associated with a reduction of about one child per mother by the end of the
childbearing years (in 2008, mothers had on average about 2.3 children each).
2
The trends toward delaying first marriage and childbirth coincide with an increase in schooling among
young men and women, and rising labor force participation by women. College graduates marry and
begin families several years later than their less-educated counterparts. Of women in their mid-twenties,
those without a high school diploma are three times as likely to have had a child as are women with at
least a college degree. Nevertheless, the most recent data indicate that eight out of 10 women still go on
to have children, compared to nine out of 10 women in the mid-1970s. Although there is a large
difference across education levels in the percent of women in their mid-twenties with children, this
difference is much smaller for women in their forties with children.
5
For more information, see Detailed Sources and Notes at the end of this report.
v2 Women in America Rpt.qxd 2/23/11 10:27 AM Page 5
Households and Income
Delays in marriage and childbearing are reflected in living arrangements. While married couples head
the majority of households, increasing numbers of men and women cohabit with partners or live
without a spouse or partner. Women are more likely than men to live without a spouse, especially
women age 65 and older (reflecting their higher degree of widowhood). Women who live alone have the
lowest median income of any type of household, including households with only a male who lives alone.
Similarly, households headed by women with other relatives but no spouse also have lower income levels
than households headed by men with other relatives but no spouse. Married-couple households have
higher levels of household income relative to their non-married counterparts.
Differences in poverty rates have narrowed somewhat over the last decade, although women continue to
experience higher poverty rates. While women comprise nearly half of the employed labor force, they
continue to earn less than men. Changes in household and family structure, including a rise in female
householders (with and without children), also have contributed to higher poverty rates for women.
Furthermore, older women are more likely to be poor than older men.
6
WOMEN IN AMERICA: Indicators of Social and Economic Well-Being
People, Families, and Income
For more information, see Detailed Sources and Notes at the end of this report.
v2 Women in America Rpt.qxd 2/23/11 10:27 AM Page 6
1. While the populations of both men and women are aging, women
continue to outnumber men at older ages.
7
WOMEN IN AMERICA: Indicators of Social and Economic Well-Being
People, Families, and Income
For more information, see Detailed Sources and Notes at the end of this report.
■
In 2009, a greater share of the population was
65 or older than in 1970, with women
outnumbering men in the older population.
In 2009, about 15 percent of women were 65
and older vs. 11 percent of men, compared to
11 percent and 9 percent, respectively, in 1970.
(See chart.)
■
People under age 18 account for a smaller share
of the population in 2009 than in 1970, and
males continue to outnumber females at
younger ages. The share of this age category has
fallen dramatically since 1970, from 36 percent
to 25 percent for males and from 33 percent to
23 percent for females. (See chart.)
■
Higher shares of Black (27 percent), Hispanic
(35 percent), and American Indian and Alaskan
Native (30 percent) females are under 18 years
of age, compared to 22 percent of White
females and 22 percent of Asian females in
2009. Lower shares of Black (10 percent),
Hispanic (7 percent), Asian (11 percent),
and American Indian and Alaskan Native
(8 percent) women are 65 and older, compared
to 16 percent of White women.
0%
10%
20%
30%
40%
50%
60%
70%
80%
90%
100%
Male Female Male Female Male Female
65 and older
Under 18
1970 1990 2009
Source: Census Bureau
Population by Age
(Percent Distribution by Selected Age Groups and Sex, 1970, 1990, and 2009)
18-64
v2 Women in America Rpt.qxd 2/23/11 10:27 AM Page 7
2. Both women and men are delaying marriage.
8
WOMEN IN AMERICA: Indicators of Social and Economic Well-Being
People, Families, and Income
For more information, see Detailed Sources and Notes at the end of this report.
■
Both women and men are marrying about five
years later on average than they did in 1950.
(See chart.)
■
People with more education tend to marry later
than those with less education. In 2008, college-
educated women typically married at age 30,
compared to age 26 for women without a high
school diploma. College-educated men typically
married at age 31, compared to age 29 for men
without a high school diploma.
■
Since 1950, women have typically been about
two years younger than men when first married.
(See chart.)
■
Non-Hispanic White and Hispanic women and
men tend to marry earlier than Black women
and men. The typical age of first marriage is
27 for both non-Hispanic White and Hispanic
women, and 29 for non-Hispanic White and
Hispanic men, compared to age 31 for Black
women and men.
15
19
17
21
23
25
27
29
Median Age at First Marriage
(1950–2009)
1950 1957 1964 1971 1978 1985 1992 1999 2006
Source: Census Bureau
Men
Women
v2 Women in America Rpt.qxd 2/23/11 10:27 AM Page 8
3. Fewer women are married than in the past.
9
WOMEN IN AMERICA: Indicators of Social and Economic Well-Being
People, Families, and Income
For more information, see Detailed Sources and Notes at the end of this report.
■
The percentage of adults who are married
declined between 1970 and 2009, from
72 percent to 62 percent for women and from
84 percent to 66 percent for men. In 2009,
15 percent of women and 20 percent of men
had never married, compared to 7 percent and
9 percent, respectively, in 1970. (See chart.)
■
In 2009, among those 65 and older, 44 percent
of women were married, compared to 74 percent
of men. Widowed women account for about
41 percent of women 65 and older, but only
13 percent of men 65 and older are widowed.
■
More women are widowed and divorced than
men. Never married and divorced persons have
accounted for an increasing share among both
women and men over the past four decades.
(See chart.)
■
Non-Hispanic White and Hispanic women are
much more likely to be married than Black
women (64 percent, 65 percent and 42 percent,
respectively), and much less likely to have
never married (11 percent, 18 percent and
32 percent, respectively).
Men Women Men Women Men Women
0%
10%
20%
30%
40%
50%
60%
70%
80%
90%
100%
1970 1990 2009
Source: Census Bureau
Marital Status
(Percent Distribution of the Population Age 25 and Older, 1970, 1990, and 2009)
Never married
Divorced
Widowed
Married
v2 Women in America Rpt.qxd 2/23/11 10:27 AM Page 9
4. More women than in the past have never had a child.
10
WOMEN IN AMERICA: Indicators of Social and Economic Well-Being
People, Families, and Income
For more information, see Detailed Sources and Notes at the end of this report.
■
In 2008, about 18 percent of women age 40–44
(the latter part of peak childbearing years) have
never had a child, almost double that in 1976
(10 percent). (See chart.)
■
Women in their late twenties with more
education are dramatically less likely to have
had a child than their less-educated
counterparts. Among women age 25–29 in
2008, only 19 percent of those with less than a
high school education had not had a child,
compared to 31 percent of high school
graduates and 72 percent of those with at least a
college degree. These differences are much
narrower among women age 40–44.
■
There has been a steep rise in the share of
women age 25–29 (early in their childbearing
years) who have not had a child, rising from
31 percent in 1976 to about 46 percent in
2008. (See chart.)
■
There are differences in first births associated
with race. In 2008, 53 percent of non-Hispanic
White women age 25–29 had not had a child,
compared to only 33 percent of Black women
and 31 percent of Hispanic women. However,
there is not much difference by race among
women age 40–44; 18 percent of Black and
non-Hispanic White women and 19 percent of
Hispanic women in this age group have never
had a child.
Source: Census Bureau
Women Who Have Never Had a Child
(Percent of Selected Age Groups, 1976–2008)
1976 1980 1984 19921988 2000 200820041995
40-44 Years
35-39 Years
30-34 Years
25-29 Years
0%
5%
10%
15%
20%
25%
30%
35%
40%
45%
50%
100%
v2 Women in America Rpt.qxd 2/23/11 10:27 AM Page 10
5. Women are giving birth to their first child at older ages.
11
WOMEN IN AMERICA: Indicators of Social and Economic Well-Being
People, Families, and Income
For more information, see Detailed Sources and Notes at the end of this report.
■
The share of women in their thirties among
those giving birth for the first time has risen
from 4 percent in 1970 to 22 percent in 2007;
however, women in their twenties continue to
account for the majority of first-time mothers.
(See chart.)
■
While more women in their forties are giving
birth for the first time, they account for only
one percent of first-time mothers. (See chart.)
■
The average age at which women first gave birth
in 2007 was 25, compared to 21 in 1970.
■
Over the past four decades, teenagers have
accounted for a decreasing share of women
giving birth for the first time (36 percent in
1970 compared to 21 percent in 2007). (See
chart.) The birth rate for teenagers (age 15-19)
was 43 births per 1,000 females in 2007, down
from 68 births per 1,000 females in 1970.
■
Hispanic and non-Hispanic Black women who
gave birth to their first child in 2007 were
younger than non-Hispanic White women.
The mean age at first birth was 23 years for
both non-Hispanic Black and Hispanic women,
compared to 26 years for non-Hispanic
White women.
0%
10%
20%
30%
40%
50%
60%
70%
80%
90%
100%
Source: National Center for Health Statistics
Age of Mother at First Birth
(Percent Distribution of Women Having their First Birth by Year and Age, 1970–2007)
1970 1975 1980 1985 1990 1995 2000 2007
40 and older
30-39
20-29
Under 20
v2 Women in America Rpt.qxd 2/23/11 10:27 AM Page 11
6. Women are having fewer children.
12
WOMEN IN AMERICA: Indicators of Social and Economic Well-Being
People, Families, and Income
For more information, see Detailed Sources and Notes at the end of this report.
■
Across all age groups, women currently have
fewer children than they did in 1976.
(See chart.)
■
Larger declines in the number of children per
mother have occurred among older women than
younger women. Mothers age 40–44 had given
birth to 3.4 children on average in 1976,
compared to only 2.3 children in 2008.
(See chart.)
■
In 2008, Black and Hispanic mothers had a
higher average number of children than non-
Hispanic White mothers.
■
Women with more years of schooling have
fewer children. Among mothers age 25–29,
those with less than a high school education
had given birth to 2.4 children on average,
while those with at least a college degree had
given birth to only 1.5 children on average.
Among mothers age 40–44, those with less than
a high school education had given birth to
2.9 children, while those with at least a college
degree had given birth to 2.2 children.
1.5
2.5
2.0
3.0
3.5
Average Number of Children per Mother
(Births Per Mother for Selected Age Groups, 1976–2008)
1976 1980 1984 19921988 2000 200820041995
40-44 Years
35-39 Years
30-34 Years
25-29 Years
Source: Census Bureau
v2 Women in America Rpt.qxd 2/23/11 10:27 AM Page 12
7. Most adults live in households headed by married couples; single-
mother households are more common than single-father households.
13
WOMEN IN AMERICA: Indicators of Social and Economic Well-Being
People, Families, and Income
For more information, see Detailed Sources and Notes at the end of this report.
■
Approximately three out of five American adults
(age 15 and older) reside in households headed
by married couples. (See chart.) This includes
both those who are part of the married couple
and other adults who reside in the household.
■
The share of adults who dwell in family
households headed by a single woman
(14 percent) is greater than those residing in
family households headed by a single man
(6 percent). (See chart.)
■
Adults living alone make up 13 percent of the
total population age 15 and older. Women are
slightly more likely to live alone than men
(8 percent vs. 6 percent). (See chart.)
■
Black adults are less likely than non-Hispanic
White and Hispanic adults to live in households
headed by married couples. In addition,
43 percent of Black women live in female-
headed family households, compared to
14 percent of non-Hispanic White women and
25 percent of Hispanic women.
Men Women
0%
10%
20%
30%
40%
50%
60%
70%
80%
90%
100%
Living Arrangements of American Adults*
(Percent Distribution of the Population Age 15 and Older by Household Type, 2008)
Source: Census Bureau
* Data for each type of household include all people, age 15 and older, who dwell in that particular type of household, regardless of
their relationship to the householder. For example, a 20-year-old living with 50-year-old married parents is included in this chart in
the married-couple category even if the child is single.
Living in
households
headed by:
Married
couples
Male
householder,
no spouse
Female
householder,
no spouse
Persons living
together, but
not related
Persons
living alone
v2 Women in America Rpt.qxd 2/23/11 10:27 AM Page 13
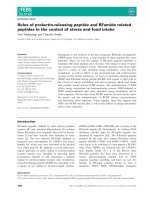
8. Women are more likely than men to be in poverty.
14
WOMEN IN AMERICA: Indicators of Social and Economic Well-Being
People, Families, and Income
For more information, see Detailed Sources and Notes at the end of this report.
■
Historically, women have been more likely to be
poor than men. Poverty rates for unmarried
female householders with children are
particularly high, and have consistently been
two or three times as high as overall male and
female poverty rates since 1966. (See chart.)
■
The income threshold below which a family is
considered to be in poverty varies by family size
and composition. For example, in 2009, a single
woman under age 65 and living alone would be
considered to be in poverty if her family income
was below $11,161. The poverty threshold for a
single mother living with two children under
age 18 was $17,285.
■
In 2009, almost 11 percent of women age 65
and older were poor, compared to 7 percent of
men age 65 and older.
■
In 2009, 28 percent of working women who
were unmarried with children had incomes
below the poverty level, compared to a poverty
rate of 8 percent among all female workers and
6 percent among male workers.
■
Black and Hispanic females are more likely to
be poor than non-Hispanic White females. In
2009, slightly more than one-quarter of both
Black females (28 percent) and Hispanic
females (27 percent) had family incomes below
the poverty line, compared to 11 percent of
White, non-Hispanic females.
0%
50%
40%
60%
20%
10%
30%
70%
80%
90%
100%
Percent in Poverty
(Percent of Each Group with Incomes Below Poverty Line, 1959–2009)
1959 1966 1973 19871980 1994 20082001
Female householders
(no husband present)
with children under
18 years
Source: Census Bureau
Male
Female
v2 Women in America Rpt.qxd 2/23/11 10:27 AM Page 14
v2 Women in America Rpt.qxd 2/23/11 10:27 AM Page 15