The Impact of Education on Economic Growth Theory, Findings, and Policy Implications potx
Bạn đang xem bản rút gọn của tài liệu. Xem và tải ngay bản đầy đủ của tài liệu tại đây (220.48 KB, 30 trang )
The Impact of Education on Economic Growth
Theory, Findings, and Policy Implications
Brian G. Dahlin
Duke University
2
I. Introduction
In June of 2002, President Bush announced a doubling of funds for the African
Education Initiative. Total U.S. spending on basic education in Africa will total $630
million over the next five years. Motivation for such an increase lies in the belief that the
education of children in developing countries “is key to future economic growth and
lasting democracy, leading to greater stability and improved standards of living.”
1
Many
growth models include education and offer predictions as to the implications of education
policy changes on macroeconomic performance. Some empirical analyses of the growth
rate of real per capita GDP in the U.S. suggest that years of secondary and higher
schooling contribute positively toward economic growth.
2
Such research is of particular
importance as developed nations continue taking a more active role in the development of
third-world nations, as growth models offer predictions useful in aiding policy decisions.
1
Office of the Press Secretary, The White House. (June, 2002). Fact Sheet: Africa Education Initiative.
2
Barro, Robert J. and Sala-i-Martin, Xavier. (1995). Economic Growth. McGraw-Hill, New York. pp. 424-
432.
3
II. Objective
The goal of this paper is to survey the literature on education and its effects on
economic growth. Over the last several decades, there have been a number of new
developments and findings on this subject in both the micro and macro literature. Several
recent models with policy implications are discussed. Where possible, we link the policy
implications to growth-related issues faced by developing countries. Throughout this
survey of the literature, we present mathematical concepts in a way that is accessible to
less technical readers.
III. Overview
Economics offers a variety of theories and models relating education to economic
growth. Education increases an individual’s earning potential, but also produces a “ripple
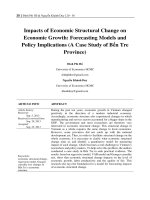
effect” throughout the economy by way of a series of positive externalities. Katharina
Michaelowa of the Hamburg Institute for International Economics diagrams the impact of
education at both micro and macro levels as follows:
4
Source: Michaelowa, Katharina. (2000) “Returns to Education in Low Income Countries: Evidence for Africa.”
/>
Direct and indirect effects of education are shown in the above diagram. Key
assumptions underlying the diagram are: 1) education results in learning – it is not merely
a “signal” of worker quality (see section V for more on signaling); 2) demand within the
economy is sufficient to consume higher levels of output resulting from productivity
gains; 3) monetary and fiscal policy are sufficiently responsive to meet the demands of a
growing economy (to prevent deflation, the money supply grows at a rate equal to the
growth rate of GDP).
Direct effects of education such as increased individual wages follow from the
assumption that education results in learning that increases a worker’s productivity. If
workers are paid the value of their marginal product, it follows that better-educated
workers should earn higher wages.
Externalities and other indirect effects related to education,
health, and population growth:
higher educ. attainment and achievement of children
better health and lower mortality of children
better individual health
lower number of births
Lower population
growth and better
health of population
(and labor force)
Education
Increased earnings
(higher productivity)
Increased earnin
g
s of nei
g
hbors
Partici
p
ation in the labor force
Hi
g
her
g
rowth
Increased labor force
micro macro
Figure 1
5
In addition to the direct effects of education, a number of indirect effects have
emerged in the literature.
3
Studies have found a “positive effect of [a] mother’s
schooling on her children’s health in developing countries.”
4
Healthier children may be
more productive than unhealthy children and the result may be higher performance in
school. Similarly, better-educated parents tend to make more informed decisions with
regard to family planning – the result being smaller family sizes.
5
Smaller family size
enables more parental involvement in each child’s education (as parents’ time is scarce).
Increased parental involvement in a child’s education may enable the child to perform
better in school and encourage him or her to pursue additional years of education.
An individual’s choice to pursue further education may improve the earnings of
his or her neighbors. Michaelowa offers the example of an educated farmer who
implements new agricultural techniques. Neighbors may observe the new methods used
by the educated farmer and imitate them. Learning through observation is a mechanism
by which such educational benefits may be spread within a community.
6
To quantify the private rate of return to education, we may regress individuals’
incomes on their level of education and other characteristics.
7
Linking a nation’s growth
3
For additional examples of externalities related to education beyond those mentioned here, we suggest:
Heckman, James and Klenow, Peter. (1997) “Human Capital Policy.”
/>
4
Michaelowa, Katharina. (2000) “Returns to Education in Low Income Countries, Evidence for Africa.”
Michaelowa references the following studies supporting positive correlations between parental education
and children’s health: Glewwe (1999), Schultz (1993), Hobcraft (1993), and Thomas, Strauss and
Henriques (1991).
5
Ibid. Michaelowa references the following studies with regard to the impact of education on family
planning: Wolfe and Behrman (1984), Schultz (1989), and Behrman (1990).
6
Foster, Andrew. and Rosenzweig, Mark. (1995) “Learning by Doing and Learning from Others: Human
Capital and Technical Change in Agriculture.” Journal of Political Economy, v.103, No. 6, pp. 1176-1209.
7
Here we refer to “education” as a quantifiable individual characteristic – methods used to quantify various
aspects of education are discussed in section IV.
6
rate of GDP to its stock of human capital is more difficult.
8
Some empirical studies find
human capital to be positively related to the growth rate of GDP; other studies find the
linkage to be insignificant.
9
Some disagreement in the results of empirical studies arises from different
measures of education and different definitions of human capital. Before reviewing the
literature on education and economic growth, we discuss methods used to measure
education.
IV. The Measurement of Education
An ideal measure of an individual’s education should capture several components,
including the number of years spent in school, the quality of the schooling, the nature of
the curriculum, and the student’s effort. Creating a measure that accurately quantifies
these components is difficult. Of these components, an individual’s years of schooling is
the only directly observable characteristic. We may indirectly measure aspects such as
educational quality and individual ability and effort through standardized tests; however,
there is disagreement regarding the reliability of such tests.
10
In microeconomic analysis that studies the variation in wages as a function of
education, individuals’ years of schooling is frequently used as an independent variable.
This method has advantages in that such data are readily available in developed countries,
8
“Human capital” has many interpretations and is discussed in greater detail in section IV.
9
Positive effects were found in the following studies: Mankiw, Romer, and Weil (1992), Levine and Renelt
(1992), Barro (1991). Insignificant effects were found in the following studies: Pritchett (1997), Islam
(1995), Caselli, Esquivel, and Lefort (1996).
10
The existence of an industry focused on standardized test preparation, racial disparities in test scores, and
concerns over test-retest reliability have led to criticism of the use of standardized tests in recent years. For
further information, see:
Gordon, Edmund. (1995) “Toward an Equitable System of Educational Assessment.” Journal of Negro
Education, Vol. 64, No. 3, pp. 360-372.
7
but it does not account for differences in the quality or type of education received.
Alternatively, individuals may be classified by highest degree completed. This measure
also has problems; for example, an individual nearly finished with college is counted as a
high school graduate.
In macroeconomic analysis, economists often include a variable for human
capital. Because human capital encompasses a range of characteristics such as education,
work experience, and health, it is extremely difficult to directly measure human capital.
11
Any measure of a country’s aggregate human capital must have the following
characteristics: 1) it must be comparable across countries; 2) it must address the broad
range of criteria that comprise human capital; 3) it must include elements of human
capital for which data are available or estimable.
An extensive literature discusses, proposes, and computes measures of human
capital.
12
As the workforce’s education is a key component of an economy’s human
capital, average years of education within the workforce may serve as a component of an
estimate of an economy’s human capital. The use of averages, however, hides the
distribution of educational attainment, which may affect an economy’s growth potential.
An economy in which most individuals have a basic level of schooling may grow faster
than one in which a minority of individuals have advanced educations while the
remainder of the population has little to no education – as positive household-level
externalities of education benefit a greater number of people in the former case.
11
Shupp, Frank. “Income distribution and endogenous growth: A review with an application to South
Africa.”
12
For examples of various measures of human capital, see the following:
Abowd, John, et al. (Aug. 2002) “The Measurement of Human Capital in the U.S. Economy.”
Jeong, Byeongju. (Feb. 2001) “Measurement of Human Capital Input across Countries: A New Method and
Results.”
8
In estimating an economy’s human capital, corrections for differences in
educational quality again raise difficulties. Suggested quantitative measures of quality
include “costs per student, library expenditures, number of earned doctorates among
faculty and administrators … [and] student-faculty ratios.”
13
No consensus exists
regarding the ideal combination of such measures in the formation of an index of
educational quality. For example, a recent study found that per-pupil spending is a poor
proxy for and index of school quality.
14
Alone, none of these measures provides much
insight into the quality of education – a low student-faculty ratio, for instance, says
nothing about faculty’s ability to teach.
Techniques used to measure the education of individuals and the aggregate human
capital of an economy are imperfect. Disagreement among researchers as to the “best”
measure of various aspects of education and human capital makes it more difficult to
compare the findings of empirical studies to determine the true impact of education on
individuals’ incomes and economies’ growth rates.
V. Microeconomic Theory
Microeconomic analysis attempts to determine the effect of education on an
individual’s wage. People invest in education up to the point where the marginal cost of
additional education equals its marginal benefit. As an investment in human capital, a
year of schooling produces a financial return by raising an individual’s income once he or
13
Conrad, Clifton and Pratt, Anne. (1985) “Designing for Quality.” Journal of Higher Education, Vol. 56,
Issue 6. pp. 601-622.
14
Hanushek, Eric. (1996) “Measuring Investment in Education.” The Journal of Economic Perspectives,
Vol. 10, Issue 4. pp. 9-30.
9
she enters the workforce. Following is a model that considers education to be an
investment in human capital.
The Mincerian Wage Equation:
The Mincerian wage equation is a popular model for analyzing how an
individual’s education and experience affect his or her wage. A basic assumption of the
model is that all years of education generate an equal rate of return to the student – that
is, kindergarten is just as important as a year of college. This assumption implies a linear
relationship between the log of earnings and the number of years of education.
15
Second,
we assume that the cost of an additional year of education equals the lost wages one
might earn in that time. Finally, no accounting exists in this model for the quality of
education received.
Since this model views education as an investment in individual human capital,
individuals choose how many years of schooling to pursue with the goal of maximizing
the present value of lifetime earnings. Mathematically, agents choose s, (the number of
years of education) to maximize:
16
Objective function:
() ()
∑∑
+==
+
+
+
=
L
s
s
r
sM
r
PV
11
1
)(
1
τ
τ
τ
τ
τ
γ
(1)
Subject to:
Ms Msg s
τ
τ
() () ( )
=
−
(2)
The interest rate is denoted as r. The objective function represents the present value of
lifetime income. The first term in the objective function captures the present value of an
15
Krueger, Alan and Lindahl, Mikael. (December 2001) “Education for Growth: Why and for Whom?”
Journal of Economic Literature, Vol XXXIX pp. 1101-1136.
16
Wagstaff, Adam. (2001) “Deriving the Mincerian Earnings Function.” University of Sussex.
/> pp. 48-54.
10
individual’s income while he or she is a student. If we assume that students could only
have earned income had they not been in school, γ becomes zero and this first term may
be ignored. The second summation in the objective function represents the discounted
value of lifetime earnings from the time the agent begins employment until the end of the
planning horizon, denoted as L. Income in period τ is determined by M
τ
(s), a function of
education, experience, and ability (see derivation in next section). An understanding of
M
τ
(s) is crucial to understanding the Mincerian model. As s represents the agent’s years
of schooling, M(s) must be increasing in s. The equation for M
τ
(s) contains a second
term, g(τ - s), which captures the effect of experience, (τ – s), on a worker’s wage in
period τ. The function g(.) is non-increasing in s, as less schooling leads to greater work
experience in any given period τ.
Mathematical Derivation:
17
Substituting the constraint for M
τ
(s) in the objective function, we have:
()
()
() ()
+
−
++
+
+
+
+
=
−sLs
r
sLg
r
g
r
g
r
sM
PV
1
)(
1
)2(
1
)1(
1
)(
2
(3)
Rewriting (3) with summation notation results in the following:
∑
−
=
++
=
sL
i
is
r
ig
r
sM
PV
1
)1(
)(
)1(
)(
(4)
Defining a new function, G(.), we obtain equation (5):
()
∑
−
=
+
≡−
sL
i
i
r
ig
rsLG
1
)1(
)(
,
17
We follow the derivation outlined in Wagstaff (see previous footnote) that offers an excellent, though
more technical discussion of the Mincerian wage equation.
11
),(
)1(
)(
rsLG
r
sM
PV
s
−
+
= (5)
Taking the log of equation (5), we have:
(
)
rsLGsrsMPV ,ln)1ln()(lnln
−
+
+
−
= (6)
Approximating
)1ln( r+ by r, we obtain the following relationship:
18
(
)
rsLGrssMPV ,ln)(lnln
−
+
−
≈ (7)
If we assume that r is fairly large, and that s is small compared to L (meaning that
education carries a high rate of return, and that the fraction of our lives spent in school
versus that of work is small), the correlation between
(
)
rsLG ,
−
and s is assumed to be
minimal. Thus,
()
rsLG ,ln − may be regarded as a constant and we may rewrite the
relationship expressed in (7) as below.
+
−
≈ rssMPV )(lnln constant (8)
Individuals with higher ability may have a higher marginal benefit to additional schooling
in terms of generating income. Ability differences can cause the present value of lifetime
income to vary across individuals (since investment decisions are made at the margin, we
expect higher-ability individuals to invest more in education). Solving (8) for )(ln sM
and replacing
PVln with ε (an error term that captures individual differences in the
present value of lifetime income that are consequences of ability differences) we obtain:
ε
+
+
= rsconstantsM )(ln (9)
Equation (9) relates an individual’s starting salary (that is, upon entering the workforce
with no work experience) to his or her years of schooling and ability. We may also
18
The approximation rr =+ )1ln( increases in accuracy as 0→r . It remains a close approximation for
values of r such that
2.0<r (interest rates beyond this magnitude are unusual).
12
develop a wage equation that relates a worker’s wage in any period τ to his or her years
of schooling, ability, and work experience. Equation (2) expresses the wage in period τ
as a function of the starting salary )(sM and work experience. Having solved
for )(ln sM , it is straightforward to use the relationship expressed in equation (9) with the
structure of equation (2) to find a wage equation for any period τ.
Taking the log of equation (2), we see that:
)(ln)(ln)(ln sgsMsM
−
+
=
τ
τ
(10)
Finally, substituting (9) into (10) for )(ln sM , we have:
ε
τ
τ
+
−
+
+
= )(ln)(ln sgrsconstantsM (11)
Equation (11) determines income in period τ as a function of years of education, years of
work experience, and ability.
Interpretation and Empirical Evidence:
The slope, r, in equation (11) represents the rate of return to a year of education.
According to this model, education adds to a student’s knowledge and human capital,
thereby allowing him or her to find higher-paying employment upon entering the
workforce. In contrast to the Mincerian model, Spence’s signaling model considers the
possibility that education is purely a signal of ability.
19
Spence’s model assumes that
education adds nothing to an individual’s human capital; rather, the educational system
serves as a filter through which the most able students pass. As a result, the possession of
more education “signals” a worker’s quality in the job market. While there are various
19
Spence, Michael. (Aug. 1973) “Job Market Signaling.” The Quarterly Journal of Economics, Vol. 87,
No. 3. pp. 355-374.
13
interpretations of education’s effect on an individual’s human capital, Krueger and
Lindahl note that “definitive answers to these questions are not available, although the
weight of the evidence clearly suggests that education is not merely a proxy for
unobserved ability.”
20
Most researchers agree that Mincerian estimates of the return to investment in
education tend to underestimate (or at the very least not overestimate) its true value. This
tendency toward downward-biased estimates is in part the result of two sources of
simultaneity bias within the Mincerian model.
21
First, since the error term reflects individual ability, it is positively correlated with
an individual’s choice of years of schooling. Second, individuals make their choice of
schooling based on the knowledge of the earnings function.
22
Both cases are violations
of the OLS assumption that the independent variable (years of schooling) is exogenously
determined. Researchers attempt to correct this problem through the use of instrumental
variable techniques. Harmon and Walker propose to “rely on exogenous changes in the
educational distribution of individuals caused by the raising of the minimum school-
leaving age … to provide instruments for schooling.”
23
Their work, as well as that of
20
Krueger, Alan and Lindahl, Mikael. (December 2001) “Education for Growth: Why and for Whom?”
Journal of Economic Literature, Vol XXXIX pp. 1101-1136.
21
Criticism of the Mincerian wage equation regarding the difficulty of overcoming simultaneity bias is
primarily a matter of statistics; the equation itself is not invalidated, rather, simultaneity bias makes the
accurate estimate of the private rate of return to education more challenging.
22
Wagstaff, Adam. (2001) “Deriving the Mincerian Earnings Function.” University of Sussex.
/> pp. 48-54.
23
Harmon, Colm and Walker, Ian. (Dec. 1995) “Estimates of the Economic Return to Schooling for the
United Kingdom.” The American Economic Review, Vol. 85, No. 5. pp. 1278-1286.
14
their contemporaries, supports the notion that the true return to education may be twice
that found through OLS estimation of the Mincerian wage equation.
24
An ongoing examination of the rates of return to education throughout the world
has been published throughout recent decades by George Psacharopoulos, applying the
Mincerian model to the data of 61 countries.
25
His methodology does not account for
simultaneity bias; rather, standard OLS is applied (likely underestimating the rate of
return to education, as discussed above). However, if we are only interested in the
relative differences between rates of return to education across countries, not the explicit
values of the returns themselves, Psacharopoulos’ results remain valuable.
Psacharopoulos’ findings are summarized in the following statements:
26
• The rate of return tends to be higher in low-income countries.
• Primary education makes the most valuable contribution to an individual’s
expected income in developing countries.
• The rate of return declines with the level of schooling and the country’s per capita
income.
• Investment in girls’ education tends to yield a higher rate of return than
investment in boys’ education.
• Among those in the labor force, the return to educated people is generally higher
in the private, competitive sectors than in the public sector.
24
For further reference, see Card (1993), Butcher and Case (1994), Ashenfelter and Krueger (1994), and
Ashenfelter and Zimmerman (1993). Variations of the IV technique are applied, the conclusions of which
support Harmon and Walker’s suggestion that the OLS estimate is downward biased.
25
Psacharopoulos, George. (1985) “Returns to Education: A Further International Update and
Implications.” The Journal of Human Resources, Vol. 20, No. 4. pp. 583-604.
(Psacharopoulos updated his study using more recent data in 1994, the results of which are consistent with
those of his previous research.)
26
Ibid.
15
These findings support diminishing individual rates of return to education.
Students in developing countries have, on average, fewer years of schooling than their
counterparts in developed nations. This lack of education among students in poor
countries suggests these students should receive higher returns to education.
Psacharopoulous’ empirical results support this intuition, as the “returns to any level of
education are highest in Africa and lowest in the advanced industrial countries.”
27
Similar intuition may explain the higher rate of return to girls’ education. Particularly in
developing countries, girls’ education lags well behind that of boys. For example,
Burkina Faso, Chad, and Niger had girl-to-boy ratios at the primary school level of
approximately 2:3 during the last decade.
28
Worse, Afghanistan’s ratio is less than 1:2
over the same period.
Policy Implications:
The Mincerian model seeks to find the private rate of return to education, not its
social rate of return. It is important to distinguish between the two, as the latter provides
a measure of the aggregate return to investment in education. From a policy perspective,
we may be more interested in the social rate of return to education, as it considers effects
of education on society that cannot be estimated through individual wage equations.
Examples of such effects are: 1) lower government expenditures on health and human
27
Psacharopoulos, George. (1985) “Returns to Education: A Further International Update and
Implications.” The Journal of Human Resources, Vol. 20, No. 4. pp. 583-604.
28
United Nations Department of Economic and Social Affairs
Girl-to-boy ratios are more disparate at secondary and higher levels of education in developing nations.
16
services;
29
2) faster rates of innovation within industry; 3) more informed voting choices
among the electorate.
30
Private rates of return to education are still useful in the policymaking arena.
Consider a local government seeking ways to improve the economic status of its
constituents through education.
31
Assuming a low initial level of educational
achievement within this community, government would be wise to focus its spending on
raising the number of children that complete primary school. This is not to say that
secondary and higher education should be ignored; rather, that the greater individual rate
of return to primary schooling is a more fruitful investment with regard to individuals’
incomes. Subpopulations within the community exhibiting lower average levels of
educational attainment should receive more education, again due to the higher rates of
return to education within such groups.
32
In idealized examples such as that of the small community described above,
Psacharopoulous’ findings lend evidence in support of greater educational equality as a
means to enhance aggregate well-being. Maximizing aggregate well-being in such a case
requires that the marginal benefit of education be equalized across all individuals; thus,
there should be no inequity with regard to access to education.
29
As shown in figure 1 and discussed on p. 4, parental education is positively correlated with childrens’
health. Education may indirectly decrease the average consumption of health services, thus reducing
government expenditures on publicly-funded health care.
30
Krueger, Alan and Lindahl, Mikael. (Dec. 2001) “Education for Growth: Why and for Whom?” Journal
of Economic Literature, Vol XXXIX pp. 1101-1136.
31
The government’s goal in this example is to maximize the sum of individuals’ expected present value of
lifetime income. Additional simplifying assumptions for the sake of our discussion include: 1) full
employment and a flexible job market; 2) no wage discrimination based on characteristics such as race or
gender; 3) a government that is concerned solely with the aggregate well-being of its constituents; 4) the
absence of a private market for education; 5) a population of like-minded individuals – students of equal
education levels receive equal marginal benefit from increases to the present value of their lifetime
incomes; 5) all externalities of education benefit individuals in the same way.
32
Recall the higher rates of return to education for girls vs. boys as found in Psacharopoulous’ study. The
implications of diminishing rates of return to education may be applied to any educationally disadvantaged
group.
17
Summary:
The Mincerian wage equation is a useful tool for predicting an individual’s
earnings. We have shown that empirical analyses utilizing the model produce findings
largely consistent with intuition. The Mincerian wage equation’s focus on private returns
to investment in education renders it of limited use in the policymaking arena. Attempts
have been made to generalize the Mincerian equation to estimate an economy’s
geometric mean wage as a function of the labor force’s mean education.
33
As we turn to
macroeconomic literature and its assessment of the relationship between education and
economic growth, we shall examine the results of such “macro-Mincer” models prior to
current endogenous growth models that incorporate human capital.
VI. Macroeconomic Theory
Macroeconomic analysis of growth considers the rate of change of per capita
GDP. Using aggregate data to examine the relationship between education and growth in
a macroeconomic framework, we can better grasp the effects of human capital
externalities that affect growth.
34
These externalities are not evident in individual
estimates of the wage equation; however, in the aggregate, their net impact may be more
apparent. Determining the effects of human capital externalities on growth motivated
Heckman and Klenow’s recent estimate of the “macro-Mincer” wage equation that we
shall discuss shortly.
33
Krueger, Alan and Lindahl, Mikael. (Dec. 2001) “Education for Growth: Why and for Whom?” Journal
of Economic Literature, Vol XXXIX pp. 1101-1136.
34
Recall Michaelowa’s diagram in figure 1 and the subsequent discussion of growth-related externalities of
education.
18
We shall consider in greater detail research into new growth theory, an outgrowth
of the traditional neoclassical model. The neoclassical growth model, developed in the
mid-20
th
century, is a cornerstone of economic analysis; however it fails to distinguish
between human and physical capital. In the 1990s, researchers extended the neoclassical
model in ways that “emphasize government policies and institutions and the
accumulation of human capital.”
35
Much recent literature on growth seeks to answer the
question of “why advanced economies … can continue to grow in the long run despite
the workings of diminishing returns in the accumulation of physical and human
capital.”
36
Extensions of these models remain at the frontier of current research into
growth.
The Macro-Mincer Equation:
The macroeconomic version of the Mincerian wage equation aggregates across
individuals on an annual basis by using means of each variable. Below is a simple
example of such an equation:
37
τττττ
εββ
++= SY
g
10
ln (12)
Equation (12) expresses the log of the geometric mean wage (
g
Y
τ
) as a function of mean
worker education (
τ
S ).
38
Observations are made annually (denoted by subscript τ).
By aggregating individual characteristics through the use of the macro-Mincer
model, Heckman and Klenow seek the impact of human capital externalities on per-
35
Barro, Robert J. (2002), “Education as a Determinant of Economic Growth.” Edward P. Lazear (ed.)
Education in the Twenty-first Century, Palo Alto, The Hoover Institution, pp. 9-24.
36
Ibid.
37
Krueger, Alan and Lindahl, Mikael. (Dec. 2001) “Education for Growth: Why and for Whom?” Journal
of Economic Literature, Vol XXXIX pp. 1101-1136.
38
The definition of mean worker education is subject to various interpretations as outlined in section IV.
19
capita GDP growth. As “most economies … subsidize human capital investments
substantially,” the objective of Heckman and Klenow’s application of the macro-Mincer
equation is to determine whether economies’ human capital investment decisions are
efficient.
39
They define the efficiency of such investment decisions as follows:
Underinvestment in human capital occurs when the social “net present value” (NPV) of
investing in human capital exceeds the private NPV of investing in human capital…
Subsidies are justified if there is a wedge between private and social NPV in the absence
of subsidies.
40
To determine the size of a potential wedge between the social and private rates of return
to education, Heckman and Klenow modify the Mincerian equation to allow for human
capital externalities from education. This modification is based on the idea that
“controlling for own schooling, an individual worker may earn higher wages … the
higher the level of schooling of other workers in the country.”
41
Comparing the results of
their own cross-country macro-Mincer regressions to cross-individual microeconomic
estimates of the Mincerian wage equation, Heckman and Klenow examine the magnitude
of human capital externalities resulting from education.
Heckman and Klenow make several adjustments in their analysis to account for
several concerns regarding differences in countries’ per capita physical capital. They
believe that rates of return to education are likely to be positively correlated with an
economy’s stock of physical capital. Likewise citizens of countries with longer life
expectancies have greater incentive to pursue additional years of schooling.
42
After
adjusting for these concerns, they find a rate of return to schooling of 10.6% in 1985 and
7.0% in 1960 – the former comparable to the 9.9% average return to schooling found in
39
Heckman, James and Klenow, Peter. (1997) “Human Capital Policy.”
/>
40
Ibid.
41
Ibid.
42
Ibid.
20
Psacharopoulos’ cross-country study.
43
Heckman and Klenow interpret these results as
providing no evidence either for or against human capital externalities.
44
Heckman and Klenow estimate that current levels of U.S. government subsidies
for higher education are efficient if the total rate of return to education (social plus
private) is roughly 30% greater than the private rate of return.
45
Taking Psacharopoulos’
9.9% return to schooling as an estimate for the private rate of return to education, they
estimate that the total rate of return to education should be 12 to 13%. As their highest
estimate is short of this range, the argument may be made that the U.S. government
overly subsidizes higher education.
The results of Heckman and Klenow’s study suggest that education serves more
than a signaling purpose. This conclusion is drawn from the fact that the macro-Mincer
coefficient is not significantly lower than micro-Mincer estimates – under the signaling
model, the macro-Mincer estimate should be much smaller than the micro estimate
because education is assumed to provide negligible benefit to employee productivity.
46
New Growth Theory:
By adding a research and development sector to the neoclassical growth model
such that agents must allocate resources between producing goods and producing
knowledge, the neoclassical model is generalized so that decisions to pursue knowledge
are now endogenous. Before proceeding with our discussion of new growth theory, it
should be noted that there exist earlier attempts in the literature to make technology an
43
Heckman, James and Klenow, Peter. (1997) “Human Capital Policy.”
/>
44
Ibid.
45
Ibid.
46
Ibid.
21
endogenous component of growth models. Arrow’s learning by doing model, in which
new knowledge may be generated as a side effect of the production of capital or goods,
was published in 1962.
47
In Uzawa’s model, published several years later, investment in
human capital induces technological progress.
48
We return to new growth theory, which shall be the remaining focus of our
discussion due to its popularity and the significant attention it has received in the
literature. First we look at a simplified example of a new growth model that does not
distinguish between physical and human capital. We shall discuss (but not derive) the
more general case of the model incorporating human capital.
49
Assuming (for simplicity)
a Cobb-Douglas production function, output at time τ may be represented as:
50
α
ττ
α
ττ
−
−−=
1
])1([])1[( LaAKaY
LK
10
<
<
α
(13)
In the above equation,
K
a represents the fraction of the capital stock used in the research
sector, while (1-
K
a ) represents the fraction of the capital stock used in goods production.
Likewise,
L
a represents the fraction of the labor force used in the research sector, while
(1-
L
a ) represents the fraction of the labor force used in goods production.
τ
K represents
the capital stock at time τ,
τ
L represents the labor force at time τ, and
τ
A represents
technology (which can be thought of as knowledge and ideas, therefore encompassing
human capital) at time τ.
47
Arrow, Kenneth J. (1962), “The Economic Implications of Learning by Doing.” Review of Economic
Studies, 29 (June): pp. 155-173.
48
Uzawa, Hirofumi. (1965) “Optimum Technical Change in an Aggregative Model of Economic Growth.”
International Economic Review, 6 (January): pp. 12-31.
49
A generalized endogenous growth model incorporating human capital is presented in:
Romer, Paul. (1990) “Endogenous Technological Change.” Journal of Political Economy, 98 (October,
Part 2): S71-S102.
50
The assumption of a Cobb-Douglas production function is a simplification of the original model
presented in Romer (see previous footnote). This simplification does not change the model’s main
implications.
22
Since the level of technology is determined within the model, we need to consider
how the economy’s allocation of inputs (labor and capital) affects the growth rate of
technology. The Cobb-Douglas nature of this model allows us to write the time
derivative of
τ
A as follows:
51
θ
τ
γ
τ
β
ττ
ALaKaBA
LK
)()(=
&
(14)
,0>B
,0≥
β
0≥
γ
Equation (14), the rate of change of technology, may be thought of as a production
function for technology that models the return to investment in research and
development. B is an exogenous shift parameter we may modify to account for changes
in the rate of success of research and development (we may assume it to be equal to one
for simplicity). The other variables remain defined as in equation (13). θ plays an
important role in the model. It captures the effect of existing knowledge on the
production of new knowledge. There is no constraint on the range of θ. If past
knowledge offers the necessary foundation upon which to discover new knowledge, then
θ is positive. On the other hand, it may be easier for society to make simple discoveries
first, but building on these discoveries may be difficult. In this case, θ is negative.
In this model the production function for technology need not exhibit constant
returns to scale. Romer notes that depending on the level of interaction between
researchers and fixed setup costs inherent in research, diminishing returns in the
production of technology is a possibility.
52
A scenario in which such diminishing returns
might occur is one in which poor interaction between universities leads to the same
51
Romer, David. Advanced Macroeconomics. New York: McGraw-Hill, 2001. p.100.
Romer’s text offers a thorough discussion of new growth theory; see chapter 3 for a rigorous presentation
of the model in various contexts. We follow Romer’s setup throughout our discussion.
52
Ibid.
23
discovery at separate locations over the same period of time – as each party is oblivious
to the existence of the other’s research, twice the necessary amount of resources (labor
and capital) are exhausted toward the pursuit of the same goal. By the opposite
argument, increasing returns to scale in the production of technology is possible through
high levels of interaction between researchers. The sharing of ideas may have a
synergistic effect on the production of technology. Romer focuses his discussion of non-
constant returns to scale on the excludability of technological advances. He cites patent
laws (and their enforcement) as an institution through which knowledge becomes
excludable – lessening the returns to scale in the production of technology. If technology
can be patented, other firms may invest resources to reverse engineer the patented
technology in order to enter the market.
53
This wastes resources, as it amounts to re-
inventing the wheel.
54
A key difference between new growth theory and the neoclassical growth model
is that increasing or decreasing returns to scale within the production function for
technology allows net increasing, decreasing or constant returns to scale of the produced
factors (capital and technology), within the production of goods.
55
The neoclassical
model assumes constant returns to scale in production functions.
We make several additional assumptions regarding this model for the sake of
simplicity: 1) the savings rate is exogenous and fixed; 2) capital does not depreciate; 3)
the rate of population growth is exogenous. These assumptions are exhibited in the time
derivatives for capital and labor:
53
For example, patent restrictions on IBM’s BIOS in the 1980s forced third-party vendors to reverse
engineer this key component of computer hardware before they were able to enter the PC market. See:
/>
54
Romer, David. Advanced Macroeconomics. New York: McGraw-Hill, 2001. p.116.
55
Ibid. p.109.
24
ττ
sYK =
&
(15)
ττ
nLL =
&
0≥n (16)
Equation 12 is the equation for capital accumulation at time
τ. Capital grows by the rate
of savings,
s, times the output of goods in period τ,
τ
Y . Equation 13 stipulates that the
labor force grows each period by a nonnegative fraction,
n.
Equations (13) through (16) characterize this simple model and demonstrate its
basic features – namely, that technological progress follows from agents’ investment
decisions.
56
In the general case of the model there are four basic inputs: 1) capital; 2)
labor; 3) human capital; 4) a technology index.
57
Romer’s general model treats human
capital as “a distinct measure of the cumulative effects of activities such as formal
education and on-the-job training.”
58
Romer distinguishes human capital (
H) from A, the technology parameter, in that
H represents knowledge that is rival, while A indexes an economy’s nonrival technology.
The research sector in this model is analogous to the example given in equation (14) save
for the addition of human capital as an input into the production function for new
knowledge. To simplify the dynamic analysis of the model and rule out “an analysis of
fertility, labor force participation, or variation in hours worked per worker,” Romer
assumes that the supply of labor is constant.
59
Romer also assumes the aggregate supply
56
Romer discusses this simplified model in greater detail. For further reference, see:
Romer, David. Advanced Macroeconomics. New York: McGraw-Hill, 2001. pp.107-114
57
Romer, Paul. (1990) “Endogenous Technological Change.” Journal of Political Economy, 98 (October,
Part 2): S71-S102.
58
Ibid.
59
Ibid.
25
of human capital to be fixed. This assumption is made primarily to simplify the analysis
to equilibria with constant growth rates of output.
60
Romer’s decision to simplify the model by assuming zero growth of labor and
human capital suggests the difficulty in solving general new growth models.
Acknowledging “this model cannot offer a complete explanation … because it treats the
stock of
H (and of L) as given,” Romer’s model nevertheless serves as a starting point for
more recent research in endogenous growth theory that allows the human capital stock to
vary.
61
Among the findings in Romer’s model is that “too little human capital is devoted
to research.” The nonexcludability of additional knowledge means that the increased
productivity of researchers resulting from an increase in
A is not included in the price of
technology. As a result of this wedge between the market price and the true marginal
value of technology, factors involved in the production of technology are
undercompensated – among these is human capital.
62
Undercompensation of human capital reduces the rate of economic growth, as its
decreased compensation reduces the availability of human capital in the research sector.
As Romer’s model assumes a fixed supply of human capital, the wedge in the research
sector does not decrease the aggregate supply of human capital; rather, it induces human
capital to shift away from the research sector. Given a more general model allowing the
endogenous accumulation of human capital, Romer postulates a similar result in that
individuals would invest less in human capital, leading to a shortage of human capital in
60
Romer, Paul. (1990) “Endogenous Technological Change.” Journal of Political Economy, 98 (October,
Part 2): S71-S102.
61
Ibid. Examples of more recent models incorporating endogenously determined levels of human capital
are presented shortly; see footnote 64.
62
Ibid.