Báo cáo khoa học: "Pronunciation Modeling for Improved Spelling Correction" potx
Bạn đang xem bản rút gọn của tài liệu. Xem và tải ngay bản đầy đủ của tài liệu tại đây (78.51 KB, 8 trang )
Pronunciation Modeling for Improved Spelling Correction
Kristina Toutanova
Computer Science Department
Stanford University
Stanford, CA 94305 USA
Robert C. Moore
Microsoft Research
One Microsoft Way
Redmond, WA 98052 USA
Abstract
This paper presents a method for incor-
porating word pronunciation information
in a noisy channel model for spelling cor-
rection. The proposed method builds an
explicit error model for word pronuncia-
tions. By modeling pronunciation simi-
larities between words we achieve a sub-
stantial performance improvement over
the previous best performing models for
spelling correction.
1 Introduction
Spelling errors are generally grouped into two
classes (Kuckich, 1992) — typographic and cogni-
tive. Cognitive errors occur when the writer does
not know how to spell a word. In these cases the
misspelling often has the same pronunciation as the
correct word ( for example writing latex as latecks).
Typographic errors are mostly errors related to the
keyboard; e.g., substitution or transposition of two
letters because their keys are close on the keyboard.
Damerau (1964) found that 80% of misspelled
words that are non-word errors are the result of a sin-
gle insertion, deletion, substitution or transposition
of letters. Many of the early algorithms for spelling
correction are based on the assumption that the cor-
rect word differs from the misspelling by exactly
one of these operations (M. D. Kernigan and Gale,
1990; Church and Gale, 1991; Mayes and F. Dam-
erau, 1991).
By estimating probabilities or weights for the
different edit operations and conditioning on the
left and right context for insertions and deletions
and allowing multiple edit operations, high spelling
correction accuracy has been achieved. At ACL
2000, Brill and Moore (2000) introduced a new error
model, allowing generic string-to-string edits. This
model reduced the error rate of the best previous
model by nearly 50%. It proved advantageous to
model substitutions of up to 5-letter sequences (e.g
ent being mistyped as ant, ph as f, al as le, etc.) This
model deals with phonetic errors significantly better
than previous models since it allows a much larger
context size.
However this model makes residual errors, many
of which have to do with word pronunciation. For
example, the following are triples of misspelling,
correct word and (incorrect) guess that the Brill and
Moore model made:
edelvise edelweiss advise
bouncie bouncy bounce
latecks latex lacks
In this work we take the approach of modeling
phonetic errors explicitly by building a separate er-
ror model for phonetic errors. More specifically,
we build two different error models using the Brill
and Moore learning algorithm. One of them is a
letter-based model which is exactly the Brill and
Moore model trained on a similar dataset. The other
is a phone-sequence-to-phone-sequence error model
trained on the same data as the first model, but using
the pronunciations of the correct words and the es-
timated pronunciations of the misspellings to learn
phone-sequence-to-phone-sequence edits and esti-
mate their probabilities. At classification time,
-
best list predictions of the two models are combined
using a log linear model.
A requirement for our model is the availability of
Computational Linguistics (ACL), Philadelphia, July 2002, pp. 144-151.
Proceedings of the 40th Annual Meeting of the Association for
a letter-to-phone model that can generate pronunci-
ations for misspellings. We build a letter-to-phone
model automatically from a dictionary.
The rest of the paper is structured as follows:
Section 2 describes the Brill and Moore model and
briefly describes how we use it to build our er-
ror models. Section 3 presents our letter-to-phone
model, which is the result of a series of improve-
ments on a previously proposed N-gram letter-to-
phone model (Fisher, 1999). Section 4 describes the
training and test phases of our algorithm in more de-
tail and reports on experiments comparing the new
model to the Brill and Moore model. Section 6 con-
tains conclusions and ideas for future work.
2 Brill and Moore Noisy Channel Spelling
Correction Model
Many statistical spelling correction methods can be
viewed as instances of the noisy channel model. The
misspelling of a word is viewed as the result of cor-
ruption of the intended word as it passes through a
noisy communications channel.
The task of spelling correction is a task of finding,
for a misspelling
, a correct word , where
is a given dictionary and is the most probable
word to have been garbled into
. Equivalently, the
problem is to find a word
for which
is maximized. Since the denominator is constant,
this is the same as maximizing
. In the
terminology of noisy channel modeling, the distribu-
tion
is referred to as the source model, and the
distribution
is the error or channel model.
Typically, spelling correction models are not used
for identifying misspelled words, only for propos-
ing corrections for words that are not found in a
dictionary. Notice, however, that the noisy chan-
nel model offers the possibility of correcting mis-
spellings without a dictionary, as long as sufficient
data is available to estimate the source model fac-
tors. For example, if
Osama bin Laden and
Ossama bin Laden, the model will predict that
the correct spelling
is more likely than the incor-
rect spelling
, provided that
where would be approximately the
odds of doubling the s in Osama. We do not pursue
this, here, however.
Brill and Moore (2000) present an improved er-
ror model for noisy channel spelling correction that
goes beyond single insertions, deletions, substitu-
tions, and transpositions. The model has a set of pa-
rameters
for letter sequences of lengths
up to
. An extension they presented has refined pa-
rameters
which also depend on
the position of the substitution in the source word.
According to this model, the misspelling is gener-
ated by the correct word as follows: First, a person
picks a partition of the correct word and then types
each partition independently, possibly making some
errors. The probability for the generation of the mis-
spelling will then be the product of the substitution
probabilities for each of the parts in the partition.
For example, if a person chooses to type the word
bouncy and picks the partition boun cy, the proba-
bility that she mistypes this word as boun cie will
be
. The probability
is estimated as the maximum over all parti-
tions of
of the probability that is generated from
given that partition.
We use this method to build an error model for
letter strings and a separate error model for phone
sequences. Two models are learned; one model LTR
(standing for “letter”) has a set of substitution prob-
abilities
where and are character
strings, and another model PH (for “phone”) has a
set of substitution probabilities
where
and are phone sequences.
We learn these two models on the same data set
of misspellings and correct words. For LTR, we use
the training data as is and run the Brill and Moore
training algorithm over it to learn the parameters of
LTR.ForPH, we convert the misspelling/correct-
word pairs into pairs of pronunciations of the mis-
spelling and the correct word, and run the Brill and
Moore training algorithm over that.
For PH, we need word pronunciations for the cor-
rect words and the misspellings. As the misspellings
are certainly not in the dictionary we need a letter-
to-phone converter that generates possible pronun-
ciations for them. The next section describes our
letter-to-phone model.
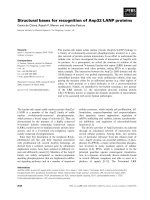
NETtalk MS Speech
Set Words Set Words
Training 14,876 Training 106,650
Test 4,964 Test 30,003
Table 1: Text-to-phone conversion data
3 Letter-to-Phone Model
There has been a lot of research on machine learn-
ing methods for letter-to-phone conversion. High
accuracy is achieved, for example, by using neural
networks (Sejnowski and Rosenberg, 1987), deci-
sion trees (Jiang et al., 1997), and
-grams (Fisher,
1999). We use a modified version of the method pro-
posed by Fisher, incorporating several extensions re-
sulting in substantial gains in performance. In this
section we first describe how we do alignment at
the phone level, then describe Fisher’s model, and fi-
nally present our extensions and the resulting letter-
to-phone conversion accuracy.
The machine learning algorithms for converting
text to phones usually start off with training data
in the form of a set of examples, consisting of let-
ters in context and their corresponding phones (clas-
sifications). Pronunciation dictionaries are the ma-
jor source of training data for these algorithms, but
they do not contain information for correspondences
between letters and phones directly; they have cor-
respondences between sequences of letters and se-
quences of phones.
A first step before running a machine learning
algorithm on a dictionary is, therefore, alignment
between individual letters and phones. The align-
ment algorithm is dependent on the phone set used.
We experimented with two dictionaries, the NETtalk
dataset and the Microsoft Speech dictionary. Statis-
tics about them and how we split them into training
and test sets are shown in Table 1. The NETtalk
dataset contains information for phone level align-
ment and we used it to test our algorithm for auto-
matic alignment. The Microsoft Speech dictionary
is not aligned at the phone level but it is much big-
ger and is the dictionary we used for learning our
final letter-to-phone model.
The NETtalk dictionary has been designed so that
each letter correspond to at most one phone, so a
word is always longer, or of the same length as, its
pronunciation. The alignment algorithm has to de-
cide which of the letters correspond to phones and
which ones correspond to nothing (i.e., are silent).
For example, the entry in NETtalk (when we remove
the empties, which contain information for phone
level alignment) for the word able is
ABLEebL.
The correct alignment is
A/e B/b L/L E/–, where – de-
notes the empty phone. In the Microsoft Speech dic-
tionary, on the other hand, each letter can naturally
correspond to
, ,or phones. For example, the en-
try in that dictionary for able is
ABLE ey b ax l. The
correct alignment is
A/ey B/b L/ax&l E/–. If we also
allowed two letters as a group to correspond to two
phones as a group, the correct alignment might be
A/ey B/b LE/ax&l, but that would make it harder for
the machine learning algorithm.
Our alignment algorithm is an implementa-
tion of hard EM (Viterbi training) that starts off
with heuristically estimated initial parameters for
and, at each iteration, finds the
most likely alignment for each word given the pa-
rameters and then re-estimates the parameters col-
lecting counts from the obtained alignments. Here
ranges over sequences of (empty), ,
and
phones for the Microsoft Speech dictionary
and
or phones for NETtalk. The parameters
were initialized by a method sim-
ilar to the one proposed in (Daelemans and van den
Bosch, 1996). Word frequencies were not taken into
consideration here as the dictionary contains no fre-
quency information.
3.1 Initial Letter-to-Phone Model
The method we started with was the N-gram model
of Fisher (1999). From training data, it learns rules
that predict the pronunciation of a letter based on
letters of left and letters of right context. The rules
are of the following form:
Here stands for a sequence of letters to the
left of
and is a sequence of letters to the
right. The number of letters in the context to the left
and right varies. We used from
to letters on each
side. For example, two rules learned for the letter B
were:
and ,
meaning that in the first context the letter B is silent
with probability , and in the second it is pro-
nounced as
with probability and is silent with
probability
.
Training this model consists of collecting counts
for the contexts that appear in the data with the se-
lected window size to the left and right. We col-
lected counts for all configurations
for
, that occurred
in the data. The model is applied by choosing for
each letter
the most probable translation as pre-
dicted by the most specific rule for the context of
occurrence of the letter. For example, if we want
to find how to pronounce the second b in abbot we
would chose the empty phone because the first rule
mentioned above is more specific than the second.
3.2 Extensions
We implemented five extensions to the initial model
which together decreased the error rate of the letter-
to-phone model by around
. These are :
Combination of the predictions of several ap-
plicable rules by linear interpolation
Rescoring of -best proposed pronunciations
for a word using a trigram phone sequence lan-
guage model
Explicit distinction between middle of word
versus start or end
Rescoring of -best proposed pronunciations
for a word using a fourgram vowel sequence
language model
The performance figures reported by Fisher
(1999) are significantly higher than our figures us-
ing the basic model, which is probably due to the
cleaner data used in their experiments and the dif-
ferences in phoneset size.
The extensions we implemented are inspired
largely by the work on letter-to-phone conversion
using decision trees (Jiang et al., 1997). The last
extension, rescoring based on vowel fourgams, has
not been proposed previously. We tested the algo-
rithms on the NETtalk and Microsoft Speech dic-
tionaries, by splitting them into training and test
sets in proportion 80%/20% training-set to test-set
size. We trained the letter-to-phone models using
the training splits and tested on the test splits. We
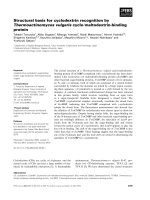
Model Phone Acc Word Acc
Initial 88.83% 53.28%
Interpolation
of contexts 90.55% 59.04%
Distinction
of middle 91.09% 60.81%
Phonetic
trigram 91.38% 62.95%
Vowel
fourgram 91.46% 63.63%
Table 2: Letter-to-phone accuracies
are reporting accuracy figures only on the NETtalk
dataset since this dataset has been used extensively
in building letter-to-phone models, and because
phone accuracy is hard to determine for the non-
phonetically-aligned Microsoft Speech dictionary.
For our spelling correction algorithm we use a letter-
to-phone model learned from the Microsoft Speech
dictionary, however.
The results for phone accuracy and word accuracy
of the initial model and extensions are shown in Ta-
ble 2. The phone accuracy is the percentage cor-
rect of all phones proposed (excluding the empties)
and the word accuracy is the percentage of words
for which pronunciations were guessed without any
error.
For our data we noticed that the most specific
rule that matches is often not a sufficiently good
predictor. By linearly interpolating the probabili-
ties given by the five most specific matching rules
we decreased the word error rate by 14.3%. The
weights for the individual rules in the top five were
set to be equal. It seems reasonable to combine the
predictions from several rules especially because the
choice of which rule is more specific of two is arbi-
trary when neither is a substring of the other. For
example, of the two rules with contexts
and
, where the first has right context and the
second has
left letter context, one heuristic is to
choose the latter as more specific since right context
seems more valuable than left (Fisher, 1999). How-
ever this choice may not always be the best and it
proves useful to combine predictions from several
rules. In Table 2 the row labeled “Interpolation of
contexts” refers to this extension of the basic model.
Adding a symbol for interior of word produced a
gain in accuracy. Prior to adding this feature, we
had features for beginning and end of word. Explic-
itly modeling interior proved helpful and further de-
creased our error rate by 4.3%. The results after this
improvement are shown in the third row of Table 2.
After linearly combining the predictions from the
top matching rules we have a probability distribu-
tion over phones for each letter. It has been shown
that modeling the probability of sequences of phones
can greatly reduce the error (Jiang et al., 1997). We
learned a trigram phone sequence model and used
it to re-score the
-best predictions from the basic
model. We computed the score for a sequence of
phones given a sequence of letters, as follows:
Score
(1)
Here the probabilities
are the
distributions over phones that we obtain for each let-
ter from combination of the matching rules. The
weight
for the phone sequence model was esti-
mated from a held-out set by a linear search. This
model further improved our performance and the re-
sults it achieves are in the fourth row of Table 2.
The final improvement is adding a term from a
vowel fourgram language model to equation 1 with
a weight
. The term is the log probability of the
sequence of vowels in the word according to a four-
gram model over vowel sequences learned from the
data. The final accuracy we achieve is shown in
the fifth row of the same table. As a comparison,
the best accuracy achieved by Jiang et al. (1997)
on NETalk using a similar proportion of training
and test set sizes was
. Their system uses
more sources of information, such as phones in the
left context as features in the decision tree. They
also achieve a large performance gain by combining
multiple decision trees trained on separate portions
of the training data. The accuracy of our letter-to-
phone model is comparable to state of the art sys-
tems. Further improvements in this component may
lead to higher spelling correction accuracy.
4 Combining Pronunciation and
Letter-Based Models
Our combined error model gives the probability
where w is the misspelling and r is a
word in the dictionary. The spelling correction algo-
rithm selects for a misspelling w the word r in the
dictionary for which the product
is maximized. In our experiments we used a uniform
source language model over the words in the dictio-
nary. Therefore our spelling correction algorithm se-
lects the word
that maximizes . Brill
and Moore (2000) showed that adding a source lan-
guage model increases the accuracy significantly.
They also showed that the addition of a language
model does not obviate the need for a good error
model and that improvements in the error model lead
to significant improvements in the full noisy channel
model.
We build two separate error models, LTR and
PH (standing for “letter” model and “phone”
model). The letter-based model estimates a prob-
ability distribution
over words, and
the phone-based model estimates a distribution
over pronunciations. Using
the PH model and the letter-to-phone model, we de-
rive a distribution
in a way to be made
precise shortly. We combine the two models to esti-
mate scores as follows:
The that maximizes this score will also maxi-
mize the probability
. The probabilities
are computed as follows:
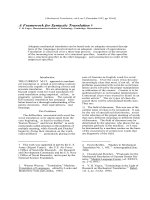
This equation is approximated by the expression
for
shown in Figure 1 after several simplify-
ing assumptions. The probabilities
are
Figure 1: Equation for approximation of
taken to be equal for all possible pronunciations of
in the dictionary. Next we assume independence of
the misspelling from the right word given the pro-
nunciation of the right word i.e.
. By inversion of the conditional prob-
ability this is equal to
multiplied by
. Since we do not model these
marginal probabilities, we drop the latter factor.
Next the probability
is expressed as
which is approximated by the maximum term in the
sum. After the following decomposition:
where the second part represents a final indepen-
dence assumption, we get the expression in Figure 1.
The probabilities
are given by the
letter-to-phone model. In the following subsections,
we first describe how we train and apply the individ-
ual error models, and then we show performance re-
sults for the combined model compared to the letter-
based error model.
4.1 Training Individual Error Models
The error model LTR was trained exactly as de-
scribed originally by Brill and Moore (2000). Given
a training set of pairs
the algorithm es-
timates a set of rewrite probabilities
which are the basis for computing probabilities
.
The parameters of the PH model
are obtained by training
a phone-sequence-to-phone-sequence error model
starting from the same training set of pairs
of misspelling and correct word as for the LTR
model. We convert this set to a set of pronunciations
of misspellings and pronunciations of correct
words in the following way: For each training
sample
we generate training samples
of corresponding pronunciations where
is the
number of pronunciations of the correct word
in our dictionary. Each of those samples is the
most probable pronunciation of
according to
our letter-to-phone model paired with one of the
possible pronunciations of
. Using this training
set, we run the algorithm of Brill and Moore to es-
timate a set of substitution probabilities
for
sequences of phones to sequences of phones. The
probability
is then computed
as a product of the substitution probabilities in the
most probable alignment, as Brill and Moore did.
4.2 Results
We tested our system and compared it to the Brill
and Moore model on a dataset of around
pairs of misspellings and corresponding correct
words, split into training and test sets. The ex-
act data sizes are
word pairs in the training
set and
word pairs in the test set. This set
is slightly different from the dataset used in Brill
and Moore’s experiments because we removed from
the original dataset the pairs for which we did not
have the correct word in the pronunciation dictio-
nary. Both models LTR and PH were trained on the
same training set. The interpolation weight that the
combined model CMB uses is also set on the train-
ing set to maximize the classification accuracy.
At test time we do not search through all possible
words
in the dictionary to find the one maximizing
. Rather, we compute the combi-
nation score only for candidate words
that are in
the top
according to the or are in the
top
according to for any
of the pronunciations of
from the dictionary and
any of the pronunciations for
that were proposed
by the letter-to-phone model. The letter-to-phone
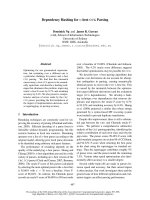
Model 1-Best 2-Best 3-Best 4-Best
LTR 94.21% 98.18% 98.90 % 99.06%
PH 86.36% 93.65% 95.69 % 96.63%
CMB 95.58% 98.90% 99.34% 99.50%
Error
Reduction 23.8% 39.6% 40% 46.8%
Table 3: Spelling Correction Accuracy Results
model returned for each
the most probable pro-
nunciations only. Our performance was better when
we considered the top
pronunciations of rather
than a single most likely hypothesis. That is prob-
ably due to the fact that the
-best accuracy of the
letter-to-phone model is significantly higher than its
-best accuracy.
Table 3 shows the spelling correction accuracy
when using the model LTR, PH, or both in com-
bination. The table shows
-best accuracy results.
The
-best accuracy figures represent the percent
test cases for which the correct word was in the top
words proposed by the model. We chose the con-
text size of
for the LTR model as this context size
maximized test set accuracy. Larger context sizes
neither helped nor hurt accuracy.
As we can see from the table, the phone-based
model alone produces respectable accuracy results
considering that it is only dealing with word pronun-
ciations. The error reduction of the combined model
compared to the letters-only model is substantial:
for 1-Best, the error reduction is over
; for 2-
Best, 3-Best, and 4-Best it is even higher, reaching
over
for 4-Best.
As an example of the influence of pronuncia-
tion modeling, in Table 4 we list some misspelling-
correct word pairs where the LTR model made
an incorrect guess and the combined model CMB
guessed accurately.
5 Conclusions and Future Work
We have presented a method for using word pro-
nunciation information to improve spelling correc-
tion accuracy. The proposed method substantially
reduces the error rate of the previous best spelling
correction model.
A subject of future research is looking for a bet-
ter way to combine the two error models or building
Misspelling Correct LTR Guess
bouncie bouncy bounce
edelvise edelweiss advise
grissel gristle grizzle
latecks latex lacks
neut newt nut
rench wrench ranch
saing saying sang
stail stale stall
Table 4: Examples of Corrected Errors
a single model that can recognize whether there is
a phonetic or typographic error. Another interest-
ing task is exploring the potential of our model in
different settings such as the Web, e-mail, or as a
specialized model for non-native English speakers
of particular origin.
References
E. Brill and R. C. Moore. 2000. An improved error
model for noisy channel spelling correction. In Proc.
of the 38th Annual Meeting of the ACL, pages 286–
293.
K. Church and W. Gale. 1991. Probability scoring for
spelling correction. In Statistics and Computing, vol-
ume 1, pages 93–103.
W. Daelemans and A. van den Bosch. 1996. Language-
independent data-orientedgrapheme-to-phoneme con-
version. In Progress in SpeechSynthesis, pages 77–90.
F. J. Damerau. 1964. A technique for computer detection
and correction of spelling errors. In Communications
of the ACM, volume 7(3), pages 171–176.
W. M. Fisher. 1999. A statistical text-to-phone function
using ngrams and rules. In Proc. of the IEEE Inter-
national Conference on Acoustics, Speech and Signal
Processing, pages 649–652.
L. Jiang, H.W. Hon, and X. Huang. 1997. Improvements
on a trainable letter-to-sound converter. In Proceed-
ings of the 5th European Conference on Speech Com-
munication and Technology.
K. Kuckich. 1992. Techniques for automatically correct-
ing words in text. In ACM Computing Surveys, volume
24(4), pages 377–439.
W. Church M. D. Kernigan and W. A. Gale. 1990. A
spelling correction program based on a noisy channel
model. In Proc. of COLING-90, volume II, pages205–
211.
F. Mayes and et al. F. Damerau. 1991. Conext based
spelling correction. In Information Processing and
Management, volume 27(5), pages 517–522.
T. J. Sejnowski and C. R. Rosenberg. 1987. Parallel net-
works that learnto pronounceenglish text. In Complex
Systems, pages 145–168.