Báo cáo khoa học: " Supervised Ranking in Open-Domain Text Summarization" potx
Bạn đang xem bản rút gọn của tài liệu. Xem và tải ngay bản đầy đủ của tài liệu tại đây (108.13 KB, 8 trang )
Supervised Ranking in Open-Domain Text Summarization
Tadashi Nomoto
National Institute of Japanese Literature
1-16-10 Yutaka Shinagawa
Tokyo 142-8585, Japan
Yuji Matsumoto
Nara Institute of Science and Technology
8916-5 Takayama Ikoma
Nara 630-0101, Japan
Abstract
The paper proposes and empirically moti-
vates an integration of supervised learning
with unsupervised learning to deal with
human biases in summarization. In par-
ticular, we explore the use of probabilistic
decision tree within the clustering frame-
work to account for the variation as well
as regularity in human created summaries.
The corpus of human created extracts is
created from a newspaper corpus and used
as a test set. We build probabilistic de-
cision trees of different flavors and in-
tegrate each of them with the clustering
framework. Experiments with the cor-
pus demonstrate that the mixture of the
two paradigms generally gives a signif-
icant boost in performance compared to
cases where either of the two is considered
alone.
1 Introduction
Nomoto and Matsumoto (2001b) have recently
made an interesting observation that an unsu-
pervised method based on clustering sometimes
better approximates human created extracts than a
supervised approach. That appears somewhat con-
tradictory given that a supervised approach should
be able to exploit human supplied information about
which sentence to include in an extract and which
not to, whereas an unsupervised approach blindly
chooses sentences according to some selection
scheme. An interesting question is, why this should
be the case.
The reason may have to do with the variation in
human judgments on sentence selection for a sum-
mary. In a study to be described later, we asked stu-
dents to select 10% of a text which they find most
important for making a summary. If they agree per-
fectly on their judgments, then we will have only
10% of a text selected as most important. However,
what we found was that about half of a text were
marked as important, indicating that judgments can
vary widely among humans.
Curiously, however, Nomoto and Matsumoto
(2001a) also found that a supervised system fares
much better when tested on data exhibiting high
agreement among humans than an unsupervised sys-
tem. Their finding suggests that there are indeed
some regularities (or biases) to be found.
So we might conclude that there are two aspects to
human judgments in summarization; they can vary
but may exhibit some biases which could be usefully
exploited. The issue is then how we might model
them in some coherent framework.
The goal of the paper is to explore a possible in-
tegration of supervised and unsupervised paradigms
as a way of responding to the issue. Taking a de-
cision tree and clustering as representing the respec-
tive paradigm, we will show how coupling them pro-
vides a summarizer that better approximates human
judgments than either of the two considered alone.
To our knowledge, none of the prior work on sum-
marization (e.g., Kupiec et al. (1995)) explicitly ad-
dressed the issue of the variability inherent in human
judgments in summarization tasks.
Computational Linguistics (ACL), Philadelphia, July 2002, pp. 465-472.
Proceedings of the 40th Annual Meeting of the Association for
X
1
0
||
z
z
z
z
z
z
1
f
f
f
f
f
f
Y
1
(θ
1
y
, θ
1
n
)
X
2
0
Ð
Ð
Ð
Ð
Ð
Ð
1
f
f
f
f
f
f
Y
2
(θ
2
y
, θ
2
n
)
Y
3
(θ
3
y
, θ
3
n
)
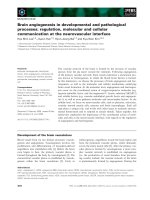
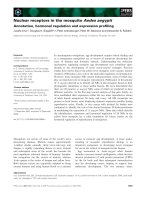
Figure 1: Probabilistic Decision Tree
2 Supervised Ranking with Probabilistic
Decision Tree
One technical problem associated with the use of a
decision tree as a summarizer is that it is not able to
rank sentences, which it must be able do, to allow for
the generation of a variable-length summary. In re-
sponse to the problem, we explore the use of a prob-
abilistic decision tree as a ranking model. First, let
us review some general features of probabilistic de-
cision tree (ProbDT, henceforth) (Yamanishi, 1997;
Rissanen, 1997).
ProbDT works like a usual decision tree except
that rather than assigning each instance to a single
class, it distributes each instance among classes. For
each instance x
i
, the strength of its membership to
each of the classes is determined by P (c
k
| x
i
) for
each class c
k
.
Consider a binary decision tree in Fig 1. Let X
1
and X
2
represent non-terminal nodes, and Y
1
and
Y
2
leaf nodes. ‘1’ and ‘0’ on arcs denote values
of some attribute at X
1
and X
2
. θ
i
y
and θ
i
n
repre-
sent the probability that a given instance assigned
to the node i is labeled as yes and no, repectively.
Abusing the terms slightly, let us assume that X
1
and
X
2
represent splitting attributes as well at respective
nodes. Then the probability that a given instance
with X
1
= 1 and X
2
= 0 is labeled as yes (no) is
θ
2
y
(θ
2
n
). Note that
c
θ
j
c
= 1 for a given node j.
Now to rank sentences with ProbDT simply in-
volves finding the probability that each sentence is
assigned to a particular class designating sentences
worthy of inclusion in a summary (call it ‘Select’
class) and ranking them accordingly. (Hereafter and
throughout the rest of the paper, we say that a sen-
tence is wis if it is worthy of inclusion in a summary:
thus a wis sentence is a sentence worthy of inclusion
in a summary.) The probabiliy that a sentence u is
labeled as wis is expressed as in Table 1, where u
is a vector representation of u, consisting of a set of
values for features of u; α is a smoothing function,
e.g., Laplace’s law; t(u) is some leaf node assigned
to u; and DT represents some decision tree used to
classify u.
3 Diversity Based Summarization
As an unsupervised summarizer, we use diversity
based summarization (DBS) (Nomoto and Mat-
sumoto, 2001c). It takes a cluster-and-rank approach
to generating summaries. The idea is to form a sum-
mary by collecting sentences representative of di-
verse topics discussed in the text. A nice feature
about their approach is that by creating a summary
covering potential topics, which could be marginal
to the main thread of the text, they are in fact able to
accommodate the variability in sentence selection:
some people may pick up subjects (sentences) as
important which others consider irrelevant or only
marginal for summarization. DBS accomodates this
situation by picking them all, however marginal they
might be.
More specifically, DBS is a tripartite process con-
sisting of the following:
1. Find-Diversity: find clusters of lexically sim-
ilar sentences in text. (In particular, we repre-
sent a sentence here a vector of tfidf weights of
index terms it contains.)
2. Reduce-Redundancy: for each cluster found,
choose a sentence that best represents that clus-
ter.
3. Generate-Summary: collect the representa-
tive sentences, put them in some order, and re-
turn them to the user.
Find-Diversity is based on the K-means clustering
algorithm, which they extended with Minimum De-
scription Length Principle (MDL) (Li, 1998; Ya-
manishi, 1997; Rissanen, 1997) as a way of optimiz-
ing K-means. Reduce-Redundancy is a tfidf based
ranking model, which assigns weights to sentences
in the cluster and returns a sentence that ranks high-
est. The weight of a sentence is given as the sum of
tfidf scores of terms in the sentence.
Table 1: Probabilistic Classification with DT. u is a vector representation of sentence u. α is a smoothing
function. t(u) is some leaf node assigned to u by DT.
P (Select | u, DT) = α
the number of “Select” sentences at t(u)
the total number of sentences at t(u)
4 Combining ProbDT and DBS
Combining ProbDT and DBS is done quite straight-
forwardly by replacing Reduce-Redundacy with
ProbDT. Thus instead of picking up a sentence with
the highest tfdif based weight, DBS/ProbDT at-
tempts to find a sentences with the highest score for
P (Select | u, DT).
4.1 Features
The following lists a set of features used for encod-
ing a sentence in ProbDT. Most of them are either
length- or location-related features.
1
<LocSen> The location of a sentence X defined
by:
#S(X) − 1
#S(Last Sentence)
‘#S(X)’ denotes an ordinal number indicating the
position of X in a text, i.e. #S(kth sentence) = k.
‘Last Sentence’ refers to the last sentence in a text.
LocSen takes values between 0 and
N−1
N
. N is the
number of sentences in the text.
<LocPar> The location of a paragraph in which
a sentence X occurs given by:
#P ar(X) − 1
#Last P aragraph
‘#P ar(X)’ denotes an ordinal number indicat-
ing the position of a paragraph containing X.
‘#Last Paragraph’ is the position of the last para-
graph in a text, represented by the ordinal number.
<LocWithinPar> The location of a sentence
X within a paragraph in which it appears.
#S(X) − #S(P ar Init Sen)
Length(P ar(X))
1
Note that one may want to add tfidf to a set of features for
a decision tree or, for that matter, to use features other than tfidf
for representing sentences in clustering. The idea is worthy of
consideration, but not pursued here.
Table 2: Linguistic cues
code category
1 non-past
2 past /-ta/
3 copula /-da/
4 noun
5 symbols, e.g., parentheses
6 sentence-ending particles, e.g., /-ka/
0 none of the above
‘Par Init Sen’ refers to the initial sentence of a para-
graph in which X occurs, ‘Length(Par(X))’ denotes
the number of sentences that occur in that paragraph.
LocWithinPar takes continuous values ranging
from 0 to
l−1
l
, where l is the length of a paragraph:
a paragraph initial sentence would have 0 and a para-
graph final sentence
l−1
l
.
<LenText> The text length in Japanese charac-
ter i.e. kana, kanji.
<LenSen> The sentence length in kana/kanji.
Some work in Japanese linguistics found that a
particular grammatical class a sentence final ele-
ment belongs to could serve as a cue to identifying
summary sentences. These include categories like
PAST/NON-PAST, INTERROGATIVE, and NOUN and
QUESTION-MARKER. Along with Ichikawa (1990),
we identified a set of sentence-ending cues and
marked a sentence as to whether it contains a cue
from the set.
2
Included in the set are inflectional
classes PAST/NON-PAST (for the verb and verbal
adjective), COPULA, and NOUN, parentheses, and
QUESTION-MARKER -ka. We use the following at-
tribute to encode a sentence-ending form.
<EndCue> The feature encodes one of sentence-
2
Word tokens are extracted by using CHASEN, a Japanese
morphological analyzer which is reported to achieve the accu-
racy rate of over 98% (Matsumoto et al., 1999).
ending forms described above. It is a discrete valued
feature. The value ranges from 0 to 6. (See Table 2
for details.)
Finally, one of two class labels, ‘Select’ and
‘Don’t Select’, is assigned to a sentence, depend-
ing on whether it is wis or not. The ‘Select’ label
is for wis sentences, and the ‘Don’t Select‘ label for
non-wis sentences.
5 Decision Tree Algorithms
To examine the generality of our approach, we con-
sider, in addition to C4.5 (Quinlan, 1993), the fol-
lowing decision tree algorithms. C4.5 is used with
default options, e.g., CF=25%.
5.1 MDL-DT
MDL-DT stands for a decision tree with MDL based
pruning. It strives to optimize the decision tree
by pruning the tree in such a way as to produce
the shortest (minimum) description length for the
tree. The description length refers to the num-
ber of bits required for encoding information about
the decision tree. MDL ranks, along with Akaike
Information Criterion (AIC) and Bayes Informa-
tion Criterion (BIC), as a standard criterion in ma-
chine learning and statistics for choosing among
possible (statistical) models. As shown empirically
in Nomoto and Matsumoto (2000) for discourse do-
main, pruning DT with MDL significantly reduces
the size of tree, while not compromising perfor-
mance.
5.2 SSDT
SSDT or Subspace Splitting Decision Tree repre-
sents another form of decision tree algorithm.(Wang
and Yu, 2001) The goal of SSDT is to discover pat-
terns in highly biased data, where a target class, i.e.,
the class one likes to discover something about, ac-
counts for a tiny fraction of the whole data. Note that
the issue of biased data distribution is particularly
relevant for summarization, as a set of sentences to
be identified as wis usually account for a very small
portion of the data.
SSDT begins by searching the entire data space
for a cluster of positive cases and grows the cluster
by adding points that fall within some distance to
the center of the cluster. If the splitting based on the
cluster offers a better Gini index than simply using
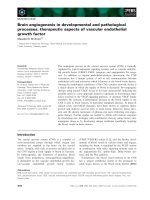
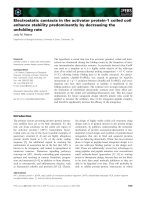
Figure 2: SSDT in action. Filled circles represent
positive class, white circles represent negative class.
SSDT starts with a small spherical cluster of pos-
itive points (solid circle) and grows the cluster by
‘absorbing’ positive points around it (dashed circle).
one of the attributes to split the data, SSDT splits the
data space based on the cluster, that is, forms one re-
gion outside of the cluster and one inside.
3
It repeats
the process recursively on each subregions spawned
until termination conditions are met. Figure 2 gives
a snapshot of SSDT at work. SSDT locates some
clusters of positive points, develops spherical clus-
ters around them.
With its particular focus on positive cases, SSDT
is able to provide a more precise characterization of
them, compared, for instance, to C4.5.
6 Test Data and Procedure
We asked 112 Japanese subjects (students at grad-
uate and undergraduate level) to extract 10% sen-
tences in a text which they consider most important
in making a summary. The number of sentences to
extract varied from two to four, depending on the
length of a text. The age of subjects varied from 18
to 45. We used 75 texts from three different cate-
gories (25 for each category); column, editorial and
news report. Texts were of about the same size in
terms of character counts and the number of para-
graphs, and were selected randomly from articles
that appeared in a Japanese financial daily (Nihon-
Keizai-Shimbun-Sha, 1995). There were, on aver-
age, 19.98 sentences per text.
3
For a set S of data with k classes, its Gini index is given
as: Gini(S) = 1 −
k
i
p
2
i
, where p
i
denotes the probability of
observing class i in S.
Table 3: Test Data. N denotes the total number of
sentences in the test data. K ≥ n means that a wis
(positive) sentence gets at least n votes.
K N positive negative
≥ 1 1424 707 717
≥ 2 1424 392 1032
≥ 3 1424 236 1188
≥ 4 1424 150 1274
≥ 5 1424 72 1352
The kappa agreement among subjects was
0.25. The result is in a way consistent with
Salton et al. (1999), who report a low inter-subject
agreement on paragraph extracts from encyclope-
dias and also with Gong and Liu (2001) on a sen-
tence selection task in the cable news domain. While
there are some work (Marcu, 1999; Jing et al., 1998)
which do report high agreement rates, their success
may be attributed to particularities of texts used, as
suggested by Jing et al. (1998). Thus, the question
of whether it is possible to establish an ideal sum-
mary based on agreement is far from settled, if ever.
In the face of this, it would be interesting and per-
haps more fruitful to explore another view on sum-
mary, that the variability of a summary is the norm
rather than the exception.
In the experiments that follow, we decided not
to rely on a particular level of inter-coder agree-
ment to determine whether or not a given sentence
is wis. Instead, we used agreement threshold to dis-
tinguish between wis and non-wis sentences: for a
given threshold K, a sentence is considered wis (or
positive) if it has at least K votes in favor of its in-
clusion in a summary, and non-wis (negative) if not.
Thus if a sentence is labeled as positive at K ≥ 1,
it means that there are one or more judges taking
that sentence as wis. We examined K from 1 to 5.
(On average, seven people are assigned to one arti-
cle. However, one would rarely see all of them unan-
imously agree on their judgments.)
Table 3 shows how many positive/negative in-
stances one would get at a given agreement thresh-
old. At K ≥ 1, out of 1424 instances, i.e., sen-
tences, 707 of them are marked positive and 717 are
marked negative, so positive and negative instances
are evenly spread across the data. On the other hand,
at K ≥ 5, there are only 72 positive instances. This
means that there is less than one occurrence of wis
case per article.
In the experiments below, each probabilistic ren-
dering of the DTs, namely, C4.5, MDL-DT, and
SSDT is trained on the corpus, and tested with
and without the diversity extension (Find-Diversity).
When used without the diversity component, each
ProbDT works on a test article in its entirety, pro-
ducing the ranked list of sentences. A summary
with compression rate γ is obtained by selecting
top
γ
percent of the list. When coupled with Find-
Diversity, on the other hand, each ProbDT is set
to work on each cluster discovered by the diversity
component, producing multiple lists of sentences,
each corresponding to one of the clusters identified.
A summary is formed by collecting top ranking sen-
tences from each list.
Evaluation was done by 10-fold cross vali-
dation. For the purpose of comparison, we
also ran the diversity based model as given in
Nomoto and Matsumoto (2001c) and a tfidf based
ranking model (Zechner, 1996) (call it Z model),
which simply ranks sentences according to the tfidf
score and selects those which rank highest. Recall
that the diversity based model (DBS) (Nomoto and
Matsumoto, 2001c) consists in Find-Diversity and
the ranking model by Zechner (1996), which they
call Reduce-Redundancy.
7 Results and Discussion
Tables 4-8 show performance of each ProbDT and
its combination with the diversity (clustering) com-
ponent. It also shows performance of Z model and
DBS. In the tables, the slashed ‘V’ after the name
of a classifier indicates that the relevant classifier is
diversity-enabled, meaning that it is coupled with
the diversity extension. Notice that each decision
tree here is a ProbDT and should not be confused
with its non-probabilistic counterpart. Also worth
noting is that DBS is in fact Z/V, that is, diversity-
enabled Z model.
Returning to the tables, we find that for most
of the times, the diversity component has clear ef-
fects on ProbDTs, significantly improving their per-
formance. All the figures are in F-measure, i.e.,
F =
2∗P ∗R
P +R
. In fact this happens regardless of a par-
ticular choice of ranking model, as performance of
Z is also boosted with the diversity component. Not
surprisingly, effects of supervised learning are also
evident: diversity-enabled ProbDTs generally out-
perform DBS (Z/V) by a large margin. What is sur-
prising, moreover, is that diversity-enabled ProbDTs
are superior in performance to their non-diversity
counterparts (with a notable exception for SSDT at
K ≥ 1), which suggests that selecting marginal sen-
tences is an important part of generating a summary.
Another observation about the results is that as
one goes along with a larger K, differences in per-
formance among the systems become ever smaller:
at K ≥ 5, Z performs comparably to C4.5, MDL,
and SSDT either with or without the diversity com-
ponent. The decline of performance of the DTs may
be caused by either the absence of recurring patterns
in data with a higher K or simply the paucity of
positive instances. At the moment, we do not know
which is the case here.
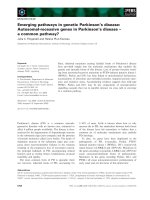
It is curious to note, moreover, that MDL-DT is
not performing as well as C4.5 and SSDT at K ≥ 1,
K ≥ 2, and K ≥ 3. The reason may well have
to do with the general properties of MDL-DT. Re-
call that MDL-DT is designed to produce as small
a decision tree as possible. Therefore, the resulting
tree would have a very small number of nodes cov-
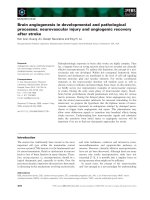
ering the entire data space. Consider, for instance,
a hypothetical data space in Figure 3. Assume that
MDL-DT bisects the space into region A and B, pro-
ducing a two-node decision tree. The problem with
the tree is, of course, that point x and y in region B
will be assigned to the same probability under the
probabilistic tree model, despite the fact that point x
is very close to region A and point y is far out. This
problem could happen with C4.5, but in MDL-DT,
which covers a large space with a few nodes, points
in a region could be far apart, making the problem
more acute. Thus the poor performance of MDL-DT
may be attributable to its extensive use of pruning.
8 Conclusion
As a way of exploiting human biases towards an in-
creased performance of the summarizer, we have ex-
plored approaches to embedding supervised learn-
ing within a general unsupervised framework. In the
A
y
B
x
Figure 3: Hypothetical Data Space
paper, we focused on the use of decision tree as a
plug-in learner. We have shown empirically that the
idea works for a number of decision trees, including
C4.5, MDL-DT and SSDT. Coupled with the learn-
ing component, the unsupervised summarizer based
on clustering significantly improved its performance
on the corpus of human created summaries. More
importantly, we found that supervised learners per-
form better when coupled with the clustering than
when working alone. We argued that that has to do
with the high variation in human created summaries:
the clustering component forces a decision tree to
pay more attention to sentences marginally relevant
to the main thread of the text.
While ProbDTs appear to work well with rank-
ing, it is also possible to take a different approach:
for instance, we may use some distance metric in in-
stead of probability to distinguish among sentences.
It would be interesting to invoke the notion like pro-
totype modeler (Kalton et al., 2001) and see how it
might fare when used as a ranking model.
Moreover, it may be worthwhile to explore
some non-clustering approaches to representing
the diversity of contents of a text, such as
Gong and Liu (2001)’s summarizer 1 (GLS1, for
short), where a sentence is selected on the basis of
its similarity to the text it belongs to, but which ex-
cludes terms that appear in previously selected sen-
tences. While our preliminary study indicates that
GLS1 produces performance comparable and even
superior to DBS on some tasks in the document re-
trieval domain, we have no results available at the
moment on the efficacy of combining GLS1 and
ProbDT on sentence extraction tasks.
Finally, we note that the test corpus used for
Table 4: Performance at varying compression rates for K ≥ 1. MDL-DT denotes a summarizer based
on C4.5 with the MDL extension. DBS (=Z/V) denotes the diversity based summarizer. Z represents the
Z-model summarizer. Performance figures are in F-measure. ‘V’ indicates that the relevant classifier is
diversity-enabled. Note that DBS =Z/V.
cmp.rate C4.5 C4.5/V MDL-DT MDL-DT/V SSDT SSDT/V DBS Z
0.2 0.371 0.459 0.353 0.418 0.437 0.454 0.429 0.231
0.3 0.478 0.507 0.453 0.491 0.527 0.517 0.491 0.340
0.4 0.549 0.554 0.535 0.545 0.605 0.553 0.529 0.435
0.5 0.614 0.600 0.585 0.593 0.639 0.606 0.582 0.510
Table 5: K ≥ 2
cmp.rate C4.5 C4.5/V MDL-DT MDL-DT/V SSDT SSDT/V DBS Z
0.2 0.381 0.441 0.343 0.391 0.395 0.412 0.386 0.216
0.3 0.420 0.441 0.366 0.418 0.404 0.431 0.421 0.290
0.4 0.434 0.444 0.398 0.430 0.415 0.444 0.444 0.344
0.5 0.427 0.447 0.409 0.437 0.423 0.439 0.443 0.381
Table 6: K ≥ 3
cmp.rate C4.5 C4.5/V MDL-DT MDL-DT/V SSDT SSDT/V DBS Z
0.2 0.320 0.354 0.297 0.345 0.328 0.330 0.314 0.314
0.3 0.300 0.371 0.278 0.350 0.321 0.338 0.342 0.349
0.4 0.297 0.357 0.298 0.348 0.325 0.340 0.339 0.337
0.5 0.297 0.337 0.301 0.329 0.307 0.327 0.322 0.322
Table 7: K ≥ 4
cmp.rate C4.5 C4.5/V MDL-DT MDL-DT/V SSDT SSDT/V DBS Z
0.2 0.272 0.283 0.285 0.301 0.254 0.261 0.245 0.245
0.3 0.229 0.280 0.234 0.284 0.249 0.267 0.269 0.269
0.4 0.238 0.270 0.243 0.267 0.236 0.248 0.247 0.247
0.5 0.235 0.240 0.245 0.246 0.227 0.233 0.232 0.232
Table 8: K ≥ 5
cmp.rate C4.5 C4.5/V MDL-DT MDL-DT/V SSDT SSDT/V DBS Z
0.2 0.242 0.226 0.252 0.240 0.188 0.189 0.191 0.191
0.3 0.194 0.220 0.197 0.231 0.171 0.206 0.194 0.194
0.4 0.184 0.189 0.189 0.208 0.175 0.173 0.173 0.173
0.5 0.174 0.175 0.176 0.191 0.145 0.178 0.167 0.167
evaluation is somewhat artificial in the sense that
we elicit judgments from people on the summary-
worthiness of a particular sentence in the text. Per-
haps, we should look at naturally occurring ab-
stracts or extracts as a potential source for train-
ing/evaluation data for summarization research. Be-
sides being natural, they usually come in large num-
ber, which may alleviate some concern about the
lack of sufficient resources for training learning al-
gorithms in summarization.
References
Yihong Gong and Xin Liu. 2001. Generic text summa-
rization using relevance measure and latent semantic
analysis. In Proceedings of the 24th Annual Interna-
tional ACM/SIGIR Conference on Research and De-
velopment, New Orleans. ACM-Press.
Takashi Ichikawa. 1990. Bunsh
ˆ
oron-gaisetsu. Ky
ˆ
oiku-
Shuppan, Tokyo.
Hongyan Jing, Regina Barzilay, Kathleen McKeown, and
Machael Elhadad. 1998. Summarization evaluation
methods: Experiments and analysis. In AAAI Sym-
posium on Intelligent Summarization, Stanford Uni-
vesisty, CA, March.
Annaka Kalton, Pat Langely, Kiri Wagstaff, and Jung-
soon Yoo. 2001. Generalized clustering, supervised
learning, and data assignment. In Proceedings of the
Seventh International Conference on Knowledge Dis-
covery and Data Mining (KDD2001), San Francisco,
August. ACM.
Julian Kupiec, Jan Pedersen, and Francine Chen. 1995.
A trainable document summarizer. In Proceedings of
the Fourteenth Annual International ACM/SIGIR Con-
ference on Research and Developmnet in Information
Retrieval, pages 68–73, Seattle.
Hang Li. 1998. A Probabilistic Approach to Lexical Se-
mantic Knowledge Acquistion and Structural Disam-
biguation. Ph.D. thesis, University of Tokyo, Tokyo.
Daniel Marcu. 1999. Discourse trees are good indicators
of importance in text. In Indejeet Mani and Mark T.
Maybury, editors, Advances in Automatic Text Summa-
rization, pages 123–136. The MIT Press.
Yuji Matsumoto, Akira Kitauchi, Tatsuo Yamashita, and
Yoshitaka Hirano. 1999. Japanese morphological
analysis system chasen version 2.0 manual. Technical
report, NAIST, Ikoma, April. NAIST-IS-TR99008.
Nihon-Keizai-Shimbun-Sha. 1995. Nihon keizai shim-
bun 95 nen cd-rom ban. CD-ROM. Tokyo, Nihon
Keizai Shimbun, Inc.
Tadashi Nomoto and Yuji Matsumoto. 2000. Comparing
the minimum description length principle and boosting
in the automatic analysis of discourse. In Proceedings
of the Seventeenth International Conference on Ma-
chine Learning, pages 687–694, Stanford University,
June-July. Morgan Kaufmann.
Tadashi Nomoto and Yuji Matsumoto. 2001a. The diver-
sity based approach to open-domain text summariza-
tion. Unpublished Manuscript.
Tadashi Nomoto and Yuji Matsumoto. 2001b. An exper-
imental comparison of supervised and unsupervised
approaches to text summarization. In Proceedings of
2001 IEEE International Conference on Data Mining,
pages 630–632, San Jose. IEEE Computer Society.
Tadashi Nomoto and Yuji Matsumoto. 2001c. A new
approach to unsupervised text summarization. In Pro-
ceedings of the24th International ACM/SIGIR Confer-
ence on Research and Development in Informational
Retrieval, New Orleans, September. ACM.
J. Ross Quinlan. 1993. C4.5: Programs for Machine
Learning. Morgan Kaufmann.
Jorma Rissanen. 1997. Stochastic complexity in learn-
ing. Journal of Computer and System Sciences, 55:89–
95.
Gerald Salton, Amit Singhal, Mandara Mitra, and Chris
Buckley. 1999. Automatic text structuring and sum-
marization. In Inderjeet Mani and Mark T. Maybury,
editors, Advances in Automatic Text Summarization,
pages 342–355. The MIT Press. Reprint.
Haixun Wang and Philip Yu. 2001. SSDT: A scalable
subspace-splitting classifier for biased data. In Pro-
ceedings of 2001 IEEE International Conference on
Data Mining, pages 542–549, San Jose, December.
IEEE Computer Society.
Kenji Yamanishi. 1997. Data compression and learning.
Journal of Japanese Society for Artificial Intelligence,
12(2):204–215. in Japanese.
Klaus Zechner. 1996. Fast generation of abstracts from
general domain text corpora by extracting relevant sen-
tences. In Proceedings of the 16th International Con-
ference on Computational Linguistics, pages 986–989,
Copenhagen.