Báo cáo khoa học: H2O2, but not menadione, provokes a decrease in the ATP and an increase in the inosine levels in Saccharomyces cerevisiae An experimental and theoretical approach pot
Bạn đang xem bản rút gọn của tài liệu. Xem và tải ngay bản đầy đủ của tài liệu tại đây (412.31 KB, 12 trang )
H
2
O
2
, but not menadione, provokes a decrease in the ATP
and an increase in the inosine levels in
Saccharomyces cerevisiae
An experimental and theoretical approach
Hugo Osorio
1,2
, Elisabete Carvalho
1
, Mercedes del Valle
1
, Marı
´
aA.Gu¨ nther Sillero
1
,
Pedro Moradas-Ferreira
2
and Antonio Sillero
1
1
Departamento de Bioquı
´
mica, Instituto de Investigaciones Biome
´
dicas Alberto Sols UAM/CSIC, Facultad de Medicina, Madrid,
Spain;
2
Instituto de Biologı
´
a Molecular e Celular, Instituto de Cie
ˆncias
Biome
´
dicas Abel Salazar, Universidade do Porto, Portugal
When Saccharomyces cerevisiae cells, grown in galactose,
glucose or mannose, were treated with 1.5 m
M
hydrogen
peroxide (H
2
O
2
) for 30 min, an important decrease in the
ATP, and a less extensive decrease in the GTP, CTP, UTP
and ADP-ribose levels was estimated. Concomitantly a net
increase in the inosine levels was observed. Treatment with
83 m
M
menadione promoted the appearance of a compound
similar to adenosine but no appreciable changes in the
nucleotide content of yeast cells, grown either in glucose or
galactose.
Changes in the specific activities of the enzymes involved
in the pathway from ATP to inosine, in yeast extracts from
(un)treated cells, could not explain the effect of H
2
O
2
on the
levels of ATP and inosine. Application of a mathematical
model of differential equations previously developed in this
laboratory pointed to a potential inhibition of glycolysis as
the main reason for that effect. This theoretical consideration
was reinforced both by the lack of an appreciable effect of
1.5 m
M
(or even higher concentrations) H
2
O
2
on yeast grown
in the presence of ethanol or glycerol, and by the observed
inhibition of the synthesis of ethanol promoted by H
2
O
2
.
Normal values for the adenylic charge, ATP and inosine
levels were reached at 5, 30 and 120 min, respectively, after
removal of H
2
O
2
from the culture medium. The strong
decrease in the ATP level upon H
2
O
2
treatment is an import-
ant factor to be considered for understanding the response of
yeast, and probably other cell types, to oxidative stress.
Keywords: Saccharomyces cerevisiae; hydrogen peroxide;
menadione; glycolysis; oxidative stress.
Our laboratory has been engaged for several years in the
study of the metabolism and function of dinucleoside
polyphosphates [1,2] and purine nucleotides [3]. Initially, the
aim of the work presented here was to investigate potential
changes in the level of diadenosine tetraphosphate (Ap
4
A)
in Saccharomyces cerevisiae subjected to oxidative stress,
based on previous work by others describing the increase of
Ap
4
A in yeast and in other microorganisms, when subjected
to heat shock or oxidative stress [4,5]. However, whereas we
did not observe significant changes in the level of Ap
4
A,
important variations in the concentration of other nucleo-
tides were noticed; as shown below, this finding prompted
us to investigate in more detail the influence of oxidative
stress in yeast nucleotide metabolism.
Oxygen is both the support to maintain the aerobic
metabolism of organisms and a source of damaging reactive
free radicals [6]. Molecular oxygen (O
2
) contains two
unpaired electrons, both with the same spin, and its
reactivity as a free radical is rather limited. Upon accepting
one electron, molecular oxygen generates a very reactive
superoxide radical (
Æ
O
2
–
), with one unpaired electron.
Further additions of electrons and combination with
protons generate a variety of oxygen derivatives of biolo-
gical interest [6,7].
The reduced NADH and FADH
2
are reoxidized by
molecular oxygen with formation of H
2
O [8,9]. Although
this process is very efficient, the electron flow throughout
the respiratory chain may produce reactive oxygen
species (ROS) as byproducts, such as superoxide anion
radical, hydroxyl radical and hydrogen peroxide. Some
of these reactive species can also be formed during the
oxidation of arachidonic acid, and in different reactions
catalyzed by nitric oxide synthase, xanthine oxidase,
glucose oxidase, monoamine oxidase, and P450 enzymes
[6,10].
Although H
2
O
2
itself is not a free radical, it can be
decomposed through the Fenton reaction to generate
hydroxyl radical (Fe
2+
+H
2
O
2
À! Fe
3+
+
Æ
OH +
OH
–
). Moreover, H
2
O
2
, superoxide and hydroxyl radical
(
Æ
OH) can be interconverted via the Haber–Weiss
reaction.
Correspondence to A. Sillero, Departamento de Bioquı
´
mica,
Facultad de Medicicina, Universidad Auto
´
noma de Madrid,
Arzobispo Morcillo 4, 28029 Madrid, Spain.
Tel.: + 34 91 3975413; Fax: + 34 91 5854401;
E-mail:
Abbreviations: ROS, reactive oxygen species; Ino, inosine.
Enzymes: adenosine deaminase (EC 3.5.4.4); adenosine kinase
(EC 2.7.1.20); AMP deaminase (EC 3.5.4.6); AMP 5¢ nucleotidase
(EC 3.1.3.5); IMP 5¢ nucleotidase (EC 3.1.3.5); nucleoside
phosphorylase (EC 2.4.2.1); adenylate kinase (EC 2.7.4.3).
(Received 19 December 2002, revised 13 February 2003,
accepted 20 February 2003)
Eur. J. Biochem. 270, 1578–1589 (2003) Ó FEBS 2003 doi:10.1046/j.1432-1033.2003.03529.x
Fe
3þ
þ
Æ
O
À
2
$ Fe
2þ
þ O
2
Fe
2þ
þ H
2
O
2
! Fe
3þ
þ
Æ
OH þ OH
À
Æ
O
À
2
þ H
2
O
2
!
Æ
OH þ OH
À
þ O
2
Menadione is a cytotoxic quinone acting through a
cycling reaction, implying its one-electron reduction to
a semiquinone radical and subsequent reaction with
molecular oxygen with the formation of the quinone and
superoxide [11].
The oxygen reactive species may oxidatively damage
nucleic acids (producing double-strand breaks, apurinic and
apyrimidic bases), lipids (formation of lipid peroxides), and
proteins (oxidation of the amino acids side chains) [7,12–15].
The yeast S. cerevisiae has been used as model system to
explore the mechanisms underlying the oxidative stress
response, such as exposure to H
2
O
2
or menadione [16–19].
In this study we have assessed the effect of H
2
O
2
and
menadione on the metabolism of purine nucleotides.
Whereas menadione did not alter significantly the levels of
these nucleotides, H
2
O
2
promoted a drastic decrease in the
level of adenine nucleotides and a concomitant increase in
the level of inosine. A plausible explanation of the effect of
H
2
O
2
as inhibitor of glycolysis is presented.
Materials and methods
Materials
Hydrogen peroxide (30%) solution, menadione sodium
bisulfite, auxiliary enzymes, cofactors and substrates were
purchased from Sigma or Roche Molecular Biochemicals.
Yeast nitrogen base was from Difco (catalogue no. 233520).
Hypersil ODS column (4.6 · 100 mm) was from Hewlett-
Packard.
Strain and growth conditions
The strain used in this work was the wild-type W303 1A
from S. cerevisiae, genotype: MATa leu2-3, 112 his3-11,
15 trp1-1, can1-100, ade2-1, ura3-1 [20]. Cells were grown
aerobically at 30 °C in a gyratory shaker (at 180 r.p.m), in a
minimal medium containing (per litre): yeast nitrogen base
without amino acids and ammonium sulfate 1.7 g; ammo-
nium sulfate 5 g; galactose, glucose or mannose 20 g;
leucine 0.08 g; tryptophan, adenine, histidine and uracil
0.04 g each. For growth on nonfermentable carbon sources
the minimal medium contained 3% (v/v) glycerol or 2%
(v/v) ethanol. Cell growth was followed by optical absorb-
ance readings at 600 nm (D
600
¼ 1 corresponds to a
concentration of 1.5 · 10
7
cellsÆmL
)1
).
To determine the wet weight, portions of cell cultures
grown to different cell densities were rapidly filtered and the
filter plus the cells weighed out. One gram of wet yeast has
been found to contain an average of 24 mg of protein.
H
2
O
2
and menadione treatment: control of cell viability
Exponentially growing yeast cells, with a density of about
1.5 · 10
7
cellsÆmL
)1
, were treated with H
2
O
2
or menadione
as indicated in each experiment. The extraction of nucleo-
tides and the determination of enzyme activities were
performed as indicated below. When required, the number
of viable cells after H
2
O
2
or menadione exposure was
determined by spreading appropriate dilutions of cells onto
YEPD plates containing 1.5% agar, and counting the
colonies formed after incubation at 30 °C for 2–3 days.
Extraction of nucleosides and nucleotides
The sampling method was essentially as described in [21].
100-mL portions of the cell culture grown to a density
of around 1.5 · 10
7
cellsÆmL
)1
(1.2 mg wet weightÆmL
)1
),
were rapidly collected by filtration on a nitrocellulose
membrane filter (Millipore, pore size 1.2 lm, 47 mm
diameter) and washed once with 5 mL of a mixture of
methanol/water (1 : 1, v/v) at )40 °C. The yeast pellicle was
immediately gathered with the help of a spatula and
immersed in liquid nitrogen. The samples were kept at
)70 °C until extraction. To prepare the acidic extracts 1.2
M
HClO
4
was added to the frozen yeast (0.4 mL per 100 mg
wet weight) and the suspension was frozen and thawed three
times to extract metabolites [22]. Cell debris was removed by
centrifugation and the pellet re-extracted once with 0.2
M
HClO
4
(0.1 mL per 100 mg wet weight). The supernatants
were combined, neutralized with KOH/K
2
CO
3
and ana-
lyzed by HPLC as described previously [23]. The amount of
the nucleosides/nucleotides was determined from the areas
of the corresponding peaks, using the absorption coeffi-
cients obtained from standard curves; their intracellular
concentration was calculated assuming that 1 g of yeast
(wet weight) contains 0.6 mL of intracellular volume [24].
NADH did not interfere with NAD
+
measurements,
because it was destroyed by the acid extraction procedure.
Inosine (Ino) was identified by its retention time and its
nature confirmed by treating the sample, before analysis by
HPLC, with commercial E. coli purine nucleoside phos-
phorylase. In our assay conditions the detection limit was
5 nmoles per gram of yeast cell dry weight.
Energy charge
Energy charge is defined in terms of actual concentrations as
([ATP] + 0.5 [ADP])/([ATP] + [ADP] + [AMP]) [25].
Preparation of cell extracts
All the procedures were carried out at 0–4 °C. Yeast
(200 mL) grown to a cell density of around 1.5 · 10
7
cellsÆ
mL
)1
was harvested by centrifugation, and washed twice
with 10 mL of extraction buffer (20 m
M
sodium phosphate
pH 7.0, 0.1
M
KCl; 0.1 m
M
dithiothreitol). The cells (1 g
wet weight) were disrupted in the presence of 2 mL of buffer
plus 4 g of glass beads (500 lm diameter) by vortexing at
top speed on a tabletop mixer for 6 periods of 1 min
separated by 1-min periods of cooling on ice. The homo-
genate was centrifuged for 5 min at 750 g and the super-
natant centrifuged further at 550 000 g for 30 min. The final
supernatant was dialyzed for 2 h against 200 volumes of
20 m
M
sodium phosphate buffer, pH 7.0; 50 m
M
KCl;
0.1 m
M
dithiothreitol, followed by a second dialysis of 12 h
against the same buffer. All enzyme determinations were
performed with freshly prepared supernatants. Protein
content was determined by the method of Bradford [26].
Ó FEBS 2003 Effect of H
2
O
2
and menadione on S. cerevisiae (Eur. J. Biochem. 270) 1579
Enzymatic assays
Except when indicated, the reaction mixtures (0.15 mL)
contained: 50 m
M
imidazole/HCl buffer pH 7.0, 0.1
M
KCl;
0.1 m
M
dithiothreitol and 4 m
M
MgCl
2
; the appropriate
nucleoside and/or nucleotide, and inorganic phosphate or
ribose-1-phosphate, when required. The reaction, initiated
by the addition of yeast cytosol (around 0.07 mg protein)
was incubated at 30 °C and analyzed by HPLC as follows.
Aliquots of 20 lL were withdrawn from the reaction
mixture at different times of incubation, transferred into
180 lL of water and kept in a boiling water bath for
1.5 min. After chilling, the mixture was filtered and 50 lL
injected into a Hypersil ODS column. Elution was per-
formed as described previously [3]. The nature and the
concentration of the products formed in the course of the
reaction were established by comparison with standards.
Quantification was made from data obtained under linear
conditions of substrate consumption. One unit is defined as
1 lmol of substrate transformed per min. The following
enzyme activities were estimated in the presence of the
indicated substrates or cofactors: adenosine deaminase (EC
3.5.4.4) (0.5 m
M
adenosine); adenosine kinase (EC 2.7.1.20)
(0.2 m
M
adenosine and 1 m
M
ATP); AMP deaminase (EC
3.5.4.6) (5 m
M
AMP and 1 m
M
ATP); AMP 5¢ nucleotidase
(EC 3.1.3.5) (1 m
M
AMP); IMP 5¢ nucleotidase (EC 3.1.3.5)
(1 m
M
IMP, 4 m
M
MgCl
2
and 2 m
M
ATP); nucleoside
phosphorylase (EC 2.4.2.1) (0.5 m
M
inosine and 2 m
M
inorganic phosphate) or (1 m
M
hypoxanthine and 2 m
M
ribose-1-phosphate). Adenylate kinase (EC 2.7.4.3) was
determined spectrophotometrically in the presence of 2 m
M
ADP.
Glucose and ethanol were determined in the medium,
after the yeast cells had been removed by centrifugation,
by the hexokinase/glucose-6-P dehydrogenase [27] and
the alcohol dehydrogenase/acetaldehyde dehydrogenase
coupled assays [28], respectively.
Results
Effect of H
2
O
2
on the nucleotide content
of yeast cells, grown in the presence of galactose,
glucose or mannose
Exponentially growing yeast cells, with galactose as carbon
source, were challenged with 1 m
M
H
2
O
2
for 0, 7, 11, 20
and 30 min incubation (Fig. 1A), and the nucleotide
content analyzed by HPLC as described in Material and
methods. After 11 min incubation in the presence of 1 m
M
H
2
O
2
, the total amount of adenine nucleotides (AMP,
ADP and ATP) decreased by around 50%, with concom-
itant appearance of inosine (Fig. 1A). Incubation times
longer than 30 min in the presence of H
2
O
2
did not greatly
change the ratio SATP + ADP + AMP/Ino. Similar
changes in ATP and inosine concentrations were observed
when yeast cultures were treated for 30 min with different
concentrations (0, 0.3, 0.6, 1.0 and 1.5 m
M
)ofH
2
O
2
(Fig. 1B).
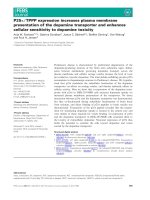
The results presented in Fig. 1 were confirmed by
growing several batches of yeast cells in galactose as
carbon source, in the absence (6 batches) or presence
(7 batches) of 1.5 m
M
H
2
O
2
for 1 h (Table 1). In addition
to AMP, ADP, ATP and Ino, the following compounds
werealsoquantified:CMP,CDP,CTP,GMP,GDP,
GTP, UMP, UDP, UDP, UTP, UDP-sugars, NAD
+
,
NADP
+
, ADP-ribose and hypoxanthine. IMP was not
detected. Representative HPLC nucleotide profiles
obtained from yeast cultures grown in galactose and in
the absence (A) or presence (B) of 1.5 m
M
H
2
O
2
are shown
in Fig. 2. Treatment with 1.5 m
M
H
2
O
2
for 1 h gave rise to
a 10-fold increase in the amount of inosine, a 17-fold
decrease in the ATP level, and a five- to sixfold decrease in
the levels of ADP, CTP, GTP, UTP and ADP-ribose
(Table 1). Changes in the concentration of the other
nucleotides analyzed were less relevant. The nucleoside
mono-, di- and triphosphate pools of adenosine, cytidine,
guanosine and uridine in the untreated vs. the H
2
O
2
-
treated cells decreased around seven-, two-, two- and
1.5-fold, respectively. Although the interpretation of these
results is currently not possible, it seems that, in the
Fig. 1. EffectofH
2
O
2
on (AMP + ADP + ATP) and inosine pools of
S. cerevisiae grown in the presence of galactose as carbon source. Yeast
cells were challenged with 1 m
M
H
2
O
2
for the indicated times of
incubation (A) or with different concentrations of H
2
O
2
for 30 min
(B). AMP, ADP, ATP and inosine contents were determined as des-
cribed in Materials and methods.
1580 H. Osorio et al.(Eur. J. Biochem. 270) Ó FEBS 2003
Table 1. Nucleoside and nucleotide content of S. cerevisiae (strain W303) grown in galactose and treated for 1 h in either 1.5 m
M
H
2
O
2
or 83 m
M
menadione. Exponentially growing yeast cells were challenged with either H
2
O
2
or menadione. Analysis of the nucleotide content was performed as
described in Materials and methods. The data represent mean values ± SE of 6, 7 and 3 experiments for the control, H
2
O
2
-treated and menadione-
treated cells, respectively. The concentrations of the indicated compounds are expressed in m
M
.
Parameters Control H
2
O
2
Menadione H
2
O
2
/Control MD/Control
Starting wet weight (mg) 147 ± 70 185 ± 34 173 ± 9.0 – –
Total protein (mg) 3.7 ± 1.5 3.0 ± 1.2 2.5 ± 0.5 – –
Adenylic charge 0.78 ± 0.03 0.41 ± 0.15 0.86 ± 0.01 0.53 1.10
AMP 0.21 ± 0.04 0.14 ± 0.09 0.08 ± 0.01 0.67 0.38
ADP 0.52 ± 0.18 0.10 ± 0.02 0.26 ± 0.01 0.19 0.50
ATP 1.51 ± 0.32 0.09 ± 0.05 1.15 ± 0.08 0.06 0.76
S (ATP + ADP + AMP) 2.24 ± 0.49 0.33 ± 0.12 1.49 ± 0.08 0.15 0.67
CMP 0.18 ± 0.03 0.14 ± 0.09 0.18 ± 0.08 0.78 1.00
CDP 0.07 ± 0.01 0.04 ± 0.02 0.03 ± 0.01 0.57 0.43
CTP 0.21 ± 0.03 0.04 ± 0.02 0.13 ± 0.01 0.19 0.62
S (CTP + CDP + CMP) 0.46 ± 0.08 0.22 ± 0.03 0.34 ± 0.07 0.48 0.74
GMP 0.06 ± 0.01 0.08 ± 0.02 0.03 ± 0.00 1.33 0.50
GDP 0.18 ± 0.03 0.11 ± 0.07 0.10 ± 0.03 0.61 0.55
GTP 0.30 ± 0.02 0.07 ± 0.03 0.19 ± 0.02 0.23 0.63
S (GTP + GDP + GMP) 0.54 ± 0.06 0.26 ± 0.08 0.32 ± 0.05 0.48 0.59
UMP 0.15 ± 0.06 0.31 ± 0.08 0.27 ± 0.03 2.07 1.80
UDP 0.22 ± 0.04 0.14 ± 0.08 0.12 ± 0.04 0.64 0.54
UTP 0.33 ± 0.08 0.05 ± 0.01 0.07 ± 0.02 0.15 0.21
S (UTP + UDP + UMP) 0.70 ± 0.16 0.50 ± 0.09 0.46 ± 0.05 0.71 0.66
ADP-Rib 0.24 ± 0.11 0.04 ± 0.03 0.05 ± 0.03 0.17 0.21
NAD
+
0.97 ± 0.39 0.95 ± 0.34 0.88 ± 0.04 0.98 0.91
NADP
+
0.06 ± 0.01 0.05 ± 0.02 0.05 ± 0.02 0.83 0.83
UDP-sugars 1.30 ± 0.16 1.18 ± 0.16 1.58 ± 0.41 0.91 1.21
Hypoxanthine 0.11 ± 0.05 0.16 ± 0.06 0.11 ± 0.05 1.45 1.00
Inosine 0.20 ± 0.04 2.07 ± 0.69 0.94 ± 0.57 10.3 4.70
Unknown
a
– – 0.33 ± 0.03 – –
a
The concentration (m
M
) of this compound has been calculated assuming the extinction coefficient of adenosine.
Fig. 2. HPLC nucleotide profile obtained from yeast cells grown in galactose or glucose, as carbon source and in the absence or presence of H
2
O
2
. Yeast
cells grown in the presence of galactose or glucose were challenged, when indicated, with 1.5 m
M
H
2
O
2
for 1 h. Thereafter nucleotides were
extracted and analyzed by HPLC as described in Materials and methods. The chromatographic peaks, identified by its UV spectra and time of
elution, correspond to (1) Hyp, (2) Ino, (3) NAD
+
, (4) (unknown compound whose spectrum has a maximum at 280 nm), (5) UDP-sugars, (6)
AMP, (7) ADP-rib, (8) NADP
+
, (9) ADP, (10) GTP, (11) UTP and (12) ATP.
Ó FEBS 2003 Effect of H
2
O
2
and menadione on S. cerevisiae (Eur. J. Biochem. 270) 1581
presence of H
2
O
2
, the adenine nucleotide content is
diverted towards inosine, and that the adenylic charge
value decreases, from a standard value of around 0.8 to a
value of around 0.4.
Similar results to those obtained with galactose,
concerning variations in the levels of ATP and Ino
(Fig. 1) were obtained when yeast cells grown in glucose
were treated with different concentrations (0, 0.5, 1.0 and
1.5 m
M
)ofH
2
O
2
(results not shown). As was the case for
galactose, the experiments were performed using five
different batches of yeast cells, in the absence or presence
of 1.5 m
M
H
2
O
2
for 1 h (Table 2). In the presence of
H
2
O
2
there was a decrease of about threefold in the
content of adenosine, cytidine and uridine, and twofold
for guanosine nucleotides. The nucleoside triphosphates
were the most affected by the H
2
O
2
treatment. The
decrease in ATP (5.6-fold) was almost coincident with the
increase in Ino (5.7-fold). By contrast, the concentration
of NAD
+
remained almost constant after H
2
O
2
-treatment
of yeast cells growing either in galactose or glucose. A
representative chromatographic profile of a batch of yeast
cells growing in glucose, in the absence or presence of
1.5 m
M
H
2
O
2
is also depicted in Fig. 2C,D.
When mannose was used as a carbon source, similar
results to those described for glucose were obtained (results
not shown).
Effect of menadione on the nucleotide content
of yeast cells
Here we tried to compare the effect of H
2
O
2
on yeast cells
with that of menadione, a different oxidative agent. As for
H
2
O
2
, we started by assaying the effect of different
concentrations of menadione (10, 30, 83, 90 and 110 m
M
)
on cell viability (results not shown) and noticed that 83 m
M
menadione produced a viability similar to that evoked by
1.5 m
M
H
2
O
2
(around 40% after 60 min treatment.) Based
on these experiments, three batches of yeast cells growing
exponentially in a medium containing galactose (Table 1) or
glucose (Table 2), were treated for 1 h with 83 m
M
mena-
dione. In general, the variations in the concentration of the
nucleoside triphosphates induced by menadione are lower
than those promoted by H
2
O
2
treatment. In all the
chromatograms corresponding to menadione-treated yeast
cells, a new peak with a retention time of around 4.0 min
was observed (Tables 1 and 2, and results not shown).
Although its UV spectrum coincides with that of adenosine,
both compounds are different because (a) they elute in a
slightly different chromatographic position (not shown) and
(b) they behave differently as substrates of adenosine
deaminase: the new chromatographic peak is insensitive to
the enzyme, in the same experimental conditions that
adenosine is transformed to inosine (results not shown).
Table 2. Nucleoside and nucleotide content of S. cerevisiae (strain W303) grown in glucose and treated for 1 h with either 1.5 m
M
H
2
O
2
or 83 m
M
menadione. Exponentially growing yeast cells were challenged with either H
2
O
2
or menadione. Analysis of the nucleotide content was performed as
described in Materials and methods. The data represent mean values ± SE of 5, 5 and 3 experiments for the control, H
2
O
2
-treated and menadione-
treated cells, respectively. The concentrations of the indicated compounds are expressed in m
M
.
Parameters Control H
2
O
2
Menadione H
2
O
2
/ Control MD/ Control
Starting wet weight (mg) 123 ± 42 124 ± 6 147 ± 17 – –
Total protein (mg) 2.7 ± 0.8 3.2 ± 1.4 4.7 ± 1.6 – –
Adenylic charge 0.89 ± 0.02 0.53 ± 0.10 0.85 ± 0.05 0.60 0.96
AMP 0.05 ± 0.01 0.16 ± 0.04 0.08 ± 0.04 3.20 1.60
ADP 0.18 ± 0.02 0.12 ± 0.03 0.18 ± 0.05 0.67 1.00
ATP 1.07 ± 0.08 0.19 ± 0.10 0.90 ± 0.14 0.18 0.84
S (ATP + ADP + AMP) 1.30 ± 0.09 0.47 ± 0.12 1.16 ± 0.06 0.36 0.89
CMP 0.04 ± 0.01 0.03 ± 0.02 – 0.75 –
CDP 0.04 ± 0.02 0.02 ± 0.01 0.05 ± 0.01 0.50 1.25
CTP 0.22 ± 0.03 0.05 ± 0.03 0.28 ± 0.01 0.23 1.27
S (CTP + CDP + CMP) 0.30 ± 0.04 0.10 ± 0.03 – 0.33 –
GMP 0.02 ± 0.01 0.03 ± 0.02 – 1.50 –
GDP 0.05 ± 0.01 0.05 ± 0.01 0.05 ± 0.01 1.00 1.00
GTP 0.16 ± 0.02 0.06 ± 0.03 0.18 ± 0.02 0.37 1.12
S (GTP + GDP + GMP) 0.23 ± 0.14 0.14 ± 0.04 – 0.61 –
UMP 0.06 ± 0.03 0.07 ± 0.06 – 1.17 –
UDP 0.06 ± 0.01 0.06 ± 0.01 0.06 ± 0.01 1.00 1.00
UTP 0.53 ± 0.07 0.10 ± 0.04 0.41 ± 0.08 0.19 0.77
S (UTP + UDP + UMP) 0.65 ± 0.07 0.23 ± 0.05 – 0.35 –
ADP-Rib 0.11 ± 0.03 0.02 ± 0.00 0.05 ± 0.01 0.18 0.45
NAD
+
0.62 ± 0.12 0.97 ± 0.12 0.64 ± 0.12 1.59 1.05
NADP
+
0.04 ± 0.02 0.02 ± 0.01 0.04 ± 0.00 0.50 1.00
UDP-sugars 0.49 ± 0.09 0.59 ± 0.19 0.40 ± 0.12 1.20 0.82
Hypoxanthine 0.10 ± 0.01 0.15 ± 0.05 0.04 ± 0.01 1.50 0.40
Inosine 0.20 ± 0.06 1.16 ± 0.28 0.22 ± 0.06 5.80 1.10
Unknown
a
– – 0.44 ± 0.09 – –
a
The concentration (m
M
) of this compound has been calculated assuming the extinction coefficient of adenosine.
1582 H. Osorio et al.(Eur. J. Biochem. 270) Ó FEBS 2003
This new unknown chromatographic peak, not present in
the preparation of menadione used, may correspond to a
derivative of adenosine.
Effect of H
2
O
2
on yeast cells growing in the presence
of glycerol or ethanol
To obtain further insight into the oxidative effect of H
2
O
2
(see below), yeast cells were grown in the presence of 3%
glycerol as carbon source, and challenged with 1, 2, 3 and
4m
M
H
2
O
2
. A concentration of H
2
O
2
as high as 4 m
M
did
not change the HPLC nucleotide profile obtained with
untreated cells (results not shown). In a different experi-
ment, yeast cells were grown in the presence of 2% ethanol
as a carbon source, and challenged with 1.5 m
M
H
2
O
2
for
1 h; again, no significant changes in the nucleotide content
were observed in relation to the control cells (results not
shown). It seems that, with respect to nucleotide metabo-
lism, yeast cells grown in ethanol or glycerol as carbon
sources are more resistant to H
2
O
2
than those grown in the
presence of galactose or glucose.
Search for a plausible mechanism
A mechanism to explain the different effects of H
2
O
2
on the
nucleotide content of yeast grown in the presence of hexoses
(galactose, glucose or mannose), glycerol or ethanol was
sought.
To explore the reasons for the decrease in ATP and the
increase in Ino promoted by H
2
O
2
in yeast cells growing in
the presence of galactose, glucose or mannose, we followed
an approach partially based on a previous study from our
laboratory [3]. In that work, the metabolic pathways of
AMP, GMP, IMP and XMP catalyzed by rat brain cytosol
were explored using two complementary (experimental and
theoretical) approaches.
Experimental approach – determination of enzyme acti-
vities related to adenine metabolism. Enzyme activities
related to adenine metabolism were determined in the
cytosol of yeast cells, grown in glucose and in the absence or
presence of 1.5 m
M
H
2
O
2
.
The pathways considered here to approach the meta-
bolism of adenine nucleotides in yeast cells subjected (or
not) to oxidative stress, together with the differential
equation describing these pathways are represented in
Figs 3 and 4, respectively. The enzymes considered in the
pathway from ATP to Ino were E
1
(AMP 5¢-nucleoti-
dase), E
2
(IMP-GMP specific 5¢–nucleotidase), E
3
(AMP
deaminase), E
4
(adenosine deaminase), E
5
(purine nucleo-
side phosphorylase), E
6
(adenylate kinase), E
7
(adenosine
kinase), E
8
(a hypothetical enzyme catalyzing two general
and reversible reactions), E
8d
(synthesis of ATP through
the glycolytic pathway) and V
8r
(degradation of ATP
through general anabolic processes).
Enzyme activities were determined as described in
Materials and methods. To avoid enzyme inactivation,
only fresh (not frozen) cytosol was used. Reaction mixtures
were set up containing the yeast cytosol, and the concen-
tration of substrate(s) and buffering conditions that we
considered pertinent (based on the literature) to render
linear formation of products. The results obtained and the
kinetic constants taken from the literature are compiled in
Table 3. As a representative example, mixtures containing
1.8 m
M
ATP, 0.8 m
M
ADP and 0.34 m
M
AMP were
incubated with cytosol from yeast cells grown in glucose in
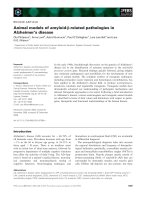
Fig. 3. Adenine and hypoxanthine nucleotide metabolism in yeast cyto-
sol. The pathways considered are those shown in the Figure. The
enzymes involved are E
1
,5¢-nucleotidase acting on AMP and IMP; E
2
,
IMP-GMP specific 5¢-nucleotidase; E
3
,AMPdeaminase;E
4
,adeno-
sine deaminase; E
5
, purine nucleoside phosphorylase; E
6
, adenylate
kinase; E
7
, adenosine kinase; E
8
,hypotheticalenzymerecyclingATP.
Fig. 4. Differential equations describing the fluxes operating in the
pathways from ATP to hypoxanthine, as described in Fig. 3. V
n
,
maximum velocity of the reaction catalyzed by E
n
,onthesubstrate
indicated. The velocity equations considered for E
1
,E
3
,E
4
,E
5
,E
6
and
E
7
were as in Torrecilla et al. [3]; those for E
2
and E
8
are indicated in
the text and Table 3.
Ó FEBS 2003 Effect of H
2
O
2
and menadione on S. cerevisiae (Eur. J. Biochem. 270) 1583
the absence (Fig. 5A) or presence of 1.5 m
M
H
2
O
2
(not
shown). The rate of adenine nucleotide degradation and the
appearance of intermediate products were essentially the
same in both cases and, above all, no appreciable differences
in the rates of disappearance of ATP or appearance of Ino
were observed.
Theoretical approach – mathematical simulation of some
metabolic pathways related to adenine nucleotide meta-
bolism. This was a theoretical approach. The simulation
was started by stating the metabolic pathways from ATP to
Ino (Fig. 3), writing the opportune differential equations
(Fig. 4) and solving them with the help of the
MATHEMAT-
ICA
-3.0 program [37]. The equation velocities considered for
the enzymes involved were essentially as described in [3],
with the following main modifications. The kinetic proper-
ties of E
2
(5¢-nucleotidase for IMP) from yeast [30] are
different to those described for the enzyme from rat brain
[38]. The sigmoidal kinetic toward IMP reported for the
yeast enzyme changed to near-hyperbolic in the presence of
ATP [30], i.e. a behavior similar to that previously described
for the AMP deaminase. Accordingly [3] the velocity
equation used for 5¢-IMP nucleotidase was settled as:
m
2
¼
V
2IMP
½IMP
n
½IMP
n
þ½S
0:5
n
where n ¼ 1.7–1.2[ATP]/(K
a2ATP
+ [ATP]) and S
0.5
¼
K
m2IMP
–(F2K [ATP]/(K
a2ATP
+ [ATP])).
From both the enzyme properties reported by Itoh [30],
and experiments from this laboratory (not shown), the
following values were used:
K
a2ATP
¼ 1250; F2K ¼ 200 (Fig. 5) or 100 (Fig. 6) (see
[3], and Table 3, for further explanations on the significance
of these parameters).
The equation described as V
8d
and V
8r
, and the corres-
ponding substrates and products were not considered at this
stage (i.e. V
8d
¼ V
8r
¼ 0, see below). Taking into account
the above values, application of the
MATHEMATICA
-3.0
program [37] to the case of a reaction mixture containing
ATP, ADP and AMP (at the same concentrations as those
present in the experimental approach, Fig. 5A) produced
Table 3. V
max
, K
m
and K
i
values of enzymes involved in the adenine and hypoxanthine metabolism in yeast cytosol. V
max
values represent the average
of a minimum of three determinations obtained from different batches of yeast cells grown in glucose, with H
2
O
2
results determined in the yeast
cytosol, and grown for 30 min in the presence of 1.5 m
M
H
2
O
2
. K
i
values of the products were assumed equal to the K
m
values of the substrate in the
cases of enzymes E
2
,E
5
,E
6
,E
7
and E
8
.E
n
represents the enzymes as specified in Fig. 3.
Enzyme Substrate
V
max
(mUÆmg
)1
)
K
m
(l
M
) K
i
(l
M
)
Control H
2
O
2
E
1
AMP 10.4 ± 1.4 11.6 ± 2.2 200 [29] 640 (Ado) [29]
5¢-AMP nucleotidase IMP 12.7 ± 0.9 11.8 ± 2.2 540 [29] 8600 (Ino) [29]
27.2 ± 5.4 (ATP)
37.5 ± 8.9 (ADP)
E
2
IMP 5.7 ± 0.8
a
3.1 ± 0.7
a
400 [30] 400 (Ino)
5¢-nucleotidase 300 [30]
a
300 (Ino)
IMP-GMP specific 2000
b
1800
a,b
2000 (Ino)
5000 (P
i
) [30]
E
3
AMP 29.2 ± 2.4
a
24.4 ± 7.5
a
2670 [31] 4700 (IMP) [31]
AMP deaminase 500 [31]
a
E
4
Ado 0.8 ± 0.2 0.6 ± 0.2 40.7 [32] 28 (Ino) [32,33]
Adenosine deaminase
E
5
Ino 10.9 ± 1.7 11.6 ± 1.0 166 [34] 166
Nucleoside phosphorylase Pi 1600 1600
Hyp 29.4 ± 1.4 33.4 ± 0.6 22 [35] 22
Rib-1P 320 [35] 320
E
6
AMP 4000
c
4297
c
34 [36] 34
Adenylate kinase ADP 2414 ± 621 2593 ± 557 23 [36] 23
ATP 4000
c
4297
c
63 [36] 63
E
7
Ado 203 ± 97 216 ± 61 2.8 [35] 2.8 (Ado)
Adenosine kinase 220 (ATP) [35] 220 (ATP)
200 (AMP) [35]
1200 (ADP) [35]
E
8
ATP 200
c
33 33
X 200
c
100 100
ADP 4000
c
33 33
X-P 4000
c
100 100
a
Values obtained in the presence of ATP.
b
K
m
values determined in yeast cytosol, and used in the theoretical simulation depicted in Fig. 5.
c
Values calculated using
MATHEMATICA
-3.0 program.
1584 H. Osorio et al.(Eur. J. Biochem. 270) Ó FEBS 2003
similar rates of disappearance of substrates and appearance
of products (Fig. 5B).
Inhibition of glycolysis as a plausible theoretical explan-
ation for increased inosine. Yeast cells treated with H
2
O
2
and grown in galactose, glucose or mannose showed an
increase in inosine level, for which the inhibition of glycolysis
was proposed as a possible theoretical explanation.
The results from Fig. 1 and Table 1, suggested that (a)
the main if not unique source of inosine is the intracellular
pool of adenine nucleotides, (b) the decrease in ATP and the
increase in inosine, promoted by H
2
O
2
, cannot be explained
solely by a change in the level of the enzymes more directly
involved in the nucleotide pathway from ATP to inosine
(Fig. 3), so that (c) other factors should account for those
changes.
When yeast cells are grown in glucose, galactose or
mannose, ATP is generated mainly through the glycolytic
pathway, and used in diverse anabolic pathways [39,40]. We
speculated that changes in the relative rates of both
processes could affect the actual concentration of ATP
and hence the rate of synthesis of inosine. It is here assumed
that the complex processes of syntheses and degradation of
ATP in vivo (involving many enzymes) is carried out by a
hypothetical unique enzyme (E
8
) catalyzing both the
synthesis of ATP in the direct reaction (E
8d
)andthe
phosphorylation/transformation of substrates with partici-
pation of ATP in the reverse direction (E
8r
):
ADP þ X-P $ ATP þ X
where X and X-P represent a pool of unphosphorylated
and phosphorylated unspecified substrates, respectively.
This hypothetical enzyme has been used to test, with the
help of the mathematical model described in [3], whether
different rates of synthesis of ATP would modify the
intracellular pool of inosine.
The reaction catalyzed by E
8
is here supposed to be
similar to that catalyzed by adenylate kinase, i.e. random-
bireactant [41], and the corresponding velocity equation is:
m
8
¼
[ADP][SÀP]V
8d
K
m8ADP
K
m8SÀP
À
[ATP][S]V
8r
K
m8ATP
K
i8S
1 þ
[ADP]
K
i8ADP
þ
[SÀP]
K
i8sÀp
þ
[ADP][SÀP]
K
m8ADP
K
i8SÀP
þ
[ATP]
K
i8ATP
þ
[S]
K
i8S
þ
[S][ATP]
K
m8S
K
i8ATP
The following kinetic constants were established to solve
the equation:
K
m8ADP
¼ K
i8ADP
¼ K
m8ATP
¼ K
i8ATP
¼ 0:033 mm
K
m8SÀP
¼ K
i8SÀP
¼ K
m8S
¼ K
i8S
¼ 0:1mm
½X¼½X-P¼0:1mm:
As this hypothetical activity represents the activity of
many enzymes, we have chosen representative mean
values for the kinetic constants of the enzyme E
8
, in the
order of m
M
, while the concentrations of ATP and ADP
were considered as variables.
With these characteristics, the maximum velocities in the
direct (V
8d
, synthesis of ATP) and in the reverse (V
8r
,
synthesis of ADP) directions were mathematically adjusted,
using the
MATHEMATICA
-3.0 program (to 4000 and 200,
respectively) to keep the level of ATP during the application
of the mathematical procedure nearly constant (Fig. 6B).
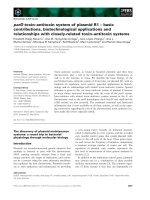
Metabolic situations conveying diminution in the rate of
formation of ATP from ADP (i.e. inhibition of glycolysis)
were simulated by decreasing V
8d
from 4000 (Fig. 6B) step
by step to 500, and leaving constant V
8r
at 200 (Fig. 6C–F).
The graph in Fig. 6A represents an extreme situation in
which V
8d
¼ V
8r
¼ 0. Together, the graphs depicted in
Fig. 6B–F show that the inhibition in the rate of synthesis of
ATP from ADP is accompanied by an increase in the rate of
synthesis of Ino, without any need to modify the kinetic
parameters or activities of the enzymes involved in the
pathway from ATP to Ino.
Being aware of the simplifications involved in these
calculations (where so many more enzymes participate
in vivo), these results would indicate that H
2
O
2
diminishes
the rate of synthesis of ATP, probably through inhibition of
glycolysis. It is worth noting that H
2
O
2
has no appreciable
effect on the level of ATP on yeast cells grown in ethanol or
glycerol, that are metabolized through an oxidative pathway.
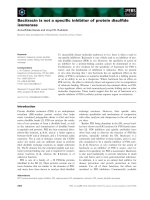
Fig. 5. Metabolism of ATP, ADP, AMP in the presence of cytosol from
yeast growing in glucose, in the absence or presence of H
2
O
2
– theoretical
simulation. The reaction mixtures contained: 50 m
M
imidazole/HCl
buffer, pH 7.0; 0.1
M
KCl; 0.1 m
M
dithiothreitol; 4 m
M
MgCl
2
;
1.8 m
M
ATP; 0.8 m
M
ADP; 0.34 m
M
AMP and cytosol from yeast
cells grown in the absence (A) or presence (result not shown) of 1.5 m
M
H
2
O
2
, for 60 min. Aliquots were taken at the indicated times and
analyzed by HPLC. In (B) application of the theoretical model was
performed with the
MATHEMATICA
-3.0 program, as described in the
text and in [3]. The V-values, from control cells, and the kinetic
parameters described in Table 3 were used.
Ó FEBS 2003 Effect of H
2
O
2
and menadione on S. cerevisiae (Eur. J. Biochem. 270) 1585
Effect of H
2
O
2
on glycolysis
From the above, it seemed obvious to verify in our
experimental conditions the effect of H
2
O
2
on either the
rate of glucose consumption or on the rate of synthesis of
ethanol. At the usual concentrations of both glucose (2%)
and yeast cells (around 1.2 D
600
units per mL), at which
the effect of H
2
O
2
was previously tested, the consumption
of glucose (in control and treated cells) was so low that its
disappearance from the culture medium could not be
detected. However, at higher yeast cells (91 D
600
units per
mL) and H
2
O
2
(15 m
M
) concentrations, a decrease in the
consumption of glucose was clearly observed a few
minutes after the onset of the H
2
O
2
treatment (results
not shown).
The rate of ethanol production by yeast cells growing in
glucose was also determined as a parameter to measure
potential inhibition of glycolysis by H
2
O
2
. As shown in
Fig. 7, treatment of yeast cells with 0, 0.05, 0.1, 0.3, 0.5 and
1.5 m
M
H
2
O
2
promoted a dose-dependent decrease in the
rate of synthesis of ethanol.
Recovery of yeast cells after the oxidative stress
caused by H
2
O
2
A yeast culture grown in glucose was challenged with
1.5 m
M
H
2
O
2
for 30 min. After this treatment, cells were
separated by centrifugation, resuspended in fresh medium
without H
2
O
2
, and aliquots taken at 0, 30, 60, 90 and
120 min incubation. As expected, the ATP content was very
low after the H
2
O
2
treatment (time zero) and the inosine
concentration very high (Fig. 8). After 30 min incubation in
the absence of H
2
O
2
, the recovery of ATP was almost
complete, while the return of inosine to normal values was
much slower.
Discussion
The results presented above are clear, concerning the effect
of H
2
O
2
on the yeast strain W303 of Saccharomyces
cerevisiae. In the presence of glucose, galactose or mannose,
Fig. 6. Influence of the hypothetical enzyme
(E
8
) recycling ATP, on the rate of synthesis of
inosine. Application of the theoretical model
was performed with the
MATHEMATICA
-3.0
program, as described in the text and in [3].
Simulation was made considering the kinetic
values for the enzymes E
1
–E
7
determined in
the cytosol of control cells, grown in glucose.
InthecaseofenzymeE2,theK
m
values
described in [30] were used (Table 3). Graphs
A–Fwerecomputermadeusingthefollowing
additional values, respectively, for V
8d
and
V
8r
: A (0,0); B (4000, 200); C (3500, 200);
D (3000, 200); E (2500, 200); F (2000, 200).
Fig. 7. EffectofH
2
O
2
on the synthesis of ethanol by S. cerevisiae. Yeast
cells, grown in glucose as carbon source, were challenged with 0; 0.05;
0.1; 0.3; 0.5 and 1.5 m
M
H
2
O
2
. Ethanol was determined in the medium,
at the indicated times, as described in Materials and methods.
1586 H. Osorio et al.(Eur. J. Biochem. 270) Ó FEBS 2003
H
2
O
2
evokes a decrease and an increase in the intracellular
concentration of ATP and inosine, respectively. Searching
for the rationale for these phenomena, possible changes in
the specific activities of enzymes directly involved in the
pathway from ATP to Ino were explored in extracts from
normal and oxidatively stressed cells (Table 3). At first
glance, the changes in the activities of those enzymes did not
account for the changes in the ATP or inosine levels. This
impression was quantified with the help of a mathematical
model of differential equations describing the changes in
substrate and product concentration in a metabolic path-
way as a function of the kinetic constants of the enzymes
involved in that pathway [3]. Application of this method
pointed to the inhibition of the rate of synthesis of ATP by
the glycolytic route as a potential reason for the changes in
ATP and inosine levels, provoked by H
2
O
2
. This assump-
tion was experimentally tested by measuring the consump-
tion of glucose and the synthesis of ethanol in yeast cells
treated with H
2
O
2
, which produced a decrease in both the
consumption of glucose and synthesis of ethanol. The
apparent effect of H
2
O
2
on glycolysis was further confirmed
by the lack of effect of H
2
O
2
when yeast cell were grown in
glycerol or ethanol, two oxidative substrates. The possibility
that the resistance to H
2
O
2
in these last two cases may be
due to a stronger expression of antioxidant enzymes has not
been explored.
The effect of H
2
O
2
on yeast cells had been previously
analyzed from several perspectives. Cabiscol et al.[42]
observed the formation of carbonyl groups in several amino
acid side chains of proteins after treatment of yeast with
H
2
O
2
and menadione. Here, mitochondrial proteins (E2
subunits of both pyruvate kinase and a-ketoglutarate
dehydrogenase, aconitase and heat shock protein 60) and
the cytosolic fatty acid synthetase and glyceraldehyde
3-phosphate dehydrogenase were the enzymes mainly affec-
ted by the H
2
O
2
treatment [42]. In line with the results
reported in this study, the activity of glyceraldehyde 3-phos-
phate dehydrogenase (one of the two enzymes in glycolysis
responsible for the synthesis of ATP through substrate level
phosphorylation) was 85 and 53% (in relation to an
untreated control) in yeast cells subjected to H
2
O
2
treatment
and grown in glycerol or glucose, respectively [42]. A similar
observation concerning carbonylation of key metabolic
enzymes by H
2
O
2
has been described recently by Costa
et al. [43]. These authors observed an 80% reduction of
glyceraldehyde 3-phosphate dehydrogenase upon incuba-
tion of yeast cells with 1.5 m
M
H
2
O
2
[43]. In this regard,
preliminary results from our laboratory showed a fivefold
increase in the level of fructose 1,6-bisphosphate concentra-
tion in H
2
O
2
treated cells (unpublished results). Moreover, it
seems to us important to emphasize that the effect of H
2
O
2
on glycolysis is likely to be reversible, as ATP and inosine
levels are restored upon washing H
2
O
2
from the cells and
resuspending them in fresh medium. The recovery appears
quite fast, which probably suggests covalent modification of
protein(s) (i.e. glyceraldehyde 3-phosphate dehydrogenase)
and precludes any in vivo protein synthesis.
Considering that ATP is the center of a very important
metabolic crossroads [44], other possibilities could be
contemplated to explain the decrease of ATP promoted
by H
2
O
2
, such as the inhibition of the transport of hexoses
(what could be considered as an inhibition of glycolysis) or
an increase in ATPase activity. This latter possibility does
not seem to be operative in this case, as the ATPase activities
found by us in the cytosol from untreated or H
2
O
2
-treated
cells were 5.2 ± 2.3 and 5.5 ± 1.9 mUÆmg
)1
protein,
respectively. Moreover, application of the theoretical
method, taking into accounts these values, did not alter
significantly the rate of ATP degradation.
The decrease in ATP promoted by H
2
O
2
could be also
compared with the decrease of this nucleotide promoted by
the mutation in the gene responsible for the synthesis of
trehalose 6-phosphate (TPS-1), which is accompanied also
by an increase in glucose 6-phosphate. In the case of tps-1
mutants, the decrease in ATP and the increase in glucose
6-phosphate in yeast grown in glucose could be explained by
an enhanced activity of hexokinase produced by both the
release of its inhibition by trehalose 6-phosphate and/or by
the proper effect of the TPS-1 gene product [45–49], two
conditions most probably not prevalent in the H
2
O
2
-treated
yeast cells, where the decrease of ATP is accompanied by a
decrease of about twofold in the glucose 6-phosphate level
(unpublished results from this laboratory).
Godon et al. [50] approached the effect of H
2
O
2
on
S. cerevisiae in a different way. Yeast grown in minimal
medium containing 2% glucose were treated with 0.4 m
M
H
2
O
2
for 15 min and subsequently pulse-labeled with
[
35
S]methionine from 15 to 30 min. Total proteins were
then extracted and subjected to two-dimensional gel elec-
trophoresis. They observed that at least 115 proteins were
repressed and 52 induced by this treatment. Two isozymes
of glyceraldehyde 3-phosphate dehydrogenase were
repressed by this treatment. Godon et al.[50]didnot
perform the same experiment growing yeast in the presence
of glycerol or ethanol as carbon sources.
The response of S. cerevisiae to stress is also dependent
on its redox state. However, as shown in [51] the metabolic
basis for this behavior is still not clear. Deficiency in
glutathione reductase promotes a higher imbalance in the
ratio of reduced glutathione to total glutathione than that
produced by glucose 6-phosphate dehydrogenase deficiency.
However, in contrast to what would be expected, cells
Fig. 8. Recovery of ATP after treatment of yeast cells with H
2
O
2
. Yeast
cells grown in glucose, were treated with 1.5 m
M
H
2
O
2
for 30 min,
collected by centrifugation, resuspended in fresh medium (without
H
2
O
2
) and incubated further for 120 min. At the times indicated, the
adenylic charge, ATP and inosine were determined as described in
Materials and methods.
Ó FEBS 2003 Effect of H
2
O
2
and menadione on S. cerevisiae (Eur. J. Biochem. 270) 1587
deficient in this enzyme are comparatively more sensitive to
H
2
O
2
stress than those deficient in glutathione reductase.
Izawa et al. [51] concluded that glucose 6-phosphate
dehydrogenase appears to play other important roles in
the adaptive response to H
2
O
2
stress besides supplying
NADPH for the recycling of glutathione.
Our work is also in line with previous reports indicating
that H
2
O
2
and menadione have different effects on yeast
[52–54]. S. cerevisiae cells subjected to treatment with H
2
O
2
(0.2 m
M
for60min)weremoreresistantto4m
M
menadi-
one. However, pretreatment with menadione did not induce
resistance to H
2
O
2
and different polypeptides were synthe-
sized as response to treatment with menadione or H
2
O
2
[53].
Partially different results were reported later [54] using
Schizosaccharomyces pombe. Cells pretreated with a low
dose of menadione became resistant to a lethal dose of
H
2
O
2
, whereas cells pretreated with H
2
O
2
became only
partially resistant to a lethal dose of menadione. The pattern
of induction of several oxidative defence enzymes promoted
by H
2
O
2
or menadione was also slightly different [54].
The study of oxidative response of S. cerevisiae, and of
other cell types, to stress can be focused under different
aspects: the oxidative defence systems of the cell, inducible
adaptive responses and their genetic regulation, signal
transduction, etc. One of the main conclusions that can be
derived from this report is that the steady state of the
nucleotide level is an important factor to be considered in
relation to the general response of S. cerevisiae to oxidative
stress, as illustrated by the different response to H
2
O
2
,
depending on whether the yeast uses glucose or glycerol as
carbon source. It seems to us evident that the intracellular
concentration of nucleotides is a key factor to be considered
in the understanding of the cellular response of yeast to the
oxidative aggression.
Acknowledgements
This investigation was supported by grants from Direccio
´
n General de
Investigacio
´
nCientı
´
ficayTe
´
cnica (PM98/0129, BMC2002-00866) and
Comunidad de Madrid (08.9/0004/98; 08/0021.1/2001). We thank
Anabel de Diego, Vero
´
nica Domingo and Georgia Afonso (from the
E
´
cole Nationale Chimie, Physique, Biologie of Paris) for their capable
technical assistance, and Dr Claudio F. Heredia for helpful discussions.
H. O. was supported by a Fellowship from Fundac¸ a
˜
oparaaCieˆ ncia e
a Tecnologı
´
a (SFRH/BD/1477/2000).
References
1. Sillero, A. & Gu
¨
nther Sillero, M.A. (2000) Synthesis of dinu-
cleoside polyphosphates catalyzed by firefly luciferase and several
ligases. Pharmacol. Therapeut. 87, 91–102.
2. Sillero, M.A.G., de Diego, A., Osorio, H. & Sillero, A. (2002)
Dinucleoside polyphosphates stimulate the primer independent
synthesis of poly (A) catalyzed by yeast poly (A) polymerase. Eur.
J. Biochem. 269, 5323–5329.
3. Torrecilla, A., Marques, A.F., Buscalioni, R.D., Oliveira, J.M.,
Teixeira, N.A., Atencia, E.A., Gu
¨
nther Sillero, M.A. & Sillero, A.
(2001) Metabolic fate of AMP, IMP, GMP and XMP in the
cytosol of rat brain: an experimental and theoretical analysis.
J. Neurochem. 76, 1291–1307.
4. Remy, P. (1992) Intracellular functions of Ap
n
N: eukaryotes. In
Ap
4
A and Other Dinucleoside Polyphosphates (McLennan, A.G.,
ed.), pp. 151–204. CRC Press, Boca Raton, USA.
5. Rubio-Texeira, M., Varnum, J.M., Bieganowski, P. & Brenner, C.
(2002) Control of dinucleoside polyphosphates by the FHIT-
homologous HNT2 gene, adenine biosynthesis and heat shock in
Saccharomyces cerevisiae. BMC Mol. Biol. 3, 7–17.
6. Davies, K.J.A. (1995) Oxidative stress: the paradox of aerobic life.
Biochem. Soc. Symp 61, 1–31.
7. Fridovich, I. (1978) The biology of oxygen radicals. Science 201,
875–880.
8. Nelson, D.L. & Cox, M. (2000) Lehninger Principles of Biochem-
istry. Worth Publishers, New York, USA.
9. Metzler, D. (2001) Biochemistry. Hartcourt/Academic Press,
New York, USA.
10. Dugan, L.L. & Choi, D.W. (1998) Hypoxic-ischemic brain injury
and oxidative stress. In Basic Neurochemistry. Molecular, Cellular
and Medical Aspects (Siegel, G.J., Agranoff, B.W., Albers, R.W.,
Fisher, S.K. & Uhler, M.D., eds), pp. 711–729. Lippincot-Raven,
Philadelphia, USA
11. Thor, H., Smith, M.T., Hartzell, P., Bellomo, G., Jewell, S.A. &
Orrenius, S. (1982) The metabolism of menadione (2-methyl-1,4-
naphthoquinone) by isolated hepatocytes. A study of the
implications of oxidative stress in intact cells. J. Biol. Chem. 257,
12419–12425.
12. Wolff, S.P. & Dean, R.T. (1986) Fragmentation of proteins by free
radicals and its effect on their susceptibility to enzymic hydrolysis.
Biochem. J. 234, 399–403.
13. Storz, G., Christman, M.F., Sies, H. & Ames, B.N. (1987) Spon-
taneous mutagenesis and oxidative damage to DNA in Salmonella
typhimurium. Proc. Natl Acad. Sci. USA 84, 8917–8921.
14. Halliwell, B. (1992) Reactive oxygen species and the central ner-
vous system. J. Neurochem. 59, 1609–1623.
15. Halliwell, B. & Gutteridge, J.M.C. (1999) Free Radicals in Biology
and Medicine. Oxford University Press, London, UK.
16. Jamieson, D.J. (1998) Oxidative stress responses of the yeast
Saccharomyces cerevisiae. Yeast 14, 1511–1527.
17. Costa, V. & Moradas-Ferreira, P. (2001) Oxidative stress and
signal transduction in Saccharomyces cerevisiae: insights
into ageing, apoptosis and diseases. Mol. Aspects Med. 22, 217–
246.
18. Moradas-Ferreira, P. & Costa, V. (2000) Adaptive response of
the yeast Saccharomyces cerevisiae to reactive oxygen species:
defences, damage and death. Redox Report 5, 277–285.
19. Moradas-Ferreira, P., Costa, V., Piper, P. & Mager, W. (1996)
The molecular defences against reactive oxygen species in yeast.
Mol. Microbiol. 19, 651–658.
20. Thomas, B.J. & Rothstein, R. (1989) Elevated recombination rates
in transcriptionally active DNA. Cell 56, 619–630.
21. Saez, M.J. & Lagunas, R. (1976) Determination of intermediary
metabolites in yeast. Critical examination of the effect of sampling
conditions and recommendations for obtaining true levels. Mol.
Cell Biochem. 13, 73–78.
22. Weibel, K.E., Mor, J.R. & Fiechter, A. (1974) Rapid sampling of
yeast cells and automated assays of adenylate, citrate, pyruvate
and glucose-6-phosphate pools. Anal. Biochem. 58, 208–216.
23. Sillero, M.A., Del Valle, M., Zaera, E., Michelena, P., Garcia,
A.G. & Sillero, A. (1994) Diadenosine 5¢,5¢-P
1
,P
4
-tetraphosphate
(Ap
4
A), ATP and catecholamine content in bovine adrenal
medulla, chromaffin granules and chromaffin cells. Biochimie 76,
404–409.
24. Conway, E.J. & Downey, M. (1950) An outer metabolic region of
the yeast cell. Biochem. J. 47, 347–355.
25. Atkinson, D.E. (1966) The energy charge of the adenylate pool as
a regulatory parameter. Interaction with feedback modifiers.
Biochemistry 7, 4030–4034.
26. Bradford, M.M. (1976) A rapid and sensitive method for the
quantitation of microgram quantities of protein utilizing the
principle of protein-dye binding. Anal. Biochem. 72, 248–254.
1588 H. Osorio et al.(Eur. J. Biochem. 270) Ó FEBS 2003
27. Kunst, A., Draeger, B. & Ziegenhorn, J. (1984) UV-methods with
hexokinase and glucose-6-phosphate dehydrogenase. In Methods
of Enzymatic Analysis (Bergmeyer, H.U., Bergmeyer, J. &
Grassl, M., eds), Vol. VI, pp. 163–172. Verlag Chemie GmbH,
Weinheim, Germany.
28. Beutler, H O. (1984) Ethanol. In Methods of Enzymatic Analysis
(Bergmeyer,H.U.Bergmeyer,J.&Grassl,M.,eds),Vol.VI,
pp. 598–606. Verlag Chemie GmbH, Weinheim, Germany.
29. Takei, S. (1967) Studies on metabolic pathway of NAD in yeast.
Part IV. Substrate specificity of yeast 5-nucleotidase. Agr. Biol.
Chem. 31, 1251–1255.
30. Itoh, R. (1994) Purification and some properties of an IMP-
specific 5¢-nucleotidase from yeast. Biochem. J. 298, 593–598.
31. Merkler, D.J., Wali, A.S., Taylor, J. & Schramm, V.L. (1989)
AMP deaminase from yeast. Role in AMP degradation, large
scale purification, and properties of the native and proteolyzed
enzyme. J. Biol. Chem. 264, 21422–21430.
32. Marmocchi, F., Lupidi, G., Venardi, G. & Riva, F. (1987) Adeno-
sine deaminase from Saccharomyces cerevisiae:purificationand
characterization. Biochem. Int. 14, 569–580.
33. Lupidi, G., Marmocchi, F., Falasca, M., Venardi, G., Cristalli, G.,
Grifantini, M., Whitehead, E. & Riva, F. (1992) Adenosine
deaminase from Saccharomyces cerevisiae: kinetics and interaction
with transition and ground state inhibitors. Biochim. Biophys. Acta
1122, 311–316.
34. Lecoq, K., Belloc, I., Desgranges, C., Konrad, M. & Daignan-
Fornier, B. (2001) YLR209c encodes Saccharomyces cerevisiae
purine nucleoside phosphorylase. J. Bacteriol. 183, 4910–4913.
35. Franco, R. & Canela, E.I. (1984) Computer simulation of purine
metabolism. Eur. J. Biochem. 144, 305–315.
36. Ito, Y., Tomasselli, A.G. & Noda, L.H. (1980) ATP: AMP
phosphotransferase from baker’s yeast. Purification and proper-
ties. Eur. J. Biochem. 105, 85–92.
37. Wolfram, S. (1996) The Mathematica Book, 3rd edn. Cambridge
University Press, Cambridge, UK.
38. Marques, A.F., Teixeira, N.A., Gambaretto, C., Sillero, A. &
Sillero, M.A. (1998) IMP-GMP 5¢-nucleotidase from rat brain:
activation by polyphosphates. J. Neurochem. 71, 1241–1250.
39. Gancedo, C. & Serrano, R. (1989) Energy-yielding metabolism. In
The Yeasts (Rose, A.H. & Harrison, J.S., eds.), Vol 3, pp. 205–259.
Academic Press, London.
40. Lagunas, R. Energetic irrelevance of aerobiosis for S. cerevisiae
growing on sugars. Mol. Cell. Biochem. 27, 139–146.
41. Fromm, H.J. (1975) Initial Rate Enzyme Kinetics. Springer Verlag,
Berlin, Germany.
42. Cabiscol,E.,Piulats,E.,Echave,P.,Herrero,E.&Ros,J.(2000)
Oxidative stress promotes specific protein damage in Saccharo-
myces cerevisiae. J. Biol. Chem. 275, 27393–27398.
43. Costa, V.M., Amorim, M.A., Quintanilha, A. & Moradas-
Ferreira, P. (2002) Hydrogen peroxide-induced carbonylation of
key metabolic enzymes in Saccharomyces cerevisiae: The involve-
ment of the oxidative stress response regulators Yap1 and Skn7.
Free Rad Bio. Med. 33, 1507–1515.
44. Ribeiro, J.M., Juzgado, D., Crespo, E. & Sillero, A. (1990)
Computer program for the reservoir model of metabolic cross-
roads. Comput. Biol. Med. 20, 35–46.
45. Blazquez, M.A., Lagunas, R., Gancedo, C. & Gancedo, J.M.
(1993) Trehalose-6-phosphate, a new regulator of yeast glycolysis
that inhibits hexokinase. FEBS Lett. 329, 51–54.
46. Thevelein, J.M. & Hohmann, S. (1995) Trehalose synthase:
guard to the gate of glycolysis in yeast? Trends Biochem. Sci. 20,
3–10.
47. Teusing, B., Walsh, M.C., van Dam, K. & Westerhoff, H.V.
(1998) The danger of metabolic pathways with turbo design.
Trends Biochem. Sci. 23, 162–169.
48. Teusink, B., Passarge, J., Reijenga, C.A., Esgalhado, E., van der
Weijden, C.C., Schepper, M., Walsh, M.C., Bakker, B.M., van
Dam, K., Westerhoff, H.V. & Snoep, L.L. (2000) Can yeast
glycolysis be understood in terms of in vitro kinetics of the con-
stituent enzymes? Testing biochemistry. Eur. J. Biochem. 267,
5313–5329.
49. Bonini, B.M., van Vaeck, C., Larsson, C., Gustafsson, L., Ma, P.,
Winderickx, J., van Dijck, P. & Thevelein, J.M. (2000) Expression
of Escherichia coli otsA in a Saccharomyces cerevisiae tps1 mutant
restores trehalose 6-phosphate levels and partly restores growth
and fermentation with glucose and control of glucose influx into
glycolysis. Biochem. J. 350, 261–263.
50.Godon,C.,Lagniel,G.,Lee,J.,Buhler,J.M.,Kieffer,S.,
Perrot, M., Boucherie, H., Toledano, M.B. & Labarre, J. (1998)
The H
2
O
2
stimulon in Saccharomyces cerevisiae. J. Biol. Chem.
273, 22480–22489.
51. Izawa,S.,Maeda,K.,Miki,T.,Mano,J.,Inoue,Y.&Kimura,A.
(1998) Importance of glucose-6-phosphate dehydrogenase in the
adaptive response to hydrogen peroxide in Saccharomyces cere-
visiae. Biochem. J. 330, 811–817.
52. Chaput, M., Brygier, J., Lion, Y. & Sels, A. (1983) Potentiation of
oxygen toxicity by menadione in Saccharomyces cerevisiae. Bio-
chimie 65, 501–512.
53. Flattery-O’Brien, J., Collinson, L.P. & Dawes, I.W. (1993) Sac-
charomyces cerevisiae has an inducible response to menadione
which differs from that to hydrogen peroxide. J. General Micro-
biol. 139, 501–507.
54. Lee, J., Dawes, I.W. & Roe, J.H. (1995) Adaptive response of
Schizosaccharomyces pombe to hydrogen peroxide and mena-
dione. Microbiology 141, 3127–3132.
Ó FEBS 2003 Effect of H
2
O
2
and menadione on S. cerevisiae (Eur. J. Biochem. 270) 1589