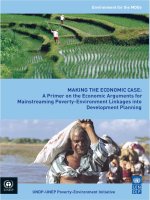
MAKING THE ECONOMIC CASE: A Primer on the Economic Arguments for Mainstreaming Poverty-Environment Linkages into Development Planning potx
Bạn đang xem bản rút gọn của tài liệu. Xem và tải ngay bản đầy đủ của tài liệu tại đây (22 MB, 66 trang )
MAKING THE ECONOMIC CASE:
A Primer on the Economic Arguments for
Mainstreaming Poverty-Environment Linkages into
Development Planning
Environment for the MDGs
UNDP-UNEP Poverty-Environment Initiative
MAKING THE ECONOMIC CASE:
A Primer on the Economic Arguments for
Mainstreaming Poverty-Environment Linkages into
Development Planning
UNDP-UNEP Poverty-Environment Initiative
MAKING THE ECONOMIC CASE:
A Primer on the Economic Arguments for
Mainstreaming Poverty-Environment Linkages into
Development Planning
UNDP-UNEP Poverty-Environment Initiative
Environment for the MDGs
The Poverty-Environment Initiative (PEI) of the United Nations Development Programme (UNDP) and the United
Nations Environment Programme (UNEP) is a global UN effort that supports country-led efforts to mainstream
poverty-environment linkages into national development planning. The PEI provides financial and technical assist-
ance to government partners to set up institutional and capacity-strengthening programmes and carry out activities
to address the particular poverty-environment context.
Making the Economic Case: A Primer on the Economic Arguments for Mainstreaming Poverty-Environment Linkages into
Development Planning is also available online at www.unpei.org.
Second edition. Published 2009.
© 2008 UNDP-UNEP
Produced by the UNDP-UNEP Poverty-Environment Facility
Directors of Publication: Philip Dobie and John Horberry
Writer: Lucy Emerton
Project Coordinators: Paul Steele and Sophie De Coninck
Editing and layout: Nita Congress
Cover photos: Rice fields, Indonesia © Mitchell Rogers–UNEP/Still Pictures; man carrying water and food across a
flooded area, Chibuto, Mozambique © Per-Anders Pettersson–UNEP/Still Pictures
Text photos: Fishing boat with catch, Kazakhstan, Aral Sea © Alexandre Gronsky –UNEP/Still Pictures; farmer picking
bananas, Saint Lucia © Abigail Hadeed –UNEP/Still Pictures; young children gathering fuelwood, Nepal © UNEP/Still
Pictures; boy drinking water from banana leaf, Nigeria © I.Uwanaka -UNEP/Still Pictures; Uros boatman,Peru, Lake
Titicaca © Gaethlich -UNEP/Still Pictures
All $ referred to in this report are US$, unless otherwise specified. The term “billion” in this report means a thou-
sand million.
This publication may be reproduced in whole or in part and in any form for educational or non-profit purposes
without special permission from the copyright holder provided acknowledgement of the source is made. The UNDP-
UNEP Poverty-Environment Facility would appreciate receiving a copy of any publication that uses this publication
as a source. No use of this publication may be made for resale or for any other commercial purpose whatsoever
without prior permission in writing from UNDP and UNEP.
The views expressed in this publication are those of the authors and do not necessarily reflect the views of UNDP
and UNEP. The designation of geographical entities in this report, and the presentation of the material herein, do
not imply the expression of any opinion whatsoever on the part of the publisher or the participating organizations
concerning the legal status of any country, territory or area, or of its authorities, or concerning the delimitation of its
frontiers or boundaries.
While reasonable efforts have been made to ensure that the contents of this publication are factually correct and
properly referenced, UNDP and UNEP do not accept responsibility for the accuracy or completeness of the contents
and shall not be liable for any loss or damage that may be occasioned directly or indirectly through the use of, or
reliance on, the contents of this publication, including its translation into languages other than English.
v
Table of Contents
Preface • v
1. Why Make the Economic Case? • 1
1.1 Primer Purpose • 2
1.2 Primer Organization • 2
2. Framing the Argument • 5
2.1 Treating the Environment Base as an Economic Asset • 5
2.2 Emphasizing the Economic Returns from Environmental Investment • 7
2.3 Understanding Human and Economic Well-Being Outcomes • 9
2.4 Addressing Climate Change and Its Economic Impacts • 9
3. Demonstrating the Benefits • 13
3.1 Achieving National Economic Growth and Upholding Sector Output • 14
3.2 Generating Public Revenues • 16
3.3 Reducing Expenditures • 19
3.4 Alleviating and Reducing Poverty • 20
3.5 Meeting the Millennium Development Goals • 23
4. Preparing the Evidence Base • 27
4.1 Key Points in Data Compilation • 27
4.2 Existing Economic, Environmental and Poverty Statistics • 30
4.3 Case Studies on Specific Linkages between the Environment, the Economy and
Poverty • 30
5. Making the Case • 33
5.1 Converting Data into Arguments • 33
5.2 Packaging the Data for Relevance to the Policy Agenda • 34
5.3 Communicating the Evidence • 35
5.4 Recognizing the Limitations of Economic Arguments • 36
Appendix. Data Requirements • 39
A.1 Treating the Environment Base as an Economic Asset • 39
A.2 Emphasizing the Economic Returns from Environmental Investment • 40
A.3 Understanding Human and Economic Well-Being Outcomes • 40
A.4 Achieving National Economic Growth and Upholding Sector Output • 40
A.5 Generating Public Revenues • 42
A.6 Reducing Expenditures • 43
vi
Table of Contents
A.7 Alleviating and Reducing Poverty • 45
A.8 Meeting the Millennium Development Goals • 46
Abbreviations and Acronyms • 47
Glossary • 49
Key Resources • 51
Literature • 51
Websites • 52
References • 53
Boxes
1.1: Recent Successes in Making Economic Arguments for the Environment • 1
1.2: Definition of Environmental Investment • 2
2.1: Managing Competing Demands and Finding Trade-Offs • 7
2.2: The Total Economic Value of Forests in Mexico • 8
2.3: The Costs to Human and Economic Well-Being of Insect Decline • 11
3.1: Quantifying the Value of Biodiversity to the Economy of the Lao People’s Democratic
Republic • 15
3.2: The Contribution of Environmental Resources to the Forest, Livestock and Wetlands
Sectors in Uganda • 16
3.3: The Contribution of Biodiversity to Government Revenues in the Seychelles • 17
3.4: Payment for Watershed Services to Generate Public Revenues for Environmental
Management in Ecuador • 18
3.5: Carbon Finance as a Mechanism for Raising Funds for Forest Conservation in Aceh,
Indonesia • 18
3.6: The Costs of Environmental Degradation to Pakistan’s Economy • 20
3.7: Household Poverty and Dependence on Biological Resources in the Lao People’s
Democratic Republic • 22
3.8: The Returns to Investing in Environmental Restoration for Reducing Poverty in
Cameroon • 23
3.9: Wetlands and Water Quality in Uganda • 25
3.10: Wetlands, Woodlands, Health, Nutrition and Rural Well-Being in Tanzania • 26
4.1: Obtaining and Interpreting Data • 27
Figures
1.1: Primer Content • 3
2.1: Environmental Economic Assets, Flows, and Outcomes • 5
2.2: Linking Environmental Investment to Human Well-Being and Pro-Poor Economic
Growth • 10
3.1: Linkages between Environmental Investment and Pro-Poor Economic Growth • 13
4.1: Summary of Steps and Data Needs in Making an Economic Case for Environmental
Investment • 28
5.1: Environmental Economic Assets, Flows and Outcomes • 33
Tables
2.1: Estimated Value of and Contribution to Country’s Total Wealth from Selected
Environmental Assets in Middle- and Low-Income Countries • 6
3.1: Key Linkages between the Environment and the MDGs • 24
4.1: Existing Sources of Data • 31
vii
Preface
T
he Poverty-Environment Initiative (PEI) is a joint programme of the United Nations
Development Programme (UNDP) and the United Nations Environment Programme
(UNEP) to provide financial and technical support to countries to build capacity for main-
streaming poverty-environment linkages into national development planning processes, such
as poverty reduction strategy papers and Millennium Development Goal (MDG) achievement
strategies. The PEI is supported by the governments of Belgium, Denmark, Ireland, Norway,
Spain, Sweden and the United Kingdom and by the European Commission. A major element
of PEI country work is to help practitioners in “making the case” for integrating environmental
management into national development plans, budgets and implementation programmes—
using the argument that better environmental management contributes to poverty reduction,
pro-poor growth and government finances. This primer is designed to help our country teams
and others engaged in the environmental mainstreaming challenge succeed in making the
case.
We are very grateful to Lucy Emerton of IUCN, who wrote this primer. Various members of the
UNDP-UNEP PEI team have contributed to its preparation, especially Paul Steele of the regional
PEI team for Asia and the Pacific, and thanks are due to them.
This primer draws on cooperation with and input from the Organisation for Economic
Co-operation and Development (OECD) Development Assistance Committee/Environment
Policy Committee Task Team on Governance and Capacity Development for Natural Resources
and Environmental Management, and complements their report, “Greening Development
Planning: A Review of Country Case Studies for Making the Economic Case for Improved
Management of Environment and Natural Resources” (Drakenberg et al. 2009). This report
provides an overview of and guidance for different approaches for making the economic case
for improved management of the environment and natural resources and is targeted at officials
within ministries of planning/finance and of the environment as well as OECD members.
The primer is meant to be a working document and to be tested at the country level, with a
view of getting feedback from country practitioners and improving its content. Any comments
or enquiries should be directed to:
UNDP-UNEP Poverty-Environment Facility
UN Gigiri Compound, United Nations Avenue
P.O. Box 30552-00100, Nairobi, Kenya
1. Why Make the Economic
Case?
D
espite the growing body of evidence that the environment is one of the core building
blocks for pro-poor economic growth, this message does not seem to have reached all
economic and development planners. In too many cases, environmental sustainability
goals are seen as being distinct from—and sometimes even as being in conflict with—devel-
opment goals. The claim on scarce public funds for addressing the urgent needs of economic
growth and poverty reduction means that the environment tends to remain a low priority in
public investment and policy formulation.
With few exceptions, environmental managers face a continuing problem in “selling” their sec-
tor to macroeconomic and sector decision-makers. Traditional conservation arguments alone
have rarely made a compelling case that environmental sustainability has an important bearing
on pro-poor growth. Economic evidence provides an extremely powerful (although usually
underused) tool for persuading economic and development decision-makers to acknowledge
the contribution of the environment to pro-poor growth, to buy into policies that encourage its
sustainable use and management, and to ensure that adequate resources are invested in envi-
ronmental goals (box 1.1).
Box 1.1: Recent Successes in Making Economic Arguments for the Environment
Although the use of economic arguments represents a new approach for most environmental managers, it is
becoming a widespread practice—and there are already indications of its success:
In
Algeria, presentation of data on the economic costs of environmental degradation to high-level politi-
cal decision-makers led to new investments of around $450 million being made in environmental protec-
tion (Saraff 2004).
In
Cambodia, the Fisheries Department undertook research showing that the sector contributed 10 per-
cent of gross domestic product—a very high figure. This evidence was instrumental in persuading the
Ministry of Finance to prioritize the fisheries sector in budget allocations and in dialogues with overseas
donors (ADB 2000).
In
Namibia, an economic analysis of the benefits of wildlife tourism to the wider economy resulted in the
government increasing allocations to protected areas by just under a third.
A new review and analysis of economic arguments for the improved management of the environment and
natural resources in national development planning presents a number of other examples of how the eco-
nomic case has been made (Drakenberg et al. 2009).
2
1. Why Make the Economic Case?
The objective here is to lead decision-makers from a view of environmental sustainability as
a luxury that governments cannot afford to a recognition of it as a necessity that they can-
not afford not to invest in. To effect this shift means using lines of reasoning and argument
based on the goals and outcomes that matter to macroeconomic and sector decision-makers,
expressed in terms with which they are familiar—such as effects on productivity, output, earn-
ings, employment, public revenues and expenditures, the incidence of poverty and the rate of
economic growth.
1.1 Primer Purpose
This primer provides guidance on presenting evidence about the economic, development and
poverty reduction benefits of the environment to public sector decision-makers in order to jus-
tify and promote environmental investment (box 1.2).
This primer is intended as a resource to help PEI country staff and their counterparts make the
case for mainstreaming the environment into national and sector development processes. As
such, it aims to ensure they have the evidence to back this up and identifies a series of entry
points to engage the attention of economic and development decision-makers by which to
enter into meaningful dialogue with them.
The primer is designed to help the user do the following:
Identify and collect appropriate data about the linkages between the environment and pro-
poor growth.
Present these data in a usable and policy-relevant form.
Communicate this information effectively during interactions with macroeconomic and sec-
tor decision-makers such as those in finance ministries, treasuries, sector line agencies and
local authorities.
1.2 Primer Organization
Figure 1.1 illustrates the primer’s organization and logic.
Box 1.2: Definition of Environmental Investment
As used here, environmental investment refers to the effort, attention and material support accorded to
environmental sustainability in public budgets, policies and planning. This includes ensuring the following:
That sufficient government funds are allocated to the agencies responsible for environmental manage-
ment and conservation
That environmental goals are prioritized and incorporated into (and not undermined by) macroeconomic
and sector policies and the instruments that are used to achieve them
That economic and development projects and programmes factor environmental costs and benefits into
their calculations and do not have a negative effect on the environment
3
1. Why Make the Economic Case?
The next two chapters of the primer explain why an economic case exists for environmental
mainstreaming. Key messages and major points are illustrated with real-world case studies and
examples.
Chapter 2, Framing the Argument
, covers the background thinking requisite to framing
the argument, focusing on general information on the linkages between the environment
and the economy.
Chapter 3, Demonstrating the Benefits,
describes the kinds of evidence that can be
provided to back up these arguments, using quantitative data to establish the case for envi-
ronmental investment.
The second part of the primer provides guidance on how to prepare and make the case for
environmental mainstreaming in the course of interactions with economic and development
decision-makers in a given country or sector.
Chapter 4, Preparing the Evidence Base
, summarizes the steps and data needs entailed
in preparing the evidence base and specifies where data might be accessed.
Chapter 5, Making the Case
, outlines the kinds of strategies that can be used to package
and communicate evidence in a form that is credible and convincing to economic decision-
makers.
Figure 1.1: Primer Content
Preparing the evidence
base
Collecting and compiling
relevant data
Data requirements
THE ECONOMIC CASE: EXAMPLES AND DATA REQUIREMENTS
HOW TO GO ABOUT MAKING THE CASE: PRESENTATION AND COMMUNICATION NEEDS
Where the data
can be accessed
Key points in
data compilation
Packaging the data
and making them
meaningful
Communicating
the
evidence to
decision-makers
More qualitative data More quantitative data
Treating the
environment base
as an economic
asset
Understanding
human & economic
well-being
outcomes
Emphasizing the
economic returns
from environmental
investment
Chapter 2
Achieving national
economic growth
and upholding
sector output
Generating public
revenues
Reducing
expenditures
Alleviating and
reducing poverty
Meeting the MDGs
Chapter 3
Demonstrating the benets
Presenting evidence to
show how environmental
investment contributes to
pro-poor economic growth
Chapter 4 Chapter 5
Making the case
Presenting convincing
evidence to
decision-makers
Appendix
Framing the argument
Articulating the linkages
between the environment
and the economy
4
1. Why Make the Economic Case?
The primer also includes the following:
An appendix on data requirements, summarizing the data needed for making the
economic case for environmental investment, presented in accordance with the aspects
specified in chapters 2 and 3
A
glossary of economic terms
A list of
key resources, both published and online, on the linkages between the envi-
ronment and pro-poor economic growth
5
2. Framing the Argument
A
s you make the case for environmental investment, you must understand and be able
to talk about the environment in economic terms, to see it and be able to explain it as
a productive sector that can be managed to generate pro-poor economic growth. This
chapter provides framework principles for establishing the linkages between the environment
and the economy:
Treating the environment base as an economic asset.
Environmental resources
should be seen as productive natural capital. Trade-offs exist between investing in sustaining
this natural capital and converting it to other uses.
Emphasizing the economic returns from environmental investment.
The sustain-
able management of environmental assets generates a flow of economically valuable goods
and services.
Understanding human and economic well-being outcomes.
Environmental goods
and services make a key contribution to the indicators that are used to measure progress
towards economic growth, development and poverty reduction.
This chapter looks at the environment base as an asset (a stock of natural capital) which yields
a flow of economically valuable goods and services (the return on environmental investment)
which in turn contributes towards positive economic and human well-being outcomes (the
measures and indicators used to judge progress towards economic growth and poverty reduc-
tion). These linkages are illustrated in figure 2.1.
Figure 2.1: Environmental Economic Assets, Flows and Outcomes
Flows of economically valuable
goods and services
Positive human and economic
well-being outcomes (indicators
of pro-poor economic growth)
Environment asset base
(stock of natural capital)
2.1 Treating the Environment Base as an Economic Asset
The environment should be considered—in statistical, policy and budgetary terms—on an
equal footing with other stocks of productive capital and sources of wealth in the economy.
The Importance of Natural Capital
It must be clearly communicated to decision-makers that the environment asset base is a valu-
able stock of natural capital. This asset base is comprised of productive natural ecosystems
6
2. Framing the Argument
and resources which generate economically important goods (including timber, fisheries, min-
erals, non-timber forest products, water, firewood, fodder and medicines) and services (includ-
ing maintenance of water flow and quality, climate regulation, support to agricultural and
fisheries productivity, and protection against disease and disasters).
The concept of natural capital is an extension of the notion of economic capital (such as financial,
human, manufactured and institutional capital) to environmental goods and services. It refers to
a stock of natural resources that produce a flow of goods as well as services. In addition to the
livelihoods and income provided by natural resources, natural capital can also be measured in
end products, such as a healthy and well-fed labour force. The concept of natural capital should
be included in the definition of economic production since the effort or resources required to
maintain natural capital contributes directly to a country’s gross domestic product (GDP).
The Contribution of Natural Capital to the World’s Wealth
Natural capital is of particular importance to non-industrialized economies. A recent study by
the World Bank estimates that natural capital accounts for 26 percent of total wealth in low-
income countries, as compared to 13 percent in middle-income countries and 2 percent in
high-income OECD countries (World Bank 2006b).
Table 2.1 shows the estimated per capita value of natural capital and its contribution to
total wealth in selected middle- and low-income countries, as estimated by the World Bank.
Although based on a limited range of environmental assets (subsoil assets, timber, non-timber
Table 2.1: Estimated Value and Contribution to Country Total Wealth of Selected
Environmental Assets in Middle- and Low-Income Countries
Upper middle income Lower middle income Low income
Country
Asset
value
($/capita)
Contri-
bution
(% ) Country
Asset
value
($/capita)
Contri-
bution
(% ) Country
Asset
value
($/capita)
Contri-
bution
(% )
Argentina 10,312 7 Albania 3,892 22 Bangladesh 961 16
Belize 6,950 13 Algeria 13,200 71 Benin 1,33 17
Botswana 3,183 8 Bhutan 4,945 64 Burkina Faso 1,219 24
Brazil 6,752 8 Bolivia 4,783 26 Burundi 1,210 42
Bulgaria 3,448 14 Cameroon 4,73 44 Chile 10,944 14
Costa Rica 8,527 14 Cape Verde 711 2 Comoros 967 12
Dominica 5,973 10 Colombia 6,547 15 Congo, Rep 9,330 265
Fiji 2,208 5
Dominican Rep 3,176 10 Côte d’Ivoire 3,121 22
Gabon 28,586 66 Ecuador 13,117 39 Ethiopia 796 41
Grenada 640 1
Egypt, Arab Rep 3,249 15 Gambia 514 8
Jamaica 2,627 5 El Salvador 912 3 Ghana 1,336 13
Latvia 5,485 12 Georgia 1,799 14 Guinea-Bissau 1,858 47
Malaysia 9,103 19 Guyana 10,301 65 Haiti 793 10
Mauritius 642 1 Honduras 3,005 26 Kenya 1,368 21
Mexico 8,493 14 India 1,928 28 Madagascar 1,681 33
Panama 5,051 9 Indonesia 3,472 25 Malawi 785 15
Russian Fed 17,217 44
Iran, Islamic Rep 14,105 59 Mali 2,157 41
Source: World Bank 2006b.
7
2. Framing the Argument
forest resources, cropland, pastureland and protected areas), these figures are a useful indica-
tor of the economic importance of natural capital to countries’ wealth. (For information on the
methodology used to obtain these figures, see World Bank 2006b.)
An inherent tension exists between economic development and sustainable environmental
management. This tension fundamentally involves making choices about how, where and why
to produce, consume and invest, as explained in box 2.1.
2.2 Emphasizing the Economic Returns from Environmental
Investment
Natural capital generates a flow of benefits. Just as the environment base should be seen as an
economic asset, so there are tangible economic returns from investing in it. Conversely, run-
ning down this stock of natural capital imposes costs and losses on most sectors of the econ-
omy and undermines pro-poor economic growth. If managed sustainably, the environment
base will continue to yield economically productive and beneficial flows of goods and services.
If used and managed unsustainably, these economic benefits will progressively be lost.
The return from environmental investment is the flow of economically important goods and
services that the environment yields. These extend beyond the commercial raw materials and
physical products that have conventionally dominated official statistics on the environment sec-
tor. Many decision-makers would see the value of a forest, for example, as comprising only its
large-scale timber potential; the value of wetlands as solely due to commercial fisheries produc-
tion; or the value of grasslands as limited to livestock production possibilities. In many cases,
considerations of sustainability would not be factored into decisions at all—for example, the
revenues from gross extraction or clearfelling would be included but not the economic value of
ecosystem services and sustainable harvesting.
Environmental investment yields a wide range of other economic benefits, including flows of
products that are used at the subsistence or small-scale level (such as firewood or wild foods)
as well as services that underpin other productive activities and provide vital life support (such
as the human health benefits of clean water and air, protection against disasters, maintenance
of water flow, and protection against the impacts of climate change and climate variability).
The value of these goods and services remains largely hidden in most official development
statistics.
Box 2.1: Managing Competing Demands and Finding Trade-Offs
This primer is particularly concerned with ensuring that the returns to environmental investment are factored
into decision-making. A central issue in making the economic case for environmental investment is estab-
lishing that there are trade-offs between managing the environment asset base sustainably, and irreversibly
converting it to other uses or forms of capital. A recurring concern among decision-makers is to manage
competing demands on natural resources and the environment, and to ensure that the relative returns to
these different choices are fully considered.
Economic measures and indicators have a strong influence on how these trade-offs are conceptualized and
decisions are made; they are an important factor when choices are made about how to use and allocate
funds, resources and lands.
8
2. Framing the Argument
As the example in box 2.2 illustrates for the case of Mexico, environmental undervaluation
can lead to natural resource management decisions that compromise the supply of important
economic benefits and the support of livelihoods.
Box 2.2: The Total Economic Value of Forests in Mexico
Failure to account for the numerous functions and economic uses of forests have led to patterns of global
forest use with many detrimental environmental consequences. For example, the extensive and commercially
valuable forest resources in Mexico are ranked as contributing only between 1.8 and 2.0 percent of GDP (or
$6.75 to $7.5 billion) in the last decade. These official statistics are based primarily on commercial timber
production and exclude many of the economic benefits associated with the sector.
Calculating the total economic value of forests for non-marketed, non-extractive uses and benefits shows an
annual lower bound value to be on the order of 1 percent of GDP, or $4 billion a year. This aggregate value
includes future potential uses of the genetic
resources and existence values; the largest
proportion of economic value comes from
hydrological and carbon cycling (see table).
This example demonstrates that a strong case
can be made for forest conservation in Mexico
based on local, regional and global values
of forests, and that these values should be
incorporated into decisions on the future management of this significant resource. There would be consider-
able returns from capturing a greater range and level of benefits than is currently the case. Approximately
one-quarter of Mexico’s population lives in forest areas, often subsisting in extreme poverty: Several states
with more than 50 percent forest cover have 40 percent of their population below the poverty line. Enhanc-
ing the value of non-timber forest products and increasing the capture of their value could bring significant
benefits to poorer sections of rural communities, both in terms of providing subsistence goods, such as build-
ing materials, where substitutes might be expensive and produced outside the area, and in terms of direct
income generation.
Source: Adger et al. 1994.
Forest goods and services Value (million $ per year)
Tourism 32.1
Carbon sequestration 3,788.3
Watershed protection 2.3
Option value 331.7
Existence value 60.2
Total 4,214.6
There are three main reasons to explain and emphasize the full range of both visible and hid-
den benefits as the economic return on environmental investment:
Paints full picture.
The full benefit range presents a more complete picture of the eco-
nomic importance of the environment and of the high and wide-ranging costs associated
with environmental degradation and loss. Decision-makers should be aware of and appreci-
ate the full—and diverse—values associated with environmental investment.
Highlights long-term benefits.
The focus on commercial values only has, in many coun-
tries, led to a situation where development and economic policy have placed undue empha-
sis on maximizing the quantity of products extracted from the environment, even when
these uses are not sustainable and may not even be optimal in economic terms. Decision-
makers should understand that extractive commercial uses are only one option among
many when seeking to maximize the economic returns from environmental investment—
and that these often benefit the richer groups in society that are able to access and gain
from these commercial benefits. If environmental assets are not managed for the long term
9
2. Framing the Argument
and are exploited only for short-term gain, they may never allow for economic development
on the scale or of the type needed to reduce poverty or to benefit the poor.
Reveals hidden goods and services.
Hidden environmental goods and services are
especially important for the poorest and most vulnerable sectors of the population. In many
cases, alternative sources of essential goods and services are simply not accessible or afford-
able (UNDP 2005), and they suffer disproportionately in health, economic and general well-
being terms from environmental degradation and loss. Decision-makers must be made to
see that there is a direct link between the return on environmental investment and the wel-
fare and survival of the poorest.
2.3 Understanding Human and Economic Well-Being Outcomes
The third—and ultimate—point to make when framing the argument about the linkages
between the environment and the economy is that the returns from environmental investment
yield positive outcomes for human and economic well-being, which are manifested as gains
throughout the economy. The bottom line for decision-makers is to understand how changes in
the environment base, and the flows of goods and services it yields, affect pro-poor economic
growth.
The Millennium Ecosystem Assessment—a scientific appraisal conducted by more than 1,300
experts worldwide from 2001 to 2005 of the condition of and trends in the world’s ecosys-
tems and the services they provide—is a particularly useful framework for tracing the linkages
among environmental assets and flows, the constituents of human well-being and the indica-
tors used to measure progress towards macroeconomic and sector policy goals involving eco-
nomic growth, development and poverty reduction (figure 2.2).
While the broader human and economic well-being outcomes of investing in key assets such as
forests, cropland and fisheries for food, income, water and trade are relatively well recognized,
as are the human health benefits of clean water and air, decision-makers must be shown that
environmental investment maintains many less obvious—but highly valuable—services, which
can have an important multiplier effect across the economy. By way of example, box 2.3 illus-
trates the ways in which insect populations provide economically important regulating serv-
ices, which in turn have an impact on global and local trade, food production and prices, and
farmer income. It is these pro-poor economic growth outcomes and indicators that provide the
primary evidence base, detailed in chapter 4, for convincing decision-makers about the gains
entailed in investing in the environment.
2.4 Addressing Climate Change and Its Economic Impacts
Understanding climate change and its economic impacts is critical in framing the argument
and making the economic case for environmental investments.
So far, climate change has been the exclusive purview of environment ministries and meteoro-
logical agencies. But climate change will have wide-ranging, dramatic impacts, including the
following:
Decreased agricultural productivity and increased food insecurity
Depletion of natural resource stocks including water
Increased frequency of diseases, leading to reduced productivity and increased health costs
10
2. Framing the Argument
Figure 2.2: Linking Environmental Investment to Human Well-Being and Pro-Poor
Economic Growth
Source: Adapted from MA 2005.
• GDP
• Balance of payments
• Foreign exchange earnings
• Access to and availability of
clean water, sanitation, food,
shelter, energy, health care, etc.
Indicators of Pro-Poor Economic Growth
• Production
• Consumption
• Income
• Revenue generation
• Cost savings
• Investment and trade ows
ENVIRONMENT ASSET BASE
ECONOMIC FLOWS
Constituents of Human Well-Being
Freedom of choice and action:
Opportunity to be
able to achieve what
an individual values being and doing
• Adequate
livelihoods
• Sucient
nutritious food
• Shelter
• Access to goods
Basic material for
good life
• Social cohesion
• Mutual respect
• Ability to help
others
Good social
relations
• Strength
• Feeling well
• Access to clean
air and water
Health
• Personal safety
• Secure resource
assets
• Security from
disasters
Security
Life on Earth – Biodiversity
Ecosystem Services
• Nutrient cycling
• Soil formation
• Primary production
• …
Supporting
• Food
• Freshwater
• Wood and bre
• Fuel
• …
Provisioning
• Climate regulating
• Flood regulating
• Disease prevention
• Water purication
• …
Regulating
• Aesthetic
• Spiritual
• Educational
• Recreational
• …
Cultural
11
2. Framing the Argument
Reduced efficiency and cost-effectiveness of existing and planned infrastructure
More frequent climate-related disasters with their concomitant macroeconomic impacts
Given this scope, and the growing awareness of the significance of climate change, ministries
of finance and ministries of planning need a better understanding of the issues and how cli-
mate change adaptation can be addressed in national and subnational planning processes and
through fiscal (budgetary) and investment decision-making. Several countries have started or
are interested in economic analysis of climate change, and the aims, methodologies and results
of such analysis should be reviewed.
In terms of mitigating climate change, numerous countries are taking advantage of the com-
petitive opportunities of new markets for low-carbon products and services, such as renew-
able and energy-efficient technologies. Leadership of the low-carbon revolution depends on a
dynamic private sector, as well as the enabling institutions and policies provided by govern-
ment, including finance and planning ministries.
A further dimension of the global interest in climate change is the growing flow of external
public and private funds on its behalf. For mitigation, these funds tend to be advanced by the
private sector through carbon trading; for adaptation, there is a growing availability of donor
financing. These new sources of private and public financing outside traditional budget and fis-
cal systems present new challenges to and opportunities for ministries of finance and planning.
Coherent systems are needed to ensure sound public financial management while not under-
mining the desired objectives of these finances (UNDP 2007; UNFCCC 2008).
Box 2.3: The Costs to Human and Economic Well-Being of Insect Decline
Ecologists and entomologists have become increasingly concerned about the disappearance of certain
insects from areas where they were once widespread. Until recently, however, such losses in biodiversity
were not treated as much of a disaster by economic planners and decision-makers. It is only after the serious
economic consequences of these environmental changes have become apparent that politicians and policy-
makers have moved to mobilize funding to tackle the problems associated with insect decline.
In just one year, for example, disease wiped out 2.5 million beehives across the United States, and fears were
raised about similar outbreaks in Europe. About three-quarters of all flowering plants rely on birds, bees and
other pollinators to help them reproduce. Bee pollination is thought to be responsible for about $15 billion
annually in crop value in the United States. Already the yield of certain commercially valuable crops such as
apples, almonds, cherries, blueberries, cucumbers, pumpkins, cranberries and alfalfa have fallen; the annual
costs to farmers of pollination fees have almost doubled; and food prices have started to rise.
On a global scale, many fruits, vegetables and stimulant crops (e.g. tobacco, coffee and tea) are highly or
totally dependent on insects for pollination. A recent study measured the economic impact of pollinators on
agricultural output, considering 100 crops used directly for human food. The researchers found that the total
economic value of pollination worldwide amounted to €153 billion, representing 9.4 percent of the value of
world agricultural production used for human food. Vegetables and fruits were the leading crop categories in
value of insect pollination with €50.9 and €50.6 billion, respectively, followed by edible oil crops, stimulants,
nuts and spices.
Sources: Gallai et al. 2007; Sumner and Boriss 2006.
3. Demonstrating the Benefits
H
aving framed the argument, the next step is to provide concrete evidence about the
contribution of environmental investment to pro-poor economic growth, using the
terminology and indicators decision-makers themselves use to prioritize policies and
investments, and to track progress towards economic and development goals.
This chapter describes the outcomes of environmental investment in relation to five aspects of
pro-poor economic growth that are likely to have the greatest resonance with decision-makers
in finance ministries, treasuries, sector line agencies and local authorities:
Achieving national economic growth and upholding sector output
Generating public revenues
Reducing expenditures
Alleviating and reducing poverty
Meeting the Millennium Development Goals
This chapter presents data, figures and economic arguments that provide concrete, practical
and policy-relevant evidence that will help convince decision-makers of the gains to be realized
in investing in the environment in terms of pro-poor economic growth outcomes. These argu-
ments are illustrated in figure 3.1.
Figure 3.1: Linkages between Environmental Investment and Pro-Poor Economic Growth
PRO�POOR
ECONOMIC GROWTH
Achieving national
and sector
economic growth
Generating
public revenues
Reducing
expenditures
Alleviating and
reducing poverty
Meeting the
MDGs
ENVIRONMENTAL
INVESTMENT
14
3. Demonstrating the Benefits
3.1 Achieving National Economic Growth and Upholding Sector
Output
Progress towards a stable, dynamic and well-functioning economy remains at the core of most
macroeconomic policy goals. Various indicators are used to measure the performance and
growth of the national economy and of its component sectors, including year-to-year changes
in GDP, employment rates, trade balances, foreign exchange earnings, investment and the pub-
lic budget. Environmental goods and services typically make a substantial contribution to these
indicators, and can continue to contribute to national economic growth if managed and used
sustainably, as in the following examples:
The fisheries sector contributes more than 10 percent of GDP in
Cambodia, Kiribati and
the Maldives, and more than 5 percent in Gambia, Mauritania and Sao Tomé. Fish is the
most valuable agricultural commodity that is traded internationally, with net export revenues
earned by developing countries reaching $17.7 billion in 2001—more than coffee, cocoa,
sugar and tea combined (OECD 2008).
Forestry accounts for more than 10 percent of GDP in many of the world’s poorest countries.
In all developing countries taken together, the forestry sector provides formal employment
for 10 million people and informal employment for another 30 to 50 million people. In
Cameroon, the Central African Republic and Liberia, forests make up from just under
30 percent to more than 40 percent of national exports (OECD 2008).
In the
Maldives, marine and coastal tourism directly accounts for 20 percent of GDP, and
its wider effects help produce 74 percent of national income. This tourism contributes more
than 60 percent of foreign exchange receipts, and over 90 percent of government tax rev-
enue comes from import duties and tourism-related taxes. Further, almost 40 percent of the
country’s workforce is employed in the industry (Emerton 2006).
In the
Seychelles, environmental goods and services contribute up to a quarter of all
employment opportunities, one-third of government revenues and two-thirds of foreign
exchange earnings (Emerton 1997).
Figures like these can make for compelling evidence in demonstrating to decision-makers the
importance of the environment to national economic growth and sector output.
With a few exceptions, the official figures used by governments and donors to track national
income and economic performance massively underestimate the contribution of the environ-
ment. Even records of commercial, formal sector activities such as those mentioned above
tend to be incomplete and to exclude a substantial proportion of economic activity, income and
employment. For example, official data show that forests contribute between 1 and 2 percent
of GDP in Indonesia, whereas the World Bank estimates that the potential value of forests to
that economy is closer to 15 to 20 percent of GDP (OECD 2008). Environmental resources typi-
cally play a far more important economic role than official statistics suggest (box 3.1).
Subsistence-level benefits are one category of economic values that are often excluded
from estimates of sector output and income, even though they can have a significant impact in
terms of pro-poor growth. Taking the example of the forest sector, non-timber forest products
often generate considerable economic output at the local level, although they are rarely incor-
porated into formal estimates of output, as these examples illustrate:
15
3. Demonstrating the Benefits
In the Lao People’s Democratic Republic, the value added to livelihoods from non-tim-
ber forest product collection in 2000 was calculated to be more than $185 million, as com-
pared to gross revenues from commercial round log harvesting of approximately $50 million
(Emerton 2005).
Subsistence-level forest use in 2001 was worth more than 20 times as much as formal sector
commercial forestry earnings in Kenya (Ecoforum 2001).
Across many parts of the developing world, fuelwood is the primary source of household
energy, although this is rarely reflected fully in energy sector estimates. In Zambia, 70 per-
cent of national energy requirements are met by fuelwood obtained from forests and trees
on farm; in Mozambique, 80 percent; in Malawi, about 90 percent; and in Tanzania,
97 percent (Ecoforum 2001).
A second category of economic benefits not usually discernible in national and sector statistics
is the contribution made by the environmental services provided by specific ecosystems,
such as water flow and quality, biological productivity, soil condition and land productivity,
and landscape qualities. These services are often critical to sector output and income, as these
examples show:
Box 3.1: Quantifying the Value of Biodiversity to the Economy of the Lao People’s
Democratic Republic
To ensure that environmental policy was informed by economic thinking, and that this could be justified to
economic planners and decision-makers, an economic assessment was carried out as part of the Lao People’s
Democratic Republic’s National Biodiversity Strategy and Action Plan. The results underlined the importance
of biodiversity to the country’s key development goals as set out in its Five-Year Socio-Economic Develop-
ment Plan and National Development Vision.
Most of the value of biodiversity is captured in non-marketed services and household-level benefits (e.g.
timber for domestic uses, home consumption of forest products) that never appear in formal markets and
therefore remain largely invisible to economic decision-makers and planners.
The economic assessment corrected for these omissions, demonstrating that biodiversity contributes, directly
or indirectly, more than 90 percent of employment, almost three-quarters of per capita GDP, two-thirds of
donor assistance, just under 60 percent of exports and foreign exchange earnings, nearly half of foreign direct
investment and a third of government revenues.
Contribution of biological resources to key national economic indicators (%)
Source: Emerton et al. 2002.
GDP EmploymentForeign
exchange
Government
revenues
Foreign direct
investment
Donor
assistance
0
20
40
60
80
100
66%
46%
31%
59%
92%
71%
16
3. Demonstrating the Benefits
On the Baluchistan coast of Pakistan, mangroves are responsible for providing the nursery
and breeding habitat on which it is estimated that up to half of off-shore commercial fish
yields depend (Baig and Iftikhar 2007).
Healthy coral reefs in
Southeast Asia have been found to increase fish productivity by
more than 10 tonnes per square kilometre per year (Burke, Selig, and Spalding 2002; McAl-
lister 1988).
The present value of sustainable upland forest management to the Paute hydroelectric
scheme in the Andean Highlands of Ecuador—as reflected in increased power revenues,
lower dredging costs and an extension of the dam’s lifespan—were calculated to range
between $15 million and $40 million, demonstrating that upper watershed management is
in the direct economic interest of the power sector (Southgate and Macke 1989).
Box 3.2 shows how the inclusion of environmental resources substantially increases estimates
of the value of the environment.
Box 3.2: The Contribution of Environmental Resources to the Forest, Livestock and
Wetlands Sectors in Uganda
Together, agriculture, forestry and fisheries contribute around a third of Uganda’s GDP, or an estimated $2 bil-
lion according to official 1998 statistics. While natural resources obviously make a large contribution to the
output of these sectors—in terms of timber and other wood products, livestock production and fisheries,
etc.—other environmental services and resources are also involved.
The economic benefits of soil and water conservation as inputs to livestock production (e.g. through erosion
control, pasture and forage) and for water purification services are large, although generally unrecorded.
When these additional sources of sector output are included, environmental resources contribute half of
recorded livestock production income, and gross income figures are increased by more than a quarter in the
forestry and wetland sectors.
Sector Gross income (million $/year)
Forestry Timber, polewood and fuelwood production 132.97
Soil and water conservation services 113.62
Livestock Livestock production 281.08
Inputs from natural grasslands, bushlands and wetlands 139.34
Fisheries and
wetlands
Fisheries production 313.13
Water purification services 4.08
Source: Emerton and Muramira 1999.
3.2 Generating Public Revenues
Maintaining healthy public budgets is a major concern for most economic and development
decision-makers, as they are usually under heavy pressure to generate revenues. The proc-
esses of decentralization and devolution of financial management that are ongoing in many
countries mean that government agencies are increasingly responsible for generating their own
revenues and funding their own expenditures.
Showing the economic importance of sustainable environmental management in terms of
public financial management underlines its importance to the government as a key earning
17
3. Demonstrating the Benefits
sector—both for ministries of environment as well as for central treasuries and other line agen-
cies. Environmental resources often provide significant earnings for governments, as these
examples and box 3.3 illustrate:
Between 1993 and 1999, fishery access agreements with foreign fleets provided 30 percent
of government revenues in Guinea-Bissau, 15 percent in Mauritania, and 13 percent in
Sao Tomé (OECD 2008).
Minerals provide significant revenues to countries. More than half of
Botswana’s fiscal rev-
enues are derived from mining; gold, copper, zinc and other minerals account for 43 percent
of government revenues in Peru; and copper contributes 22 percent of fiscal earnings in
Chile (OECD 2008).
Box 3.3: The Contribution of Biodiversity to Government Revenues in the Seychelles
Work carried out in the Seychelles identified the full range of income that accrued to the government from
the country’s biodiversity. This included both direct taxes and levies on resource extraction and sales as well
as the contribution of the environment to the earnings of other sectors—such as through hotel levies, airport
taxes and port expenditures. In total, biodiversity contributes around a third of all government revenues in
the Seychelles.
Source of revenues Annual receipts (thousand rupees)
Bednight levies on nature tourist hotels 11,500
Airport taxes on nature tourists 9,700
Protected area revenues 1,263
Giant tortoise export revenues 90
Fish licences 36,200
Forest produce sales 973
Tree felling permit revenues 32
Port expenditures from nature tourism and natural resource exports 153,834
Total 213,592
Percentage of all public revenues 33
Source: Emerton 1997.
Such lines of reasoning can also be used to highlight cases where public income can be
increased through improved environmental investment. This is a key point in making the eco-
nomic case: In many instances, decision-makers may appreciate the value of sustainable envi-
ronmental management, including unmarketed or less tangible benefits, but need to ensure
that material gains and income streams can be demonstrated. They must see how the theoreti-
cal economic significance of environmental investment can be made to pay off—how revenues
and income can be generated from the environment in a tangible and sustainable form.
Improved revenue generation, and the capture of environmental benefits, can be achieved
through environmental fiscal reforms, rationalizing and improving existing environmental
charges, fees and taxes or by introducing new payment systems for environmental goods and
services. Both are becoming more widespread as mechanisms for helping governments raise
revenues while furthering poverty reduction and environmental goals. Payments for envi-
ronmental services (box 3.4) generate cash or in-kind payments from the beneficiaries or
users of such services for the government institutions, private landholders and communities