Báo cáo Y học: Elucidation of the role of fructose 2,6-bisphosphate in the regulation of glucose fluxes in mice usingin vivo 13 C NMR measurements of hepatic carbohydrate metabolism docx
Bạn đang xem bản rút gọn của tài liệu. Xem và tải ngay bản đầy đủ của tài liệu tại đây (516.76 KB, 9 trang )
Elucidation of the role of fructose 2,6-bisphosphate in the regulation
of glucose fluxes in mice using
in vivo
13
C NMR measurements
of hepatic carbohydrate metabolism
In-Young Choi
1
, Chaodong Wu
2
, David A. Okar
2
, Alex J. Lange
2
and Rolf Gruetter
1,3
6
Departments of Radiology
1
, Biochemistry, Molecular Biology and Biophysics
2
, Neuroscience
3
, University of Minnesota Medical
School, Minneapolis, MN, USA
Fructose 2,6-bisphosphate (Fru-2,6-P
2
) plays an important
role in the regulation of major carbohydrate fluxes as both
allosteric activator and inhibitor of target enzymes. To
examine the role of Fru-2,6-P
2
in the regulation of hepatic
carbohydrate metabolism in vivo,Fru-2,6-P
2
levels were
elevated in ADM mice with adenovirus-mediated overex-
pression of a double mutant bifunctional enzyme, 6-phos-
phofructo-2-kinase/fructose-2,6-bisphosphatase (n ¼ 6), in
comparison to normal control mice (control, n ¼ 6). The
rates of hepatic glycogen synthesis in the ADM and control
mouse liver in vivo were measured using new advances in
13
C
NMR including 3D localization in conjunction with
[1-
13
C]glucose infusion. In addition to glycogen C1, the C6
and C2–C5 signals were measured simultaneously for the
first time in vivo, which provide the basis for the estimation of
direct and indirect synthesis of glycogen in the liver. The rate
of label incorporation into glycogen C1 was not different
between the control and ADM group, whereas the rate of
label incorporation into glycogen C6 signals was in the
ADM group 5.6 ± 0.5 lmolÆg
)1
Æh
)1
, which was higher than
that of the control group of 3.7 ± 0.5 lmolÆg
)1
Æh
)1
(P < 0.02). The rates of net glycogen synthesis, determined
by the glycogen C2–C5 signal changes, were twofold higher
in the ADM group (P ¼ 0.04). The results provide direct
in vivo evidence that the effects of elevated Fru-2,6-P
2
levels
in the liver include increased glycogen storage through
indirect synthesis of glycogen. These observations provide a
key to understanding the mechanisms by which elevated
hepatic Fru-2,6-P
2
levels promote reduced hepatic glucose
production and lower blood glucose in diabetes mellitus.
Keywords:
1
NMR; in vivo; fructose-2, 6-bisphosphate; gly-
cogen; mouse liver.
The regulation of carbohydrate metabolism in the liver is
important for blood glucose homeostasis by controlling
hepatic glucose production. This involves an intricate
regulation of metabolic pathways, such as glycolysis,
gluconeogenesis, glycogenesis and glycogenolysis in the
liver [1,2]. The balance of these pathways is severely altered
in patients with type II diabetes mellitus contributing to
chronically elevated plasma glucose concentrations. There-
fore, an understanding of the regulation of these fluxes can
provide important insights into the mechanisms and poten-
tial treatment of diabetes.
The rates of glycolysis and gluconeogenesis are important
in the rate of hepatic glucose production. Fructose-2,6-
bisphosphate (Fru-2,6-P
2
) plays an important role through
its reciprocal allosteric effects on two critical enzymes,
6-phosphofructo-1-kinase and fructose-1,6-bisphosphatase
(reviewedin[3]).Fru-2,6-P
2
activates phosphofructo-1-
kinase to stimulate glycolysis and inhibits fructose-1,6-
bisphosphatase to reduce gluconeogenesis. Synthesis as well
as degradation of Fru-2,6-P
2
are controlled by the bifunc-
tional enzyme 6-phosphofructo-2-kinase/fructose-2,6-bis-
phosphatase [4,5], providing a switch between glycolytic
and gluconeogenic pathways in the liver [3,6,7]. For
example, when the insulin/glucagon ratio is high, the
enzyme is dephosphorylated at Ser32, its 6-phosphofructo-
2-kinase activity is enhanced and the bisphosphatase activity
is inhibited, resulting in a net synthesis of Fru-2,6-P
2
from
fructose 6-phosphate and ATP [5]. On the other hand, when
the insulin/glucagon ratio is low, 6-phosphofructo-2-kinase/
fructose-2,6-bisphosphatase is phosphorylated by protein
kinase A, which enhances the bisphosphatase activity and
inhibits the kinase activity of the bifunctional enzyme, and
Fru-2,6-P
2
is converted back to fructose 6-phosphate,
thereby producing inorganic phosphate (P
i
)[3].
Recently, we have shown that increasing Fru-2,6-P
2
content via adenovirus mediated 6-phosphofructo-2-kinase/
fructose-2,6-bisphosphatase overexpression reduces hepatic
glucose production and lowers blood glucose in both
normal and diabetic mice [8,9]. The double mutant
bifunctional enzyme used in that study has a mutation of
Ser32fiAla, which prevents cAMP-dependent phosphory-
lation [10], and a mutation of His258fiAla, which
diminishes bisphosphatase activity [11]. While the study
confirmed that increased hepatic Fru-2,6-P
2
content can
reduce blood glucose, it was not clear that the allosteric
effects of this compound on 6-phosphofructo-1-kinase and
fructose-1,6-bisphosphatase could fully account for the
metabolic effects, especially with regard to the glycogen
Correspondence to R. Gruetter, Center for Magnetic Resonance
Research, 2021 6th Street SE, Minneapolis, MN 55455, USA.
Fax: + 1 612 626 2004, Tel.: + 1 612 625-6582,
E-mail:
Abbreviations: Fru-2,6-P
2
, fructose 2,6-bisphosphate; TR, repetition
time; TE, echo time.
(Received 14 March 2002, revised 10 July 2002,
accepted 18 July 2002)
Eur. J. Biochem. 269, 4418–4426 (2002) Ó FEBS 2002 doi:10.1046/j.1432-1033.2002.03125.x
stores. In fact, it was observed that the increased hepatic
Fru-2,6-P
2
was also correlated with an up-regulation of
glucokinase and a down-regulation of glucose-6-phospha-
tase gene expression, suggesting that this biofactor may also
be involved in balancing the uptake and release of glucose
from the liver [8,9].
13
C NMR spectroscopy has been used to measure glucose
and glycogen metabolism in respiring isolated liver cells
[12,13] and perfused liver [12,14–17]. Recently, relative flux
rates have been measured in humans [18–21]. However,
quantification of absolute fluxes in vivo can be complicated
by the fact that no well-defined three-dimensional localiza-
tion method has been used for hepatic studies and by the
limited amount of information available when measuring
the glycogen C1 signal change alone, resulting only in net
glycogen concentration measurements [22]. The present
study presents several advances in the MR technology for
the purpose of measuring hepatic glycogen metabolism.
First, this is the first study to implement and use full three-
dimensional localization of
13
C NMR signals of glycogen in
the intact liver in vivo. Second, during infusion of [1-
13
C]glu-
cose, label incorporation was observed not only into the C1
of glycogen but also the C6, which can only occur by label
scrambling at the level of the trioses. In addition, the signals
of glycogen C2–C5 were detected, possibly reflecting
changes in natural abundance glycogen (i.e. net glycogen
concentration changes). In the present study, we used these
advances in
13
C NMR: (a) to measure the rates of hepatic
glycogen synthesis in normal animals treated with adeno-
virus encoding the double mutant rat liver bifunctional
enzyme in comparison with normal (nondiabetic) control
animals; and (b) to assess the role of hepatic Fru-2,6-P
2
in
controlling glucose and/or glycogen metabolism.
MATERIALS AND METHODS
Animal preparation
The study was conducted according to the guidelines of the
Institutional Animal Care and Use Committee (IACUC) of
the University of Minnesota. Twelve male 129J mice
(Jackson Laboratory, Bar Harbor, ME, USA) were studied
after an overnight fast with access to water (n ¼ 12,
24.7 ± 0.5 g, mean ± SE). Six normal control animals
were studied without any treatment (control group,
23.3 ± 0.2 g body weight). Six mice were treated with an
adenovirus vector containing the cDNA encoding mutant
rat liver bisphosphatase-deficient 6-phosphofructo-2-kinase/
fructose-2,6-bisphosphatase 7 days prior to the study [8] to
overexpress the double mutant rat liver bifunctional enzyme
(ADM group, 26.0 ± 0.5 g body weight).
All animals were initially anesthetized using a bolus
injection of pentobarbital (Abbott Laboratory, North
Chicago, IL, USA) solution (10 mgÆmL
)1
) intraperitoneally
(60 mgÆkg
)1
). Two catheters were inserted into the tail veins,
one for the administration of pentobarbital and one for the
infusion of glucose. A third catheter was placed intraperi-
toneally as an alternative means of glucose administration
should the tail vein fail, which was the case in only three
animals, the data of which were included. After the lines
were inserted, pentobarbital was infused continuously at
4.8–6.0 mgÆkg
)1
Æh
)1
. The animals were secured in a home-
built holder and placed in an acrylic holder attached to an
insert in the gradient coil. Body temperature was maintained
at 37.0 ± 0.5 °C with a warm water circulation system
based on a feedback obtained from a temperature probe
placed on the abdomen of the mice (Cole Parmer, Vernon
Hills, IL, USA). 99% enriched [1-
13
C]
D
-glucose (20% w/v
solution, Isotec Inc., Miamisburg, OH) was infused either
intravenously through the tail vein (n ¼ 9) or intraperiton-
eally (n ¼ 3) with an initial bolus of approximately
50 mgÆkg
)1
Æmin
)1
such that blood glucose was rapidly
raised to 10–12 m
M
. Intraperitoneal and intravenous infu-
sion protocols were optimized in benchtop experiments to
provide a similar rise in plasma glucose in the same short
time. The glucose infusion rate was adjusted continuously
thereafter to maintain a stable liver glucose signal.
NMR methods
All experiments were performed on a 9.4 Tesla, 31 cm bore
horizontal magnet (Magnex Scientific), interfaced to a
Varian INOVA console (Palo Alto, CA, USA). An actively
shielded gradient coil (Magnex Scientific, Abingdon, UK)
with an 11 cm inner diameter was used. A custom-built
quadrature
1
H surface RF coil (14 mm diameter) and a
linear three-turn
13
C coil (12 mm diameter) was used as a
transceiver for
1
HNMRand
13
C NMR spectroscopy built
according to a previously described design [23]. A sphere
filled with 99%
13
C enriched formic acid was placed at the
center of the
13
C coil as an external reference and the coil
was placed on the animal’s abdomen directly over the liver.
The position of the liver was identified in gradient-recalled
echo magnetic resonance images (repetition time,
TR
2
¼ 10 ms, echo time, TE
3
¼ 5 ms). The volume of
interest was placed in the mouse liver with typical volume
sizes of 300–430 lL. Three-dimensional localization based
on a recently described method [24] that uses outer volume
saturation ensured complete elimination of signals from
outside of the volume of interest. The localized signals of
glycogen and glucose were acquired with spectrometer
offset set to 100 p.p.m. (64 scans with repetition time,
TR ¼ 1 s). All data were processed with 15 Hz or 20 Hz
exponential multiplication, zero filling, fast Fourier trans-
formation
4
and zero-order phase correction.
Glycogen and glucose resonances were quantified using
the external reference method as described previously
[25,26]. In short,
13
C NMR signals of glycogen and glucose
in vivo were quantified by comparison with the measure-
ments of phantoms containing solutions of % 400 m
M
natural abundance oyster glycogen and 0.9 m
M
of 99%
enriched [1-
13
C]
D
-glucose. The phantom measurements
were performed under identical experimental conditions as
the in vivo experiments. Coil loading effects on sensitivity
and radio frequency (RF)
5
power were assessed by measur-
ing the 180° pulse duration on the
13
C formic acid signal.
Differences in saturation factors including T
1
relaxation and
the nuclear Overhauser effect (NOE) were assessed in vivo
and in phantom experiments.
Assessment of the overexpression of the double
mutant bifunctional enzyme.
The adenovirus infusion resulted in overexpression of the
bifunctional enzyme, which was assessed as described
previously [8]. The bifunctional enzyme was significantly
Ó FEBS 2002 Regulation of hepatic carbohydrate metabolism in mouse liver (Eur. J. Biochem. 269) 4419
increased after tail-vein infusion of adenovirus within 3 days
and peaked between 5 and 7 days post infusion. The
treatment was accompanied by elevated hepatic Fru-2,6-P
2
levels and lowered blood glucose. In addition, liver glycogen
content was reduced in response to the overexpression of
ADM relative to the untreated normal control animals [8].
Because a direct assessment of the ADM or Fru-2,6-P
2
content in the liver requires tissue extraction, indirect
evidence of ADM overexpression in the liver was assessed
prior to the infusion of glucose from the fasting blood
glucose using a glucose oxidase method (Precision glucom-
eter; Medisense Inc. Waltham, MA, USA) and hepatic
glycogen content determined by natural abundance in vivo
13
C NMR spectroscopy (see above). This approach is direct
evidence for overexpression of the bifunctional enzyme,
because the protocol was entirely identical to that used in
our previous study [8,9].
Measurement of the rate of
13
C label incorporation
into glycogen in the liver
Label incorporation into the glycogen C1 reflects glycogen
synthesis via the direct pathway (glucosefiglucose-6-phos-
phatefiglycogen), whereas label incorporation into the
glycogen C6 reflects activity in the indirect pathway due to
label scrambling at the triose level (glucosefiglucose-6-
phosphatefipyruvate (triose level)figlycogen), which is
predominantly a hepatic process. Changes in
13
C-labeled
glycogen C1 and C6 concentration (rate of
13
Clabel
incorporation, D
13
Glyc
1
and D
13
Glyc
6
) were calculated by
linear regression at specific time points. Data points were
calculated from
13
C NMR spectra with a temporal resolu-
tion of 4–8 min as a result of averaging spectra collected
with % 1 min temporal resolution.
13
C glycogen changes
were calculated at % 2, % 3, and > 4 h from the start of
glucose infusion. For the calculation of glycogen C6
changes, data acquired within 1 h of the start of the glucose
infusion was not included to avoid any influence of transient
changes in the isotopic enrichment.
The rates of
13
C incorporation into glycogen were
expressed as a function of precursor metabolite, glucose-6-
phosphate (Glc6P), according to standard tracer methodo-
logy [27]:
d½
13
Glyc
1
dt
ðtÞ¼V
syn
Á
½
13
Glc6P
1
½Glc6P
ðtÞÀV
phos
Á
½
13
Glyc
1
½Glyc
ðtÞ
ð1Þ
d½
13
Glyc
6
dt
ðtÞ¼V
syn
Á
½
13
Glc6P
6
½Glc6P
ðtÞÀV
phos
Á
½
13
Glyc
6
½Glyc
ðtÞ
ð2Þ
V
net
¼ V
syn
À V
phos
ð3Þ
V
syn
, V
phos
and V
net
represent the flux through glycogen
synthase, phosphorylase, and the rate of net glycogen
synthesis, respectively.
13
Glyc
1
and
13
Glyc
6
represent
13
C-
labeled glycogen C1 and C6 concentration, and
13
Glc6P
1
and
13
Glc6P
6
represent
13
C-labeled glucose-6-phosphate C1
and C6 concentration, respectively. Because the rate of label
incorporation into glycogen C1, the relative isotopic
enrichments of glycogen C1 and C6, and the net glycogen
synthesis rate were measured, Eqns (1), (2) and (3) can be
rearranged to determine V
syn
and the isotopic enrichment of
Glc6P in terms of V
phos
as:
½
13
Glc6P
1
½Glc6P
ðtÞ¼
d½
13
Glyc
1
dt
ðtÞþV
phos
Á
½
13
Glyc
1
½
Glyc
ðtÞ
V
net
þ V
phos
ð4Þ
½
13
Glc6P
6
½Glc6P
ðtÞ¼
d½
13
Glyc
6
dt
ðtÞþV
phos
Á
½
13
Glyc
6
½
Glyc
ðtÞ
V
net
þ V
phos
ð5Þ
For example, V
phos
can be determined by measuring
13
C-
label dilution during unlabeled glucose infusion following
the
13
C-labeled glucose infusion, as we have shown recently
for brain glycogen [26]. Eqns (4) and (5) can be rearranged
to express a relative isotopic enrichment of G6P at the C1
and C6 positions:
½
13
Glc6P
6
½
13
Glc6P
1
¼
d½
13
Glyc
6
dt
ðtÞþV
phos
Á
½
13
Glyc
6
½
Glyc
ðtÞ
d½
13
Glyc
1
dt
ðtÞþV
phos
Á
½
13
Glyc
1
½
Glyc
ðtÞ
ð6Þ
Initially, the enrichment of glycogen is low ([
13
G1yc
6
]/
[Glyc] << 1) and the temporal changes are approximated
by the slope of the linear regression, which can be used to
approximate Eqn (6) as follows:
½
13
Glc6P
6
½
13
Glc6P
1
¼
d½
13
Glyc
6
dt
d½
13
Glyc
1
dt
ffi
½D
13
Glyc
6
½D
13
Glyc
1
%
½
13
Glyc
6
½
13
Glyc
1
ð7Þ
Eqn (7) implies that the initial rate of label incorporation
into glycogen C6 relative to the rate of label incorporation
into glycogen C1 reflects the relative isotopic enrichment of
Glc6P in the C6 relative to the C1 position. When the
changes in glycogen C1 and C6 are linear with time, the
differentials in the middle part of Eqn (7) can be replaced by
the differences in label incorporation relative to that at time
zero (which is close to zero) resulting in the right-hand
approximation.
RESULTS
Localized
13
C NMR spectra were acquired from the volume
of interest using a three-dimensional localization method.
The location of the volume of interest, with a nominal
volume of 400 lL was based on sagittal and transverse MR
images of the mouse liver (Fig. 1A). Both the reduced blood
glucose (fasting plasma glucose of 5.5 ± 0.3 m
M
in control
vs. 4.1 ± 0.2 m
M
in ADM mice, mean ± SE) and initial
liver glycogen content in the ADM mice were consistent
with bifunctional enzyme overexpression in all experiments.
During infusion of [1-
13
C]
D
-glucose, signals from the
glucose C1 resonances were immediately detected, along
with natural abundance signals from glycerol C1 and C3 at
62.5 p.p.m. (Fig. 1B, bottom trace). Label incorporation
into the glycogen C1 was apparent soon thereafter (Fig. 1B,
middle trace) followed by label incorporation into a
resonance that was clearly resolved from the glycerol C1,
C3 resonance. This resonance was assigned to the glycogen
C6 (Fig. 1B, top trace) based on its chemical shift of
61.4 p.p.m. [28] and that the linewidth was % 77 Hz (after
20 Hz linebroadening), which was clearly broader than the
glucose resonances. The nearby glucose resonances were not
4420 I Y. Choi et al. (Eur. J. Biochem. 269) Ó FEBS 2002
expected to contribute to the glycogen C6 signal change,
because the continuous infusion of [1-
13
C] glucose will result
in a stable isotopic enrichment for plasma (and liver) glucose
of only a few percentage at C6, leading to a much weaker
signal compared to glycogen C6. The ability to resolve
the resonance of glycerol C1, C3 at 62.5 p.p.m. from the
resonance of glycogen C6 allowed, for the first time, the
measurement of glycogen C6 changes in vivo, which reflects
the indirect pathway.
13
C NMR spectra were acquired while infusing [1-
13
C]
glucose in an ADM mouse over 7.6 h (Fig. 2). The glucose
level in the liver was maintained at 9.7 ± 0.6 lmolÆg
)1
(mean ± SE, n ¼ 6, control mice) and at 9.1 ± 0.5
lmolÆg
)1
(mean ± SE, n ¼ 6, ADM mice) throughout the
experiments. The
13
C-label incorporation into hepatic
glycogen C1 and C6 increased at a nearly constant rate
for the entire measurement period (Fig. 2).
In addition to the signal increases in glycogen C1 and C6,
increased signals were observed in the spectral region from
70 to 78 p.p.m. containing the glycogen C2 through C5
resonances (Fig. 2A), which is enlarged in Fig. 2B. The
increase of these signals is consistent with the spectral
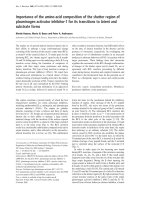
Fig. 1.
1
HMRIand
13
C MRS of the mouse liver. (A) Sagittal (left) and transverse (right) images of the liver of a control mouse acquired using the
FLASH sequence (TR ¼ 10 ms, TE ¼ 5 ms). The rectangles indicate the location of the volume of interest, % 400 lL(8.5 · 8 · 6mm
3
). The
13
C-
labeled formic acid sphere can be seen on the left. (B) Three-dimensional localized
13
C NMR spectra were acquired from a nominal 400 lL volume
of the control mouse liver during infusion of [1-
13
C]
D
-glucose. The spectra were acquired 0.1 h (bottom), 1.5 h (middle), and 3 h (top) after the start
of the infusion, and each represents an average over 4.3 min (256 scans, 1 s repetition time). Glycogen syntheses via direct and indirect pathways are
demonstrated from the increases of signal intensities of glycogen C1 and C6, respectively. Data processing consisted of 15 Hz exponential
multiplication, zero filling, FFT and zero-order phase correction. No baseline correction was applied.
Ó FEBS 2002 Regulation of hepatic carbohydrate metabolism in mouse liver (Eur. J. Biochem. 269) 4421
Fig. 2. Hepatic glycogen synthesis with [1-
13
C]glucose infusion in an ADM mouse. (A) The stack plot of
13
C spectra acquired over 7.6 h after
beginning at t ¼ 0 (right scale), the infusion of [1-
13
C]glucose.
13
C-label incorporation into hepatic glycogen was detected in the glycogen C1 and C6
resonances. Net synthesis of glycogen in the liver is visible from the natural abundance signal increase of glycogen C2–C5. The resonance of glycerol
C1 and C3 at 62.5 p.p.m. was resolved downfield from the signal of glycogen C6 at 61.4 p.p.m. (B) The region containing the glycogen C2–C5
signals (from Fig. 2A) was expanded vertically to demonstrate the net synthesis of hepatic glycogen during infusion of glucose. Each spectrum
corresponds to a 17-min acquisition period. Processing consisted of 20 Hz exponential multiplication, with zero filling, FFT and zero-order phase
correction. The spectra are shown without any baseline correction.
4422 I Y. Choi et al. (Eur. J. Biochem. 269) Ó FEBS 2002
pattern of natural abundance glycogen in this region (not
shown) and thus was assigned to reflect primarily increases
in total hepatic glycogen. This analysis was based on the
integration of all the C2–C5 glycogen signals. To determine
the potential labeling of the glycogen C2 and C5 resonance
due to label scrambling from pyruvate carboxylase/phos-
phoenolpyruvate carboxykinase activity (Ôpyruvate recyc-
lingÕ), the intensity of glycogen C4 was compared to the sum
of the C2, C3, C4 and C5 resonances. This comparison
showed that glycogen C4 had the same time course (data
not shown), indicating that pyruvate recycling had a
negligible contribution to the labeling of glycogen under
the conditions of our experiment. Natural abundance
signals of glycogen were acquired for 30 min before the
[1-
13
C] glucose infusion was begun and the quantification
yielded a total glycogen of 246 ± 45.5 lmolÆg
)1
(mean ±
SE, n ¼ 6) in control and 118 ± 27.3 lmolÆg
)1
(mean ±
SE, n ¼ 6) in ADM mice.
Time-resolved in vivo measurements of
13
C-labeled gly-
cogen and glucose in the normal (Fig. 3A) and the ADM
(Fig. 3B) mouse liver during 4 h of infusion showed that
label incorporation into glycogen C6 lagged compared to
that into glycogen C1 in both groups, consistent with the
requirement to reach isotopic equilibrium in the glycolytic
intermediates downstream of Glc6P such as at the level of
the trioses. The ratio of change in glycogen C6 relative to
that in glycogen C1 reflects the relative isotopic enrichment
of Glc6P atC6relativetoC1(Eqn7).Atnatural
abundance, the ratio is one and decreases to a steady-state
value after an initial equilibration period. This results in a
transient change in the Glyc
6
/Glyc
1
ratio, even when the
equilibration of the Glc6P pool was instantaneous. There-
fore, the time required to achieve isotopic steady-state at the
Glc6P level was faster than the 0.61 ± 0.05 h required for
Glyc
6
/Glyc
1
to approach steady-state (Fig. 4). From the
ratioofglycogenC6andC1(Glyc
6
/Glyc
1
), we conclude
thattherelativeisotopicenrichmentinC6ofGlc6P was
significantly higher in ADM than that in control mice.
Therateof
13
C label incorporation into glycogen C1
(synthase flux) was 22 ± 1.5 lmolÆg
)1
Æh
)1
(mean ± SE) in
the control group and 24 ± 1.8 lmolÆg
)1
Æh
)1
in the ADM
group, which was not statistically different between the two
groups (n ¼ 6, p ¼ 0.34, two-tailed t-test, Fig. 5). However,
the rate of label incorporation into glycogen C6 was
significantly lower in the control (3.7 ± 0.5 lmolÆg
)1
Æh
)1
,
mean ± SE) compared to the ADM group (5.6 ± 0.5
lmolÆg
)1
Æh
)1
,mean±SE)(n ¼ 6, p ¼ 0.02). The rate of
net glycogen synthesis was significantly lower in the control
group (47.2 ± 6.5 lmolÆg
)1
Æh
)1
) than the ADM group
(95.7 ± 19.9 lmolÆg
)1
Æh
)1
)(n ¼ 6, p ¼ 0.04). Overall the
rates of glycogen metabolism in the control group were
lower than those in the ADM group.
DISCUSSION
In this study, changes in hepatic carbohydrate metabolism
due to the alteration of the activity of bifunctional enzyme
6-phosphofructo-2-kinase/fructose-2,6-bisphosphatase were
monitored using 3D-localized
13
C NMR spectroscopy.
Fig. 3. Time course of label incorporation into hepatic glycogen and
glucose in control and ADM mice. (A) Representative time courses of
glycogen and glucose from the control mouse liver. (B) Representative
time courses of glycogen and glucose from the ADM mouse liver. The
concentrations of glycogen C1 and glucose C1 resonances are scaled on
the left axis and the concentration of glycogen C6 resonance is scaled
on the right axis. The spectra used for this plot were averaged to a
temporal resolution of 8.5 min (512 scans, 1 s repetition time).
Fig. 4. Isotopic steady-state at the Glc6P level in the liver in vivo.
13
Glc6P
6
/
13
Glc6P
1
is approximated by the ratio of the glycogen C6 to
the C1 concentration,
13
Glyc
6
/
13
Glyc
1
(Eqn 7); shown is a control
mouse (closed circles) and an ADM mouse (open circles) plotted to-
gether with the [1-
13
C]hepatic glucose concentration (top box, with
scale to the right) for the control (solid line) and ADM mouse (dashed
line).
13
C glucose concentration in the liver was maintained at about
10 lmolÆg
)1
in both groups as shown in the top plot.
Ó FEBS 2002 Regulation of hepatic carbohydrate metabolism in mouse liver (Eur. J. Biochem. 269) 4423
Because of its high concentration in hepatic tissue leading to
a high sensitivity, the study focused on the measurement of
the glycogen signals. This study represents several novel
advances in in vivo NMR methodology. First, the challenges
presented by measuring a well-defined volume of hepatic
tissue in the small liver volume were overcome using a three-
dimensional localization method in conjunction with an RF
coil design optimized for the mouse liver and very high
magnetic field, 9.4 Tesla. Although challenges remain in
shimming the signals from the mouse liver, localization was
important to eliminate potential signal sources from non-
hepatic tissue, which was accomplished by a well-defined
volume of interest that concomitantly improved spectral
quality. This was evident from the separation of the
glycogen C6 and glycerol C1, C3 signals, an achievement
that, to our knowledge, has not been achieved in the intact
liver in vivo. The importance of the detection of label
incorporation into glycogen C6 while infusing [1-
13
C]glu-
cose can be appreciated from the fact that this labeling
pattern is only possible due to activity of the indirect
pathway of glycogen synthesis. In addition, this study
reports for the first time the simultaneous detection of
increased signal intensity for the glycogen C2–C5 resonances.
These changes in intensity were attributed to increases in the
natural abundance glycogen concentration, based on the
observation that the rate of the glycogen C4 signal intensity
changed in parallel with the signal intensity of all C2–C5
resonances, and that the spectra shown in Fig. 2B closely
resembled those of natural abundance glycogen in aqueous
solutions. Therefore, this study reports the first simulta-
neous measurements of label incorporation into glycogen
C1 and C6, as well as changes in total glycogen content
in vivo, which can be used to assess the activity of the direct
and indirect pathway, as well as net glycogen changes.
To our knowledge, this is also the first study to apply this
technology to adenovirus transfected mouse liver. Previ-
ously, we reported that the levels of Fru-2,6-P
2
were
significantly increased by adenovirus-mediated overexpres-
sion of a mutant form of 6-phosphofructo-2-kinase/
fructose-2,6-bisphosphatase in the mouse liver [8,9]. The
increased hepatic Fru-2,6-P
2
levels resulted in mild hypo-
glycemia in normal mice and amelioration of hyperglycemia
in diabetic animals. In this study, the impact of hepatic
overexpression of 6-phosphofructo-2-kinase/fructose-
2,6-bisphosphatase on glucose and glycogen metabolism
due to altered hepatic Fru-2,6-P
2
levels was monitored using
3D localized
13
C NMR spectroscopy and the results were
consistent with our recent in vitro measurements [8]. For
example, the liver glycogen concentration determined in vivo
by natural abundance
13
C NMR spectroscopy just prior to
infusion of the [1-
13
C] glucose was reduced in the ADM
mice relative to the control animals. The lower hepatic
glycogen content in the ADM group reflects increased
glycogen utilization in an effort of the liver to establish
euglycemia and reflects an overexpression of double mutant
6-phosphofructo-2-kinase/fructose-2,6-bisphosphatase in
the livers of these mice. Although this is qualitatively
consistent with our earlier results [8], the hepatic glycogen
content in this study was approximately 20–25% lower than
that determined previously in vitro, which was attributed to
the fact that in contrast to the previous work, in the present
study mice were fasted for 8–12 h before the NMR
experiments were begun. Together, these results demon-
strate that increased Fru-2,6-P
2
has similar metabolic effects
in the fed as well as in the fasted state. During the NMR
experiments, the infusion of [1-
13
C] glucose was sufficient to
maintain blood glucose levels between 10 and 12 m
M
to
induce hyperglycemic states similar to diabetes. The glyco-
gen repletion observed in both the control and ADM
groups was consistent with transition from the fasted to the
hyperglycemic (fed) states. The striking linearity of the
signal increase of glycogen C1 and C6 during this long
measurement period (Fig. 3) implies measurement of either
the early phase of turnover, as the curve did not show any
evidence for a leveling of the signal (which suggests a
surprisingly long turnover time), or net synthesis of glycogen
or the combination of both.
The rates of total glycogen synthesis and
13
Clabel
incorporation into glycogen (Fig. 5) suggest that the
overall rate of glycogen synthesis is much higher than
the rate at which the labeled glucose is incorporated into
the newly synthesized glycogen. This result was unexpected,
since the amount of label transferred into glycogen should
reflect turnover as well as synthesis and thus be higher
than the rate of net glycogen synthesis. This observation
can be explained, however, by assuming that the isotopic
enrichment of Glc6P was much lower than that of
glucose. A lower enrichment of Glc6P relative to glucose
may be due to a slow rate of glucose phosphorylation, or
dilution by extra-hepatic precursors and an active indirect
pathway of glycogen synthesis. Previous work suggests
that the latter situation is more likely, as increased hepatic
Fru-2,6-P
2
was associated with an up-regulation of
glucokinase and a down-regulation of Glc6Pase gene
expression [8]. These observations are also consistent with
previous reports suggesting that 30% to 70% of the
postprandial liver glycogen is from the indirect pathway
[29–31].
Although the increased hepatic Fru-2,6-P
2
produced by
the ADM treatment promoted a higher rate of net glycogen
Fig. 5. Rate of glycogen C1, C6 and net glycogen changes during
[1-
13
C]glucose infusion in the mouse liver in vivo. The rates of glycogen
C1 and C6 changes were plotted in the left two pairs of bar graphs (left
axis) and the rate of net glycogen changes was plotted in the right pair
of bar graphs (right axis). The hatched columns are from the control
group (n ¼ 6) and the solid columns are from the ADM group
(n ¼ 6). The rate changes were calculated by linear regression. Data
are shown in mean ± SE (error bars). * denotes statistically significant
difference in means based on a two-tailed t-test (P <0.05,n ¼ 6).
4424 I Y. Choi et al. (Eur. J. Biochem. 269) Ó FEBS 2002
synthesis when compared to the normal control mice, the
rate of [1-
13
C] glucose incorporation was not significantly
increased. However, the rate of
13
C incorporation into the
C6 position in glycogen was significantly increased in the
ADM group, which suggests that the indirect pathway for
glycogen deposition was activated in response to increased
hepatic Fru-2,6-P
2
. This is a surprising result when consid-
ering that the putative effect of Fru-2,6-P
2
is to activate
6-phosphofructo-1-kinase and inhibit fructose-1,6-bisphos-
phatase, which should have reduced the activity of the
indirect pathway of glycogen synthesis, as it depends on flux
through fructose-1,6-bisphosphatase. However, it is likely
that the increased rate of
13
C label incorporation into the C6
position of glycogen in the ADM group is indicative of
activated 6-phosphofructo-1-kinase, which can lead to
increased
13
C labeling at the triose level. Such a mechanism
can lead to increases in labeling of glycogen C6 even in the
presence of decreased activity of the indirect pathway,
provided that the increase in glycolytic flux exceeded the
decreased gluconeogenic flux substantially. The ability of
the liver to replenish glycogen stores via the indirect
pathway, even in the face of high Fru-2,6-P
2
levels, suggests
that the activation of 6-phosphofructo-1-kinase by this
biofactor is more potent than its inhibition of fructose-1,6-
bisphosphatase. This is a significant observation because it
offers the first in vivo assessment of the action of Fru-2,6-P
2
on the 6-phosphofructo-1-kinase/fructose-1,6-bisphospha-
tase cycle. The result must be interpreted with care,
however, as both glycolysis and glycogen synthesis have
been shown to be influenced by substrate channeling and
protein–protein interactions [32–34]. Such mechanisms may
provide for effective ÔpoolingÕ of glycolytic/glycogenic
precursors, i.e. Glc6P.
In summary, based on several substantial advances in the
13
C NMR methodology, the observation of simultaneously
enhanced indirect hepatic glycogen synthesis and glycolysis
in the ADM group has clarified the in vivo action of Fru-2,6-
P
2
on the 6-phosphofructo-1-kinase/fructose-1,6-bisphos-
phatase cycle, suggesting that the activation of glycolysis
predominates over the inhibition of gluconeogensis. These
data, in conjunction with our earlier reports, strongly
suggest that the bifunctional enzyme is an enticing target for
antidiabetic therapies aimed at increasing hepatic Fru-2,6-
P
2
content.
ACKNOWLEDGEMENTS
This study was supported by the NIH grants R01DK38354 (A. J. L.)
and two Grants-in-Aid by the University of Minnesota Graduate
School (R. G., A. J. L.). Purchase of 9.4 Tesla magnet was partially
supported by a gift from the W. M. Keck Foundation and the Center
for MR research is in part supported by a biotechnology research
program grant from the National Center for Research Resources,
P41RR08079.
REFERENCES
1. Nordlie, R.C., Foster, J.D. & Lange, A.J. (1999) Regulation of
glucose production by the liver. Annu. Rev. Nutr. 19, 379–406.
2. Cherrington, A.D. (1999) Banting Lecture 1997. Control of glu-
cose uptake and release by the liver in vivo. Diabetes 48, 1198–
1214.
3. Okar, D.A., Lange, A.J., Manzano, A., Navarro-Sabate, A.,
Riera, L. & Bartrons, R. (2001) PFK-2/FBPase-2: maker and
breaker of the essential biofactor fructose-2,6-bisphosphate.
Trends. Biochem. Sci. 26, 30–35.
4. Pilkis, S.J., Chrisman, T., Burgress, B., McGrane, M., Colosia, A.,
Pilkis, J., Claus, T.H. & el-Maghrabi, M.R. (1983) Rat hepatic
6-phosphofructo 2-kinase/fructose 2,6-bisphosphatase: a unique
bifunctional enzyme. Adv. Enzyme. Regul. 21, 147–173.
5. Van Schaftingen, E. & Hers, H.G. (1981) Phosphofructokinase 2:
the enzyme that forms fructose 2,6-bisphosphate from fructose
6-phosphate and ATP. Biochem. Biophys. Res. Commun. 101,
1078–1084.
6. Pilkis, S.J., el-Maghrabi, M.R. & Claus, T.H. (1988) Hormonal
regulation of hepatic gluconeogenesis and glycolysis. Annu. Rev.
Biochem. 57, 755–783.
7. El-Maghrabi, M.R., Pate, T.M., Murray, K.J. & Pilkis, S.J. (1984)
Differential effects of proteolysis and protein modification on the
activities of 6-phosphofructo-2-kinase/fructose-2,6-bisphospha-
tase. J. Biol. Chem. 259, 13096–13103.
8. Wu, C., Okar, D.A., Newgard, C.B. & Lange, A.J. (2001) Over-
expression of 6-phosphofructo-2-kinase/fructose-2,6-bisphospha-
tase in mouse liver lowers blood glucose by suppression of hepatic
glucose production. J. Clin. Invest. 107, 91–98.
9. Wu, C., Okar, D.A., Newgard, C.B. & Lange, A.J. (2002)
Increasing fructose 2,6-bisphosphate overcomes hepatic insulin
resistance of type 2 diabetes. Am. J. Physiol. Endocrinol. Metab.
282, E38–E45.
10. Kurland, I.J., el-Maghrabi, M.R., Correia, J.J. & Pilkis, S.J. (1992)
Rat liver 6-phosphofructo-2-kinase/fructose-2,6-bisphosphatase.
Properties of phospho- and dephospho- forms and of two mutants
in which Ser32 has been changed by site-directed mutagenesis.
J. Biol. Chem. 267, 4416–4423.
11. Tauler, A., Lin, K. & Pilkis, S.J. (1990) Hepatic 6-phosphofructo-
2-kinase/fructose-2,6-bisphosphatase. Use of site-directed muta-
genesis to evaluate the roles of His-258 and His-392 in catalysis.
J. Biol. Chem. 265, 15617–15622.
12. Cohen, S.M., Ogawa, S. & Shulman, R.G. (1979) 13C NMR
studies of gluconeogenesis in rat liver cells: utilization of labeled
glycerol by cells from euthyroid and hyperthyroid rats. Proc. Natl
Acad.Sci.USA76, 1603–1609.
13. Cohen, S.M., Rognstad, R., Shulman, R.G. & Katz, J. (1981)
A comparison of
13
C nuclear magnetic resonance and 14C
tracer studies of hepatic metabolism. J. Biol. Chem. 256, 3428–
3432.
14. Cohen, S.M. (1983) Simultaneous
13
Cand
31
PNMRstudiesof
perfused rat liver. Effects of insulin and glucagon and a
13
CNMR
assay of free Mg
2+
. J. Biol. Chem. 258, 14294–14308.
15. Iles, R.A., Griffiths, J.R., Stevens, A.N., Gadian, D.G. &
Porteous, R. (1980) Effects of fructose on the energy metabolism
and acid-base status of the perfused starved-rat liver. A 31phos-
phorus nuclear magnetic resonance study. Biochem. J. 192,
191–202.
16. Shulman, G.I., Rothman, D.L., Smith, D., Johnson, C.M., Blair,
J.B.,Shulman,R.G.&DeFronzo,R.A.(1985)Mechanismofliver
glycogen repletion in vivo by nuclear magnetic resonance spec-
troscopy. J. Clin. Invest. 76, 1229–1236.
17. Shulman, G.I., Rossetti, L., Rothman, D.L., Blair, J.B. & Smith,
D. (1987) Quantitative analysis of glycogen repletion by nuclear
magnetic resonance spectroscopy in the conscious rat. J. Clin.
Invest. 80, 387–393.
18. Rothman, D.L., Magnusson, I., Katz, L.D., Shulman, R.G. &
Shulman, G.I. (1991) Quantitation of hepatic glycogenolysis and
gluconeogenesis in fasting humans with
13
CNMR.Science 254,
573–576.
19. Magnusson, I., Rothman, D.L., Jucker, B., Cline, G.W., Shul-
man, R.G. & Shulman, G.I. (1994) Liver glycogen turnover in fed
and fasted humans. Am. J. Physiol. 266, E796–E803.
20. Roden,M.,Perseghin,G.,Petersen,K.F.,Hwang,J.H.,Cline,
G.W., Gerow, K., Rothman, D.L. & Shulman, G.I. (1996) The
Ó FEBS 2002 Regulation of hepatic carbohydrate metabolism in mouse liver (Eur. J. Biochem. 269) 4425
roles of insulin and glucagon in the regulation of hepatic glycogen
synthesis and turnover in humans. J. Clin. Invest. 97, 642–648.
21. Petersen, K.F., Laurent, D., Rothman, D.L., Cline, G.W. &
Shulman, G.I. (1998) Mechanism by which glucose and insulin
inhibit net hepatic glycogenolysis in humans. J. Clin. Invest. 101,
1203–1209.
22. David, M., Petit, W.A., Laughlin, M.R., Shulman, R.G., King,
J.E. & Barrett, E.J. (1990) Simultaneous synthesis and degradation
of rat liver glycogen. An in vivo nuclear magnetic resonance
spectroscopic study. J. Clin. Invest. 86, 612–617.
23. Adriany, G. & Gruetter, R. (1997) A half Volume coil for efficient
proton decoupling in humans at 4 Tesla. J. Magn. Reson. 125,
178–184.
24. Choi, I Y., Tkac, I. & Gruetter, R. (2000) Single-shot, three-
dimensional Ônon-echoÕ localization method for in vivo NMR
spectroscopy. Magn. Reson. Med. 44, 387–394.
25. Gruetter, R., Ugurbil, K. & Seaquist, E.R. (1998) Steady-state
cerebral glucose concentrations and transport in the human brain.
J. Neurochem. 70, 397–408.
26. Choi,I Y.,Tkac,I.,Ugurbil,K.&Gruetter,R.(1999)Non-
invasive measurements of [1-
13
C] glycogen concentrations and
metabolism in rat brain in vivo. J. Neurochem. 73, 1300–1308.
27. Watanabe, H. & Passonneau, J.V. (1973) Factors affecting the
turnover of cerebral glycogen and limit dextrin in vivo. J. Neu-
rochem. 20, 1543–1554.
28. Canioni, P. & Quistorff, B. (1994) Liver Physiology and Metabo-
lism in NMR in Physiology and Biomedicine, pp. 373–388. Aca-
demic Press, San Diego, CA.
29. Magnusson, I. & Shulman, G.I. (1991) Pathways of hepatic
glycogen synthesis in humans. Med. Sci. Sports. Exerc. 23,
939–943.
30. Spence, J.T. & Koudelka, A.P. (1985) Pathway of glycogen
synthesis from glucose in hepatocytes maintained in primary cul-
ture. J. Biol. Chem. 260, 1521–1526.
31. Newgard, C.B., Hirsch, L.J., Foster, D.W. & McGarry, J.D.
(1983) Studies on the mechanism by which exogenous glucose is
converted into liver glycogen in the rat. A direct or an indirect
pathway? J. Biol. Chem. 258, 8046–8052.
32. Yang, R., Cao, L., Gasa, R., Brady, M.J., Sherry, A.D. & New-
gard, C.B. (2002) Glycogen-targeting subunits and glucokinase
differentially affect pathways of glycogen metabolism and their
regulation in hepatocytes. J. Biol. Chem. 277, 1514–1523.
33. O’Doherty, R.M., Jensen, P.B., Anderson, P., Jones, J.G., Ber-
man, H.K., Kearney, D. & Newgard, C.B. (2000) Activation of
direct and indirect pathways of glycogen synthesis by hepatic
overexpression of protein targeting to glycogen. J. Clin. Invest.
105, 479–488.
34. Agius, L., Centelles, J. & Cascante, M. (2002) Multiple glucose
6-phosphate pools or channelling of flux in diverse pathways?
Biochem. Soc. Trans. 30, 38–43.
4426 I Y. Choi et al. (Eur. J. Biochem. 269) Ó FEBS 2002