Báo cáo " CARBON DIOXIDE EMISSIONS FROM THE GLOBAL CEMENT INDUSTRY " pdf
Bạn đang xem bản rút gọn của tài liệu. Xem và tải ngay bản đầy đủ của tài liệu tại đây (585.37 KB, 28 trang )
1 Oct 2001 16:51 AR AR143-11-WOR.tex AR143-11-WOR.SGM ARv2(2001/05/10) P1: GSR
Annu. Rev. Energy Environ. 2001. 26:303–29
CARBON DIOXIDE EMISSIONS FROM
THE
GLOBAL CEMENT INDUSTRY
∗
Ernst Worrell,
1
Lynn Price,
1
Nathan Martin,
1
Chris Hendriks,
2
and Leticia Ozawa Meida
3
1
Energy Analysis Department, Lawrence Berkeley National Laboratory, Berkeley,
California 94720,
2
Ecofys, 3503 RK, Utrecht, The Netherlands, and
3
Instituto de
Ingenieria, Universidad Nacional Autonoma de Mexico, Coyoacan, 04510, Mexico, D.F.;
e-mail: , , , ,
Key Words calcination, climate change, clinker, energy
■ Abstract The cement industry contributes about 5% to global anthropogenic
CO
2
emissions, making the cement industry an important sector for CO
2
-emission
mitigation strategies. CO
2
is emitted from the calcination process of limestone, from
combustion of fuels in the kiln, as well as from power generation. In this paper, we
review the total CO
2
emissions from cement making, including process and energy-
related emissions. Currently, most available data only includes the process emissions.
We also discuss CO
2
emission mitigation options for the cement industry. Estimated
total carbon emissions from cement production in 1994 were 307 million metric tons
of carbon (MtC), 160 MtC from process carbon emissions, and 147 MtC from energy
use. Overall, the top 10 cement-producing countries in 1994 accounted for 63% of
global carbon emissions from cement production. The average intensity of carbon
dioxide emissions from total global cement production is 222 kg of C/t of cement.
Emission mitigation options include energy efficiency improvement, new processes,
a shift to low carbon fuels, application of waste fuels, increased use of additives in
cement making, and, eventually, alternative cements and CO
2
removal from flue gases
in clinker kilns.
CONTENTS
1. INTRODUCTION 304
2. PROCESS DESCRIPTION OF CEMENT MAKING 305
2.1. Cement Properties 305
2.2. Process Description 306
2.3. Energy Use in Cement Making 309
∗
The US government has the right to retain a nonexclusive, royalty-free license in and to
any copyright covering this paper.
303
1 Oct 2001 16:51 AR AR143-11-WOR.tex AR143-11-WOR.SGM ARv2(2001/05/10) P1: GSR
304 WORRELL ET AL.
3. CEMENT PRODUCTION TRENDS 311
4. GLOBAL CARBON DIOXIDE EMISSIONS
FROM CEMENT MAKING 316
4.1. Carbon Dioxide Emissions from Calcination 317
4.2. Carbon Dioxide Emissions from Fuel Use 317
4.3. Carbon Dioxide Emissions from Electricity Use 318
4.4. Total Carbon Dioxide Emissions from Cement Production 318
5. REDUCTION OF CARBON DIOXIDE EMISSIONS 319
5.1. Energy Efficiency Improvement 319
5.2. Replacing High-Carbon Fuels with Low-Carbon Fuels 322
5.3. Blended Cements 324
5.4. Carbon Dioxide Removal 325
6. CONCLUSIONS 326
1. INTRODUCTION
The threat of climate change is considered to be one of the major environmental
challenges for our society. Carbon dioxide (CO
2
) is one of the major greenhouse
gases. Anthropogenic sources of CO
2
are the combustion of fossil fuels, deforesta-
tion, unsustainable combustion of biomass, and the emission of mineral sources
of CO
2
. The production of cement contributes to the emission of CO
2
through the
combustion of fossil fuels, as well as through the decarbonization of limestone. In
this review we focus on the cement industry. Currently available data assesses only
emissions from decarbonization of limestone, and there is no inclusive review of
the emissions due to energy use in the cement industry. This is the first review of
the total CO
2
emissions of the global cement industry.
Cement is one of the most important building materials worldwide. It is used
mainly for the production of concrete. Concrete is a mixture of inert mineral
aggregates, e.g., sand, gravel, crushed stones, and cement. Cement consumption
and production is closely related to construction activity and, therefore, to the
general economic activity. Because of the importance of cement as a construction
material, and because of the geographic abundance of the main raw materials,
cement is produced in virtually all countries. The widespread production is also
due to the relatively low price and high density of cement that, in turn, limits
ground transportation because of high transport costs.
Cement production is a highly energy-intensive production process. Energy
consumption by thecement industry is estimated at about 2% of theglobal primary
energy consumption, or almost 5% of the total global industrial energy consump-
tion (1). Because of the dominant use of carbon-intensive fuels, such as coal in
clinker making, the cement industry is a major source of CO
2
emissions. Besides
energy consumption, the clinker-making process also emits CO
2
from the calcin-
ing process. Because of both emission sources, and because of the emissions from
electricity production, the cement industry is a major source of carbon emissions
and deserves attention in the assessment of carbon emission-reduction options.
1 Oct 2001 16:51 AR AR143-11-WOR.tex AR143-11-WOR.SGM ARv2(2001/05/10) P1: GSR
GLOBAL CEMENT INDUSTRY 305
This warrants in-depth research, as climate change mitigation may have profound
effects on the cement industry (2–4).
In this paper we review the role of the cement industry in global CO
2
emissions.
First we describe the cement production process, the main process variants, and
the main emission sources. This is followed by an assessment of historical devel-
opment and regional development of cement production, followed by an overview
of the emissions from cement production. Finally, we provide a brief review of the
opportunities for emission reduction, both from the use of fossil fuels and from
the calcination process in cement making.
2. PROCESS DESCRIPTION OF CEMENT MAKING
2.1. Cement Properties
Cement is an inorganic, nonmetallic substance with hydraulic binding properties.
Mixed with water it forms a paste, which hardens owing to formation of hydrates.
After hardening, the cement retains its strength. There are numerous types of
cement because of the use of different sources for calcium and different additives
to regulate properties. Table 1 gives an overview of important cement types. The
exact composition of cement determines its properties (e.g., sulphate resistance,
alkali content, heat of hydration), whereas the fineness is an important parameter
in the development of strength and rate of setting.
In 1995, global cement production was estimated to be 1453 million metric
tons (Mt) (5). Because of the importance of cement as a construction material, and
TABLE 1 Summary of the main cement types, composition, and raw materials needed
Cement type Composition Remarks
Portland
a
95% clinker Gypsum improves
5% gypsum workability of cement
Portland slag 60% clinker
Portland pozzolana 40% slag, pozzolana, fly ash
Portland fly ash
Iron Portland (Germany)
Blast furnace 20%–65% clinker Only granulated slag can
35%–80% blast furnace slag be used, not air cooled
Pozzolanic 60% clinker Important in countries with
40% pozzolana volcanic materials
Masonry Mixture of clinker and ground Binder for brick work
limestone
a
Named Portland because the artificial stone made from the first Portland cement (1824) resembled natural stone from
the peninsula Portland.
1 Oct 2001 16:51 AR AR143-11-WOR.tex AR143-11-WOR.SGM ARv2(2001/05/10) P1: GSR
306 WORRELL ET AL.
becauseofthegeographic abundanceofthemainrawmaterials,cementis produced
in virtually all countries. The widespread production is also due to the relatively
low price and high density of cement, which in turn limits ground transportation
becauseof hightransportcosts. In1996,globalcement tradewas106Mt ofcement,
7% of global cement production.
2.2. Process Description
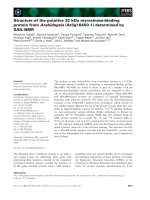
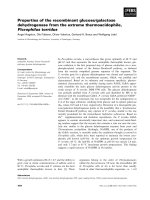
Cement production is a highly energy-intensive process. Cement making consists
of three major process steps (Figure 1): raw material preparation, clinker making
in the kiln, and cement making. Raw material preparation and cement making are
the main electricity-consuming processes, while the clinker kiln uses almost all
the fuel in a typical cement plant. Clinker production is the most energy-intensive
production step, responsible for about 70%–80% of the total energy consumed (1).
Raw material preparation and finish grinding are electricity-intensive production
steps. Energy consumption by the cement industry is estimated at 2% of the global
primary energy consumption (1), or 5% of the total global industrial energy con-
sumption. In the process described below, we focus on energy use because of its
importance as one of the potential sources of CO
2
emissions.
Figure 1 Simplified process sche-
matic of cement making.
1 Oct 2001 16:51 AR AR143-11-WOR.tex AR143-11-WOR.SGM ARv2(2001/05/10) P1: GSR
GLOBAL CEMENT INDUSTRY 307
2.2.1. RAW MATERIAL PREPARATION The most common raw materials used for
cement production are limestone, chalk, and clay, although more than 30 raw
materials can be used (6). An exact and constant composition of the raw materials
is important for the quality and uniformity of cement. The collected raw materials
are selected, crushed, and ground so that the resulting mixture has the desired fine-
ness and chemical composition for delivery to the pyro-processing systems (6, 7).
A jaw or gyratory crusher, a roller, or a hammer mill is used to crush the limestone.
The crushed material is screened, and stones are removed. Following crushing, the
raw materials are further processed. The grinding process differs with the type of
pyro-processing used (see below), either using ball or rolling mills. The feed to
the kiln is called raw meal. Approximately 1.65–1.75 t of raw meal are needed to
produce1tofclinker (8).
2.2.2. CLINKER PRODUCTION (PYRO-PROCESSING) Clinker is produced by pyro-
processing. The raw meal is burned at high temperatures, first calcining the mate-
rials, followed by clinkerization to produce clinker. Various kiln types have been
used historically or are used around the world. Besides the rotary kiln, the vertical
shaft kiln is used mainly in developing countries. We discuss the general trends
in kiln types and development, followed by a discussion of energy use in cement
making.
Vertical shaft kilns for clinker production have been in use since the invention
of Portland cement in 1824. The intermittent operation of these kilns led to an ex-
tremely high energy consumption. Continuous production of clinker started with
the use of shaft kilns around 1880, followed by the introduction of the dry rotary
kiln. The wet process, fed by slurry, was introduced to achieve better homogeniza-
tion of the kiln feed, easier operation, less dust, and more uniform cement quality.
In 1928, the Lepol, or semi-dry, process was introduced, reducing moisture con-
tent of the material entering the kiln and reducing fuel consumption. Improved raw
meal homogenizationsystems and dust collection equipmentimprovedthe product
quality of the dry process. The long dry kiln, originally introduced in the United
States, was relatively inefficient because of high energy losses. The introduction
of a dry kiln with material (suspension) preheating reduced the energy costs com-
pared with the commercially used processes in the 1950s. The latest technology
development was the introduction of the precalciner in the 1970s, which reduced
energy needs further, while boosting productivity when rebuilding existing kilns.
2.2.3. ROTARY KILNS In industrialized countries, the ground raw materials are
predominantly processed in rotary kilns. A rotary kiln is a tube with a diame-
ter up to about 6 m. The tube is installed at a horizontal angle of 3
◦
–4
◦
and rotates
at one to four times per minute. The ground raw material moves down the tube
toward the flame. Different types of rotary kilns are in use in the cement indus-
try. If raw materials contain more than 20% water, wet processing (9–11) can be
preferable (originally, the wet process was the preferred process, as it was easier
to grind and control the composition and size distribution of the particles in a
1 Oct 2001 16:51 AR AR143-11-WOR.tex AR143-11-WOR.SGM ARv2(2001/05/10) P1: GSR
308 WORRELL ET AL.
slurry; the need for the wet process was reduced by the development of improved
homogenization processes). In the wet process, the slurry typically contains 38%
water (range of 24%–48%). The raw materials are then processed in a ball mill
to form slurry (with extra water). Variations exist—e.g., semi wet (moisture con-
tent of 17%–22%) (9) and semi dry (moisture content of 11%–14%), or Lepol
(9, 12–15)—to reduce the fuel consumption in the kiln. The moisture content in
the (dried) feed of the dry kiln is typically around 0.5% (0%–0.7%). The dry kiln
can be equipped with (multistage) preheaters and a precalciner. Introduction of
a preheater reduces the energy requirement of the burning process. A preheater
that is especially applicable to the dry process is the suspension preheater (9, 11).
Another preheater is the grate preheater, mainly used in semi wet, semi dry, Lepol,
and older dry kilns. Pellets or briquettes are placed on a grate that travels through
a closed tunnel. Additionally, a precalciner can be integrated between the kiln and
the suspension preheater. This is a chamber with a burner, in which 80%–95%
of the CaCO
3
can be dissociated before entering the kiln. In processing without
precalcination, the decomposition (calcination) of CaCO
3
to CaO and CO
2
takes
place in the kiln. Application of a precalcinator (a) reduces energy consumption
(16–20), (b) reduces the length of the kiln (9), making the kiln less expensive, and
(c) reduces NOx emissions (16, 17).
Cooling of the clinker can be performed in a grate cooler, a tube (rotary) cooler,
or a planetary cooler. In a grate cooler, the clinker is transported on a moving or
reciprocating grate, passedby a flow of air.In a tube orplanetary cooler, theclinker
is cooled in a counter-current air stream. The cooling air serves as combustion air.
The largest part of the energy contained in the clinker is returned to the kiln in this
way.
The capital costs of cement plants vary for different countries and local con-
ditions. The capital costs of a new green field clinker plant in Canada are esti-
mated at $175–250 (Canadian) per 1-t capacity (12). The operating costs vary
widely because of the differences in labor costs, age, and plant type. An over-
view of US cement plants estimates the average operating costs at $36.4 (US)
per t of cement in 1990, including costs for power, fuel, and raw materials
(13).
If excess alkali, chlorides, or sulphur are present in the kiln feed and/or fuel,
these might vaporize in the kiln and condense in the preheater. This can lead to
operating problems and altered cement-setting behavior. There is a higher demand
for low alkali cements in the United States and Canada than in Europe (12). In
the case of the preheater/precalciner kilns, alkali-rich material must be extracted
by means of a bypass, which diverts part of the exhaust gas flow and removes the
particulates from it for disposal, increasing heat losses (8).
2.2.4. SHAFT KILN Shaft kilns are used in countries with a lack of infrastruc-
ture to transport raw materials or cement, or for the production of speci-
alty cements (21). Today, most vertical shaft kilns can be found in China and
India, where the lack of infrastructure, lack of capital, and power shortages
1 Oct 2001 16:51 AR AR143-11-WOR.tex AR143-11-WOR.SGM ARv2(2001/05/10) P1: GSR
GLOBAL CEMENT INDUSTRY 309
favored the use of small-scale local cement plants. In China, this is also the
consequence of the industrial development pattern, where local township and
village enterprises were engines of rural industrialization, which led to a substan-
tial share of shaft kilns in the total cement production. Regional industrialization
policies in India also favored the use of shaft kilns other than the large rotary
kilns in major cement-producing areas. In India, shaft kilns represent a growing
part of total cement production and established almost 10% of the 1996 produc-
tion capacity (22). In China, the share is even higher, with an estimated 87%
of the output in 1995 (23). Typical capacities of shaft kilns vary between 30 t
(fully hand operated) and 180 t (mechanized) of clinker per day (24). Shaft kilns
may produce a poor-quality clinker, as it is more difficult to manage all process
parameters.
The principle of all shaft kilns is similar, although design characteristics may
vary. The pelletized material travels from top to bottom, through the same zones as
inarotarykiln.Thekilnheightisdeterminedbythetimeneededfortherawmaterial
to travel through the zones, and by operational procedures, pellet composition, and
air blown (24). Shaft kilns can reach a reasonable efficiency through efficient heat
exchange between the feed and exhaust gases (11, 24). The largest energy losses
in shaft kilns are due to incomplete combustion, which results in emissions of CO
and volatile organic compounds (VOCs) to the environment.
2.2.5. CEMENT MAKING (FINISH GRINDING) Grinding of cement clinker together
with additives to control the properties of the cement (e.g., fly ash, blast furnace
slag, pozzolana, gypsum, and anhydrite) can be done in ball mills, roller mills,
or roller presses. Combinations of these milling techniques are often applied (see
Table 2). Coarse material is separated in a classifier to be returned for additional
grinding. Power consumption for grinding depends strongly on the fineness re-
quired for the final product and the additives used (12, 25–28). The fineness of the
cement influences the cement properties and setting time.
2.3. Energy Use in Cement Making
The theoretical energy consumption for producing cement can be calculated based
on the enthalpy of formation of 1 kg of Portland cement clinker, which is about
1.76 MJ (10). This calculation refers to reactants and products at 25
◦
C and
0.101 MPa. In addition to the theoretical minimum heat requirements, energy
is required to evaporate water and to compensate for the heat losses. Heat is lost
from the plant by radiation or convection and, with clinker, emitted kiln dust and
exit gases leaving the process. Hence, in practice, energy consumption is higher.
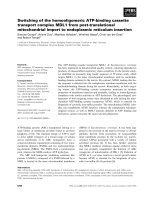
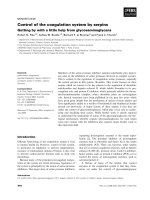
The kiln is the major energy user in the cement-making process. Energy use in the
kiln basically depends on the moisture content of the raw meal. Figure 2 provides
an overview of the heat requirements of different kiln types (7). Most electricity
is consumed in the grinding of the raw materials and finished cement. Power con-
sumption for a rotary kiln is comparatively small, and generally around 17 and
1 Oct 2001 16:51 AR AR143-11-WOR.tex AR143-11-WOR.SGM ARv2(2001/05/10) P1: GSR
310 WORRELL ET AL.
TABLE 2 Energy consumption in cement making processes and process types
a
Fuel use Electricity use Primary energy
Process step (GJ/t of product) (kWh/t of product) (GJ/t of cement)
Crushing
Jaw crusher 0.3–1.4 0.02
Gyratory crusher 0.3–0.7 0.02
Roller crusher 0.4–0.5 0.02
Hammer crusher 1.5–1.6 0.03
Impact crusher 0.4–1.0 0.02
Raw meal grinding
Ball mill 22 0.39
Vertical mill 16 0.28
Hybrid systems 18–20 0.32–0.35
Roller Press—integral 12 0.21
Roller 18 0.32
Press—pregrinding
Clinker kiln
Wet 5.9–7.0 25 6.2–7.3
Lepol 3.6 30 3.9
Long dry 4.2 25 4.5
Short dry—suspension 3.3–3.4 22 3.6–3.7
preheating
Short dry—preheater 2.9–3.2 26 3.2–3.5
& precalciner
Shaft 3.7–6.6 N/A 3.7–6.6
Finish grinding
c
Ball mill 55 0.60
Ball mill/separator 47 0.51
Roller press/ball 41 0.45
mill/separator
Roller press/separator/ 39 0.43
ball mill
Roller press/separator 28 0.31
a
Specific energy use is given per unit of throughput in each process. Primary energy is calculated per tonne of cement,
assuming portland cement (containing 95% clinker), including auxiliary power consumption. NA, Not applicable.
b
Primary energy is calculated assuming a net power generation efficiency of 33% (LHV).
c
Assuming grinding of Portland cement (95% clinker, 5% gypsum) at a fineness of 4000 Blaine.
23 kWh/t of clinker (including the cooler and preheater fans) (9). Additional
power is consumed for conveyor belts and packing of cement. Total power use for
auxiliaries is estimated at roughly 10 kWh/t of clinker (9, 14). Table 2 summarizes
the typical energy consumption for the different processing steps and processes
used.
1 Oct 2001 16:51 AR AR143-11-WOR.tex AR143-11-WOR.SGM ARv2(2001/05/10) P1: GSR
GLOBAL CEMENT INDUSTRY 311
Figure 2 Energy consumption and losses in the major kiln types: Long wet, wet
process; Lepol or semi-wet; long dry; Dry-SP, dry process with four-stage suspension
preheating; and Dry-PC/SP, dry process with four-stage suspension preheating and
precalcining. [Based on data by Van der Vleuten (11).]
3. CEMENT PRODUCTION TRENDS
Global cement production grew from 594 Mt in 1970 to 1453 Mt in 1995 at an
average annual rate of 3.6% (5). Cement consumption and production is cyclical,
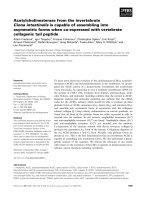
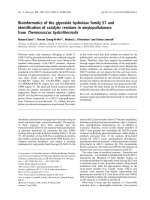
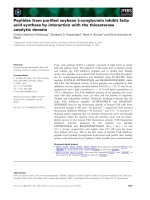
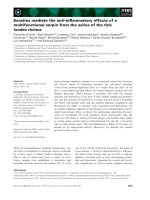
concurrent with business cycles. Historical production trends for 10 world re-
gions are provided in Figure 3. Figure 4 shows production trends in the 10 largest
cement-producing countries from 1970 to 1995. The regions with the largest pro-
duction levels in 1995 were China (including Hong Kong), Europe, Organization
for Economic Cooperation and Development (OECD)-Pacific, rest-of-Asia, and
the Middle East.
As a region, China (including Hong Kong) clearly dominates current world
cement production, manufacturing 477 Mt in 1995, more thantwice as much as the
next-largest region. Cement production in China increased dramatically between
1970 and 1995, growing from 27 Mt to 475 Mt, at an average annual growth
rate of 12.2%. See Table 3. Following rapid growth during the period 1970–1987,
1 Oct 2001 16:51 AR AR143-11-WOR.tex AR143-11-WOR.SGM ARv2(2001/05/10) P1: GSR
312 WORRELL ET AL.
Figure 3 Historical production trends for cement production in 10 regions in the world.
1 Oct 2001 16:51 AR AR143-11-WOR.tex AR143-11-WOR.SGM ARv2(2001/05/10) P1: GSR
GLOBAL CEMENT INDUSTRY 313
Figure4 1970-1995 cement production trends in the 10 largest cement-producing countries in 1995 (Chinaonlyon left-
hand axis).
1 Oct 2001 16:51 AR AR143-11-WOR.tex AR143-11-WOR.SGM ARv2(2001/05/10) P1: GSR
314 WORRELL ET AL.
TABLE 3 Cement production trends and average annual growth rates for major world regions
and 20 largest cement-producing countries, 1970–1995 (5)
Cement production Average annual growth
1970 1975 1980 1985 1990 1995 1970–1995 1990–1995
Region/country Mt Mt Mt Mt Mt Mt % %
China 26.90 47.48 81.49 147.79 211.15 476.91 12.2% 17.7%
China (excluding 26.50 46.90 80.00 145.96 209.70 475.00 12.2% 17.8%
Hong Kong)
Europe 184.61 194.22 223.28 178.04 196.47 180.62 −0.1% −1.7%
Italy 33.13 34.63 41.93 37.36 40.86 34.21 0.1% −3.5%
Germany 37.48 32.98 33.14 22.95 27.71 33.30 −0.5% 3.7%
Spain 16.54 24.40 39.63 24.20 28.66 28.49 2.2% −0.1%
France 29.33 30.66 30.56 23.55 27.05 20.70 −1.4% −5.2%
OECD-Pacific 68.51 82.55 113.12 99.92 125.79 154.07 3.3% 4.1%
Japan 57.26 66.33 91.15 72.56 84.46 90.59 1.9% 1.4%
South Korea 5.82 10.13 15.57 20.50 33.58 55.13 9.4% 10.4%
Rest of Asia 20.08 30.55 48.77 57.16 88.67 130.09 7.8% 8.0%
Thailand 2.63 3.99 5.30 7.91 18.04 33.65 10.7% 13.3%
Indonesia 0.56 1.09 5.83 9.61 15.78 23.25 16.1% 8.1%
Taiwan 4.54 6.80 14.06 13.56 18.40 22.41 6.6% 4.0%
Middle East 19.31 29.28 44.25 74.85 92.76 116.29 7.4% 4.6%
Turkey 6.37 10.89 13.01 17.67 25.38 34.75 7.0% 6.5%
Egypt 3.69 3.59 3.11 5.28 15.15 17.22 6.4% 2.6%
Iran 2.58 5.00 8.00 12.46 15.06 16.85 7.8% 2.3%
Saudi Arabia 0.67 1.13 2.91 9.85 11.49 15.77 13.5% 6.5%
Latin America 35.62 52.46 75.57 71.25 82.44 97.28 4.1% 3.4%
Brazil 9.00 16.74 27.19 20.64 25.85 28.26 4.7% 1.8%
Mexico 7.18 11.61 16.26 20.68 23.83 24.20 5.0% 0.3%
Eastern Europe/ 134.13 177.23 189.53 189.62 189.71 96.25 −1.3% −12.7%
former Soviet
Union
Former Soviet Union 95.23 122.04 124.80 130.77 137.35 56.05 −2.1% −16.4%
Poland 12.18 18.54 18.44 14.86 12.36 14.65 0.7% 3.5%
North America 76.34 72.69 79.24 80.86 81.04 87.51 0.5% 1.5%
U.S. 69.05 61.82 68.24 70.67 69.95 76.90 0.4% 1.9%
India 13.99 16.21 17.76 31.15 48.90 69.57 6.6% 7.3%
Africa 14.53 19.60 28.36 34.58 38.45 43.94 4.5% 2.7%
World 594.03 722.26 901.36 965.21 1155.72 1452.53 3.6% 4.7%
cement production stabilized from 1988 to 1990 because of a combination of
economic austerity measures, inflation, and political instability. However, cement
production doubled between 1990 and 1994 because of a construction boom (29).
In many respects, China’s cement industry is unique in the large number of plants,
the broad range of ownership types, and the variety of production technologies.
Unlike other heavy industries, cement output is not dominated by a small number
of large “key” enterprises. In 1995, large plants with capacities in excess of 100 kt
per year produced only 28% of the 476 Mt of cement manufactured. By late 1994,
China had over 7500 cement plants spread across the country. Chinese plants tend
to be small, with an average output in the neighborhood of somewhat over 50 kilo
tons per year, about one tenth that of the average plant in the United States.
1 Oct 2001 16:51 AR AR143-11-WOR.tex AR143-11-WOR.SGM ARv2(2001/05/10) P1: GSR
GLOBAL CEMENT INDUSTRY 315
Cement production in the Western Europe region was relatively stable between
1970and 1995,with averageannual growthof−0.1%. In1995, production reached
181 Mt. The largest cement-producing countries in this region are Italy, Germany
(defined as West Germany only to 1990; East and West Germany from 1991 to
1995), Spain, and France (30–32).
In 1995, the OECD-Pacific region produced 154 Mt of cement, predominately
in Japan and South Korea. Average annual growth in this region was 3.3% be-
tween 1970 and 1995. Cement production in Japan grew from 57 Mt in 1970
to 91 Mt in 1995 (31, 33). South Korean cement production grew at the high
rate of 9.4% per year between 1970 and 1995. See Table 3. Much of the growth
in cement demand since 1993 was the result of a government economic devel-
opment plan that encouraged both public and private infrastructure investments
(34).
The rest-of-Asia region experienced a high average annual growth of 7.7%
between 1970 and 1995, jumping from production of 20 Mt of cement in 1970
to 130 Mt in 1995. The largest producing countries in this region are Thailand,
Indonesia, and Taiwan (31, 35). Thailand is currently operating the world’s largest
cement kilns.
Production of cementin the Middle East region also grew rapidly between1970
and1995,averaging7.4%peryear. Growthinproductionslowedslightlybeginning
in 1990, averaging 4.6% per year through 1995. The largest cement-producing
countries in this region are Turkey, Egypt, Iran, and Saudi Arabia (31, 36).
BrazilandMexicodominateproduction ofcementintheLatin American region;
together they are responsible for 54% of the production in this region. Brazil
experiencedrapidgrowthincementproductionbetween 1970and1980,whereasin
thefollowingdecade,Brazilexperiencedaneconomiccrisisandcementproduction
dropped from 27 Mt in 1980 to 19.5 Mt in 1984, climbing slowly back to 28 Mt
in 1995 (31, 37). Mexican cement production grew from 7 Mt in 1970 to 24 Mt in
1995, at an average annual rate of 5.0%.
In the Eastern Europe/former Soviet Union region, cement production grew at
an average rate of 2.3% per year between 1970 and 1988. After the breakup of
the Soviet Union and the major restructuring that began in that region in 1988,
production levels droppedby −12.7%per year on average between 1990 and1995.
Cement productionin the formerSoviet Uniongrew steadilyfrom 95 Mt in 1970to
140 Mt in 1989. After the dissolution of the Union of Soviet Socialist Republics in
the late 1980s, production in the region dropped dramatically, falling to 56 Mt in
1995. Countries of the former Soviet Union with the highest production levels
in 1995 were the Russian Federation (36 Mt), Ukraine (10 Mt), and Uzbekistan
(4 Mt) (38).
Cement production in the North American region was relatively stable between
1970 and 1995, growing only 0.5% per year on average. See Table 3. Recent
economic growth has led to increased cement demand. Production of cement in
the United States fluctuated between 58 Mt and 78 Mt, with large drops following
the oil price shocks in 1973 and 1979 (31, 39).
1 Oct 2001 16:51 AR AR143-11-WOR.tex AR143-11-WOR.SGM ARv2(2001/05/10) P1: GSR
316 WORRELL ET AL.
In the Indian region, cement production in India grew from 14 Mt to 70 Mt
between 1970 and 1995, at an average annual rate of 6.6%. Growth in produc-
tion was slower, averaging 3.3% per year, between 1970 and 1982. Currently,
the Indian cement industry is the fourth largest cement producer in the world. In
1982, the Indian government began to deregulate the cement industry, allowing
companies to establish prices and production volumes (40, 41). As a result, pro-
duction levels tripled between 1982 and 1995 and average growth reached almost
10% per year.
The African region showed relatively high growth between 1970 and 1995,
jumping from 14.5 Mt to 44 Mt at an average annual rate of 4.5%. This growth
appears to have slowed recently, increasing an average of 2.7% per year between
1990 and 1995. The largest cement-producing African countries are South Africa,
Algeria, and Morocco, although none isamong the top 20cement-producing coun-
tries worldwide.
4. GLOBAL CARBON DIOXIDE EMISSIONS
FROM CEMENT MAKING
Carbon dioxide emissions in cement manufacturing come directly from combus-
tion of fossil fuels and from calcining the limestone in the raw mix. An indi-
rect and significantly smaller source of CO
2
is from consumption of electric-
ity, assuming that the electricity is generated from fossil fuels. Roughly half
of the emitted CO
2
originates from combustion of the fuel and half originates
from the conversion of the raw material. Not accounted for are the CO
2
emis-
sions attributable to mobile equipment used for mining of raw material, used
for transport of raw material and cement, and used on the plant site. Current
emission estimates for the cement industry are based solely on the assumed
clinker production (derived from cement production assuming Portland cement)
and exclude emissions due to energy use. Emissions from energy use are in-
cluded in the estimates for emissions from energy use, and not allocated to cement
making.
We provide an overall estimate of total CO
2
emissions based on production
trends and energy use. Because of the difficulty of data collection (especially for
clinker production), we have only estimated the emissions for the year 1994. This
estimate is based on current, publicly available data for the cement sector (42–57).
CO
2
emissions were calculated in several steps. First, the top 27 cement-producing
countries, accounting for 83% of cement production in 1994, were identified ac-
cording to 10 regional groupings [Africa, Latin America, North America, Eastern
Europe and the former Soviet Union, Europe, India, China, OECD Pacific, other-
Asia, Middle East]. These key countries formed the basis of our global estimate.
The remaining 132 countries were grouped within the rest of each region (e.g.,
“rest-of-Africa”).
1 Oct 2001 16:51 AR AR143-11-WOR.tex AR143-11-WOR.SGM ARv2(2001/05/10) P1: GSR
GLOBAL CEMENT INDUSTRY 317
4.1. Carbon Dioxide Emissions from Calcination
Process CO
2
is formed by calcining, which can be expressed by the following
equation:
CaCO
3
→ CaO + CO
2
1kg 0.56 kg + 0.44 kg.
The share of CaO in clinker amounts to 64%–67%. The remainder consists of
silicon oxides, iron oxides, and aluminum oxides. Therefore, CO
2
emissions from
clinker production amount to about 0.5 kg/kg. The specific process CO
2
emission
per tonne of cement depends on the ratio of clinker to cement. This ratio varies
normally from 0.5 to 0.95.
We estimated the amount of clinker produced in the key countries in order
to calculate process CO
2
emissions associated with clinker production. For the
process emissions, a calcination factor of 0.136 Mt of carbon (MtC)/t of clinker
(0.5 Mt of CO
2
/t of clinker) (1 Mt of CO
2
= 0.27 MtC = 0.27 Tg of C) was
applied to each metric ton of clinker produced. Actual clinker production data
were collected for Brazil, Mexico, the United States, Canada, Germany, India,
China, Japan, and Korea (29, 41–44). For other key countries, clinker produc-
tion was estimated by referring to data from previous years or by assuming
that clinker capacity utilization for 1994 was the same as cement utilization ca-
pacity calculated from Cembureau statistics (45,46). For those non-key coun-
tries for which no specific clinker production data were available, we used an
estimated average for the clinker/cement (C/C) ratio. We divided the countries
into industrialized countries and rest-of-world and into two groupings for C/C
ratio—84% for industrialized countries and 87% for rest-of-world—based on
a weighted average of actual clinker to cement ratio data collected for key
countries.
4.2. Carbon Dioxide Emissions from Fuel Use
Practically all fuel is used during pyro-processing: Fuel is burned in the kiln. The
amount of CO
2
emitted during this process is influenced by the type of fuel used
(coal, fuel oil, natural gas, petroleum coke, alternative fuels). CO
2
emission fac-
tors (EF
CO
2
) of fuels are based on emission factors defined by the Intergovernment
Panel on Climate Change (47). The direct EF
CO2
of waste fuels is considered
to be zero, because the input of waste replaces an equivalent amount of fossil
fuel–derived energy, and the CO
2
would probably have been released (in the short
or long term) to the atmosphere without useful application of the energy con-
tent. If the waste is used in competition with alternative uses, the replacement
of fossil fuel and the avoidance of CO
2
emissions should be considered in more
depth.
To calculate energy-related CO
2
emissions from fossil fuel consumption, we
first reviewed 1994 data on the average specific fuel consumption per tonne
1 Oct 2001 16:51 AR AR143-11-WOR.tex AR143-11-WOR.SGM ARv2(2001/05/10) P1: GSR
318 WORRELL ET AL.
of clinker (gigajoules per tonne) for key countries, or for the closest year to
1994 for which there was available data. Actual intensity data for industrialized
countries were collected for Canada, Germany, France, Italy, Japan, Korea, Spain,
Turkey, and the United States (9, 42–44,46, 48–50). Available fuel intensity data
for developing countries and for Eastern Europe and the former Soviet Union
included that from Argentina, Brazil, China, Columbia, Egypt, India, Mexico,
Poland, and Venezuela (11, 29,51–54). For other key countries (Morocco, South
Africa, Ukraine, Thailand, Taiwan, Indonesia, Saudi Arabia, and Iran), we used
Cembureau statistics and calculated the share of wet and dry kiln technology per
country. We then applied an intensity factor of 5.9 GJ/t of clinker for wet kilns and
3.5 GJ/t of clinker for dry kilns to calculate weighted fuel intensity for these coun-
tries. For countries where fuel intensity data were not available, we sorted them
into two groupings—industrialized countries and rest-of-the-world—and applied
an average weighted fuel intensity (based on actual key country data collected) of
3.5 GJ/t of clinker for industrialized countries and 4.2 GJ/t of clinker for rest-of-
world countries. We then used national statistics and Cembureau data to calculate
weighted carbon emissions factor of fossil fuel inputs (47) for cement produc-
tion by country. A weighted fuel carbon emission factor was calculated for the
rest-of-region grouping.
4.3. Carbon Dioxide Emissions from Electricity Use
The final step for estimating CO
2
emissions was to calculate emissions from
electricity consumption. Specific electricity consumption data was reviewed for
the same key industrialized and developing countries as was collected for fuel
consumption data (Canada, Germany, France, Italy, Japan, Korea, Spain, Turkey,
United States, Argentina, Brazil, China, Columbia, Egypt, India, Mexico, Poland,
and Venezuela). Forall other countries andregional groupings,electricity intensity
for all kilns was estimated at 0.3 GJ/t of cement for industrialized countries and
0.4 GJ/t of cement for rest-of-the-world. International Energy Agency statistics
were used to calculate the average carbon intensity of fuel inputs for public elec-
tricity generation for each country and regional grouping (55).
4.4. Total Carbon Dioxide Emissions from Cement Production
Estimated carbon emissions from cement production in 1994 were 307 MtC,
160 MtC from process carbon emissions and 147 MtC from energy use. These
emissions account for 5.0% of 1994 world carbon emissions based on a total of
6199 MtC reported by the Carbon Dioxide Information and Analysis Center (56).
Table 4 and Figure 5 provide CO
2
emissions estimates (in million metric tons of
carbon) by key cement-producing countries and regions. Of the countries shown,
China accounts for by far the largest share of total emissions (33.0%), followed
by the United States (6.2%), India (5.1%), Japan (5.1%), and Korea (3.7%). Over-
all, the top 10 cement-producing countries in 1994 accounted for 63% of global
carbon emissions from cement production for that year. Regionally, after China,
1 Oct 2001 16:51 AR AR143-11-WOR.tex AR143-11-WOR.SGM ARv2(2001/05/10) P1: GSR
GLOBAL CEMENT INDUSTRY 319
the largest emitting regions are Europe (11.5%), OECD-Pacific (9.3%), Asian
countries excluding China and India (9.3%), and the Middle East (8.4%). World
average primary energy intensity was 4.8 GJ/t, with the most energy-intensive re-
gions beingEastern Europe andthe former Soviet Union (5.5 GJ/t),North America
(5.4 GJ/t), and the Middle East (5.1 GJ/t).
The average world carbon intensity of carbon emissions in cement production
is 222 kg of C/t of cement. Although China is the largest emitter, the most carbon-
intensivecement regionin termsof carbonemissions pertonne of cementproduced
is India (253 kgC/t), followed by North America (242 kgC/t), and then China
(240 kgC/t). Figure 6 shows the carbon intensity of cement production in various
regions.
5. REDUCTION OF CARBON DIOXIDE EMISSIONS
Many opportunities exist for CO
2
emission reduction in the cement industry. We
provide only a brief review of the wide body of literature.
5.1. Energy Efficiency Improvement
Improvement of energy efficiency reduces the emissions of CO
2
from fuel and
electricity uses and may reduce the costs of producing cement. Improvement may
be attained by using more energy-efficient equipment and by replacing old instal-
lations with new ones or shifting to completely new types of cement production
processes. By far the largest proportion of energy consumed in cement manufac-
ture consists of fuel that is used to heat the kiln. Therefore, the greatest gain in
reducing energy input may come from improved fuel efficiency. In general, the dry
process is more energy efficient than the wet process. The processes are exchange-
able to a large extent, but the applicability may be limited by the raw material
available (i.e., moisture content). The main opportunities in the kiln are the con-
version to more energy-efficient process variants (e.g., from a wet process to a
dry process with preheaters and precalciner), optimization of the clinker cooler,
improvement of preheating efficiency, improved burners as well as process con-
trol and management systems. Electricity use can be reduced through improved
grinding systems, high-efficiency classifiers, high-efficiency motor systems, and
process control systems (57, 58).
Several studies have demonstrated the existence of cost-effective potentials for
energy efficiency improvement in the cement industry. In China, various programs
have developed technologies to improve the efficiency of shaft kilns by increased
mechanization, insulation, bed distribution, and control systems (24). They found
an energy efficiency improvement potential between 10% and 30% for all shaft
kilns. A recent study of the Indian cement industry (59) found a technical potential
for energy efficiency improvement of almost 33% with commercially available
technology. It is estimated that future technologies will bring the energy savings
to almost 48%. This would lead to CO
2
emission reductions of 27%. However,
1 Oct 2001 16:51 AR AR143-11-WOR.tex AR143-11-WOR.SGM ARv2(2001/05/10) P1: GSR
320 WORRELL ET AL.
TABLE 4 Global carbon emissions from cement production, 1994
a
Process Carbon
Cement C/C Primary Primary carbon emission/ Total carbon Share of
production ratio intensity energy emission energy use emission world total
Country Mt % GJ/t PJ MtC MtC MtC %
China 423 83% 5.0 2117 47.7 53.7 101.4 33.0%
Europe 181.9 4.1 749 20.0 15.3 35.3 11.5%
Italy 33.2 80% 4.5 150 3.6 3.2 6.8 2.2%
France 21.2 74% 4.1 88 2.1 1.5 3.6 1.2%
Germany 36.1 79% 3.8 137 3.9 2.8 6.7 2.2%
Spain 26.7 81% 3.9 104 2.9 2.5 5.5 1.8%
Rest-of-Europe 64.7 84% 4.2 271 7.4 5.2 12.5 4.1%
OECD-Pacific 151.3 3.5 533 17.6 11.0 28.6 9.3%
Japan 91.6 80% 3.1 280 9.9 5.7 15.6 5.1%
Korea 51.6 96% 4.3 220 6.7 4.6 11.4 3.7%
Rest of OECD-Pacific 8.0 84% 4.2 34 0.9 0.7 1.6 0.5%
Other-Asia 123.8 4.9 613 15.3 13.3 28.6 9.3%
Thailand 31.1 90% 4.8 148 3.8 3.4 7.2 2.4%
Taiwan 23.2 95% 4.9 114 3.0 2.5 5.5 1.8%
Indonesia 21.9 96% 5.3 115 2.9 2.4 5.3 1.7%
Rest of other-Asia 47.6 87% 4.9 235 5.6 4.9 10.5 3.4%
Middle East 111.2 5.1 563 13.8 12.0 25.8 8.4%
Saudi Arabia 16.0 87% 4.7 75 1.9 1.4 3.3 1.1%
Egypt 16.1 99% 5.8 93 2.2 1.9 4.1 1.3%
Iran 15.9 97% 5.3 84 2.1 1.6 3.7 1.2%
Turkey 31.9 90% 4.9 156 3.9 4.1 8.0 2.6%
Rest-of-Middle-East 31.4 87% 4.9 155 3.7 3.0 6.7 2.2%
-
-
1 Oct 2001 16:51 AR AR143-11-WOR.tex AR143-11-WOR.SGM ARv2(2001/05/10) P1: GSR
GLOBAL CEMENT INDUSTRY 321
North America 88.4 5.4 480 10.6 10.8 21.4 7.0%
US 77.9 88% 5.5 427 9.3 9.6 18.9 6.2%
Canada 10.5 88% 5.1 53 1.3 1.2 2.5 0.8%
EE/FSU 100.7 5.5 558 11.4 10.3 21.7 7.1%
Poland 14.9 82% 5.6 83 1.7 2.1 3.8 1.2%
Ukraine 11.4 80% 6.0 68 1.3 1.3 2.6 0.8%
Russia 37.2 80% 6.0 223 4.1 3.8 7.8 2.5%
Rest-of-EE/FSU 37.1 87% 4.9 183 4.4 3.2 7.6 2.5%
Latin America 97.4 4.7 462 11.2 8.2 19.4 6.3%
Brazil 25.2 77% 4.1 102 2.6 1.7 4.4 1.4%
Mexico 29.8 88% 4.5 133 3.6 2.5 6.0 2.0%
Colombia 8.3 82% 6.1 51 0.9 1.0 2.0 0.6%
Venezuela 7.5 87% 5.7 43 0.9 0.6 1.5 0.5%
Argentina 6.3 90% 5.3 33 0.8 0.5 1.3 0.4%
Rest-of-Latin-America 20.2 87% 4.9 100 2.4 1.9 4.2 1.4%
India 62.4 89% 5.0 309 7.6 8.2 15.8 5.1%
Africa 41.0 4.9 201 4.9 4.2 9.0 2.9%
Morocco 6.3 85% 4.8 30 0.7 0.8 1.5 0.5%
South Africa 7.9 90% 4.9 39 1.0 1.0 1.9 0.6%
Rest-of-Africa 26.8 87% 4.9 132 3.2 2.4 5.6 1.8%
World total 1380.9 85% 4.8 6585 160 147 307 100%
a
C/C, clinker/cement; OECD; EE/FSU, Eastern Europe/former Soviet Union.
1 Oct 2001 16:51 AR AR143-11-WOR.tex AR143-11-WOR.SGM ARv2(2001/05/10) P1: GSR
322 WORRELL ET AL.
Figure 5 Share of carbon emissions from cement production by world
region, 1994.
the economic potential for energy efficiency improvement is estimated at 24%
of total primary energy use (using a discount rate of 30%). Martin et al. (58)
studied the energy efficiency opportunities in the US cement industry in detail.
Focusingon commerciallyavailabletechnology, theyidentified 29energy-efficient
technologies that could still be adopted to some extent by the US cement industry.
Together these have a technical potential for energy efficiency improvement of
40%.However,theeconomicpotential(usingadiscountrateof30%)isestimatedat
only11%becauseofthehigh capital costsandlowenergycostsintheUnitedStates.
This limits the CO
2
emission reduction potential to only 5%. If the US cement
industry would increase its use of blended cement (see below), the economic
potential might increase to 18%, reducing total CO
2
emissions by 16%.
5.2. Replacing High-Carbon Fuels with Low-Carbon Fuels
One option for lowering CO
2
emissions is to reduce the carbon content of the
fuel, e.g., shifting from coal to natural gas. An important opportunity to reduce
the long-cycle carbon emission is the application of waste-derived alterna-
tive fuels. This could at the same time diminish the disposal of waste material and
1 Oct 2001 16:51 AR AR143-11-WOR.tex AR143-11-WOR.SGM ARv2(2001/05/10) P1: GSR
GLOBAL CEMENT INDUSTRY 323
Figure 6 Carbon intensity of cement production in different regions (tonnes of carbon per tonne of cement).
1 Oct 2001 16:51 AR AR143-11-WOR.tex AR143-11-WOR.SGM ARv2(2001/05/10) P1: GSR
324 WORRELL ET AL.
reduce the use of fossil fuels. A number of issues should be considered when
using waste-derived fuels: (a) energy efficiency of waste combustion in cement
kilns; (b) constant cement product and fuel quality; (c) emissions to atmosphere;
(d) trace elements and heavy metals; (e) alternative fate of waste; and ( f ) produc-
tion of secondary waste. Disadvantages may be the adverse effects on the cement
quality and increased emission of harmful gases. It should be noted that emissions
generallydependmoreonkilnoperationconditionsthanontypeoffuel. Alternative
fuels may be gaseous (e.g., landfill gas), liquid (e.g., halogen-free spent solvents,
distillation residues, waste oils), or solid (e.g., waste wood, dried sewage sludge,
plastics, tires). The net emission reduction depends on the nature and characteris-
tics of the wastes, as well as on the waste-treatment process that is displaced (57).
Waste processing in the cement industries is feasible and is a current prac-
tice. Waste as alternative fuel is increasingly used in cement plants. In 1990, the
European cement industry used between 0.75 Mt and 1 Mt per year of alternative
fuels, equivalent to 25–35 PJ. In 1993, 9% of the thermal energy consumption
in the European cement industry originated from alternative fuels. Waste may re-
duce CO
2
emissions by 0.1–0.5 kg/kg of cement produced compared with current
production techniques using fossil fuels. The use of waste generates no additional
emissions, although care should be taken for highly volatile elements like mercury
and thallium (57).
5.3. Blended Cements
The production of clinker is the most energy-intensive step in the cement manu-
facturing process and causes large process emissions of CO
2
. In blended cement,
a portion of the clinker is replaced with industrial by-products, such as coal
fly ash (a residue from coal burning), blast furnace slag (a residue from iron-
making), or other pozzolanic materials (e.g., volcanic material). These products
are blended with the ground clinker to produce a homogenous product: blended
cement. Blendedcement hasdifferentproperties thanPortland cement,e.g., setting
takes longer but ultimate strength is higher (60).
The current application of additives in cement making varies widely by coun-
try and region (see Table 4). Although the use of blended cements is common in
Europe, it is less common elsewhere, e.g., in North America. The relative impor-
tance of additive use can be expressed by the C/C ratio of the cement production in
a specific country. Portland cement has a C/C ratio of 0.95, whereas blast furnace
slag cement may have a C/C ratio as low as 0.35. Countries such as the United
States, Canada,and UnitedKingdom have high C/C ratios,showingthe dominance
of Portland cement, whereas countries such as Belgium, France, and the former
SovietUnion show lowerC/C ratios, expressingthe relativelylarger useof blended
cements (45). Because no international sources collect clinker production data, it
is not possible to accurately estimate the current practices in all cement-producing
countries. In Table 4 we have used a regional estimate on the basis of information
of key countries. The major barriers to further application of blended cements do
1 Oct 2001 16:51 AR AR143-11-WOR.tex AR143-11-WOR.SGM ARv2(2001/05/10) P1: GSR
GLOBAL CEMENT INDUSTRY 325
not seem tobe supply or environmental issuesbut ratherexisting product standards
and specifications as well as building codes (57).
The future potential for application of blended cements depends on the current
application level, on the availability of blending materials, and on standards and
legislative requirements. The global potential for CO
2
emission reduction through
producing blended cement is estimated to be at least 5% of total CO
2
emissions
from cement making (56 Mt of CO
2
) but maybe as high as 20%. The potential sav-
ings will vary by country and by region. Worrell et al. (45) estimated the potential
for carbon emission reduction on a national basis for 24 countries in the OECD,
Eastern Europe, and Latin America. They estimated the minimum availability of
blending materials on the basis of pig iron production and coal combustion. The
potential emission reduction varied between 0% and 29%. The average emission
reduction for all countries (producing 35% of world cement in the reference year
1990) was estimated at 22%. It was negligible for countries with a large share
of blended cement production (e.g., The Netherlands) or with a low availability
of blending materials, i.e., countries without iron production or coal fired power
stations (e.g., Costa Rica, Guatemala). It was high for countries with limited pro-
duction of blended cements and a well-developed industry or fossil-based power
industry (e.g., United Kingdom, United States). The C/C ratio for China was
estimated at 85%. Considering the large iron production and coal use in power
production in China, a large potential for blended cement may also be expected in
the world’s largest cement maker.
The costs of blending materials depend strongly on the transportation costs and
may vary between $15 and $30 (US) per t for fly ash and approximately $24 (US)
per t for blast furnace slag. Shipping costs may increase the price significantly,
depending on distance and shipping mode. The prices are still considerably lower
than the production costs of cement, estimated at approximately $36 (US) per t
(1990) in the United States (57).
Additives such as fly ash contain high concentrations of heavy metals, which
under unfavorable conditions may leach into the environment. No negative
environmental effects of slag and fly ash addition in cement have been found
(57). Only the use of nonferrous slags seems to be limited to slag contents of 15%
by mass. However, fly ash and blast furnace slag may be considered hazardous
wastes under environmental legislation in some countries, limiting the use of fly
ash to specified companies. In the United States, fly ash falls under the Resource
Conservation and Recovery Act and gives the states the jurisdiction to define fly
ash as a hazardous waste. In practice, the state regulation varies greatly across the
United States, which limits the reuse of fly ash.
5.4. Carbon Dioxide Removal
Reduction of CO
2
emissions can be obtained by applying CO
2
removal. In this
technique,CO
2
isseparatedduringorafter the productionprocessandsubsequently
stored or disposed of outside the atmosphere. The CO
2
can be recovered from the
1 Oct 2001 16:51 AR AR143-11-WOR.tex AR143-11-WOR.SGM ARv2(2001/05/10) P1: GSR
326 WORRELL ET AL.
flue gases, originating from the calcination process as well as from the combustion
processes. Typical CO
2
concentrations in the flue gases range from 14% to 33%.
Because of the high share of CO
2
in flue gases originating from the calcination
process (and not from a combustion process), combustion in a CO
2
/O
2
atmosphere
may be suitable to recover the CO
2
. In the CO
2
/O
2
technique, oxygen instead of
air is used for the combustion, i.e., the nitrogen is removed in an air-separation
plant before the fuel is oxidized. A problem is the high stoichiometric combustion
temperatures, which can be solved by recycling produced CO
2
. The CO
2
acts
as a temperature moderator. No practical experiences with this technique have
yet been gained in the cement industry (57). In principle this process could be
applied to the cement-production process. A mixture of oxygen and CO
2
is fed
to the burner in the kiln. In comparison with the production plant without CO
2
removal, a number of aspects need further exploration (i.e., control of leakage of
air into the kiln; cooling of the cement after the kiln; energy balance of the system;
consequence of the higher CO
2
partial pressure on the calcination process; and
control to reduce emission of CO
2
during start/stops of the cement plant). This
technology is currently not cost-effective and needs further research to assess the
technical and commercial applicability (57).
6. CONCLUSIONS
The cement industry is a large contributor to global CO
2
emissions. CO
2
is emitted
from the calcination process of limestone, from combustion of fuels in the kiln,
and from power generation for purchased or self-generated electricity. Estimated
carbon emissions from cement production in 1994 were 307 MtC, 160 MtC from
calcination, and 147 MtC from energy use. These emissions account for 5% of
1994 global anthropogenic CO
2
emissions. Data collection for this effort is labor
intensive, and we recommend that the emissions be reported in future years on a
consistent basis.
China accounts for by far the largest share of total emissions (33%), followed
by the United States (6%), India (5%), Japan (5%), and Korea (4%). Overall, the
top 10 cement-producing countries in 1994 accounted for 63% of global carbon
emissions from cementproduction forthat year. Regionally, after China,the largest
emittingregionsareEurope (12%),OECD-Pacific(9%),Asian countries excluding
China and India (9%), and the Middle East (8%).
World average primary energy intensity was 4.8 GJ/t, with the most energy-
intensive regions being Eastern Europe and the former Soviet Union (5.5 GJ/t),
North America (5.4 GJ/t), and the Middle East (5.1 GJ/t). The average world
carbon intensity of carbon emissions in cement production is 222 kg of C/t
of cement. Although China is the largest emitter, the most carbon-intensive
cement region in terms of carbon emissions per tonne of cement produced is
India (253 kg of C/t), followed by North America (242 kg of C/t), and China
(240 kg of C/t).
1 Oct 2001 16:51 AR AR143-11-WOR.tex AR143-11-WOR.SGM ARv2(2001/05/10) P1: GSR
GLOBAL CEMENT INDUSTRY 327
Emissions of CO
2
can be reduced by improvement of the energy efficiency of
the process, shifting to a more energy-efficient process (e.g., from wet to dry pro-
cess), replacing high-carbon fossil fuels with low-carbon fossil fuels or with alter-
native fuels, and applying lower C/C ratio through production of blended ce-
ments. Production of blended cements seems a promising option to reduce both
fuel- and process-related CO
2
emissions on the short term. In the long term, appli-
cationof alternativecements (mineralpolymers fromkaolin)or theremovalof CO
2
from the flue gases may contribute to further CO
2
emission reductions. Both re-
quire substantial research and development efforts to assess the applicability and
emission-reduction potential. In the short term, energy efficiency improvement,
construction of efficient new kilns, increased production of blended cements, and
increased use of waste fuels are the most cost-effective measures to reduce CO
2
emissions. The economics of a shift to low-carbon fuels depends on the regional
costs of the various fuels.
ACKNOWLEDGMENTS
Part of this work was supported by the Climate Protection Division, Office of
Air and Radiation, US Environmental Protection Agency through the US Depart-
ment of Energy under contract No. DE-AC03-76SF00098, as well as by the Inter-
national Energy Agency’s Greenhouse Gas R&D Programme, Cheltenham, UK.
Many people have been very helpful in the data collection as well as review of
the material on which this article is based. We especially would like to thank
Lars Hjorth (Brussels: Cembureau), Ann Dougherty and Gregg Miller (Portland
CementAssociation, Skokie,IL), and MichaelNisbet (JAN Consultants,Montreal,
Canada). We also would like to thank Dian Phylipsen (now with Ecofys, Utrecht,
The Netherlands) and Bryan Lehman (Lawrence Berkeley National Laboratory,
Berkeley, California) for their help with data collection.
Visit the Annual Reviews home page at www.AnnualReviews.org
LITERATURE CITED
1. World Energy Counc. 1995. Efficient Use
of Energy Utilizing High Technology: An
Assessment of Energy Use in Industry and
Buildings. London: World Energy Counc.
2. Cahn D, Greer W, Moir R. 1997. Atmo-
spheric CO
2
and the US cement industry.
World Cem., Aug:64–68
3. Can. Portland Cem. Assoc. 1997. Cement,
Concrete and Climate Change. Toronto:
Can. Portland Cem. Assoc.
4. Cembureau. 1998. Climate Change, Ce-
ment and the EU. Brussels: Cembureau
5. Cembureau. 1998. World Cement Market
in Figures 1913/1995. World Stat. Rev. No.
18. Brussels: Cembureau
6. Greer W, Johnson MD, Morton EL,
Raught EC, Steuch HE, et al. 1992. Port-
land cement. In Air Pollution Engineering
Manual, ed. AJ Buonicore, WT Davis, pp.
746–66.NewYork:Van Nostrand Reinhold
7. Duda WH. 1985. Cement Data Book: In-
ternational Process Engineering in the Ce-
ment Industry. Wiesbaden, Ger: Bauverlag
Gmbh. 3rd ed.