genetic variation in the immunosuppression pathway genes and breast cancer susceptibility a pooled analysis of 42 510 cases and 40 577 controls from the breast cancer association consortium
Bạn đang xem bản rút gọn của tài liệu. Xem và tải ngay bản đầy đủ của tài liệu tại đây (1.12 MB, 18 trang )
Hum Genet
DOI 10.1007/s00439-015-1616-8
ORIGINAL INVESTIGATION
Genetic variation in the immunosuppression pathway genes
and breast cancer susceptibility: a pooled analysis of 42,510 cases
and 40,577 controls from the Breast Cancer Association
Consortium
Jieping Lei1 • Anja Rudolph1 • Kirsten B. Moysich2 • Sabine Behrens1 • Ellen L. Goode3 • Manjeet K. Bolla4 •
Joe Dennis4 • Alison M. Dunning5 • Douglas F. Easton4,5 • Qin Wang4 • Javier Benitez6,7 • John L. Hopper8 •
Melissa C. Southey9 • Marjanka K. Schmidt10 • Annegien Broeks10 • Peter A. Fasching11,12 • Lothar Haeberle11 •
Julian Peto13 • Isabel dos-Santos-Silva13 • Elinor J. Sawyer14 • Ian Tomlinson15 • Barbara Burwinkel16,17 •
Frederik Marme´16,18 • Pascal Gue´nel19,20 • The´re`se Truong19,20 • Stig E. Bojesen21,22,23 • Henrik Flyger24 •
Sune F. Nielsen22 • Børge G. Nordestgaard22,23 • Anna Gonza´lez-Neira6 • Primitiva Mene´ndez25 •
Hoda Anton-Culver26 • Susan L. Neuhausen27 • Hermann Brenner28,29,30 • Volker Arndt28 • Alfons Meindl31 •
Rita K. Schmutzler32,33,34 • Hiltrud Brauch30,35,36 • Ute Hamann37 • Heli Nevanlinna38 ã Rainer Fagerholm38 ã
Thilo Doărk39 ã Natalia V. Bogdanova40 • Arto Mannermaa41,42,43 • Jaana M. Hartikainen41,42,43 •
Australian Ovarian Study Group44 • kConFab Investigators45 • Laurien Van Dijck46 • Ann Smeets47 •
Dieter Flesch-Janys48,49 • Ursula Eilber1 • Paolo Radice50 • Paolo Peterlongo51 • Fergus J. Couch52 •
Emily Hallberg3 • Graham G. Giles8,53 • Roger L. Milne8,53 • Christopher A. Haiman54 • Fredrick Schumacher54
Jacques Simard55 • Mark S. Goldberg56,57 • Vessela Kristensen58,59,60 • Anne-Lise Borresen-Dale58,59 •
Wei Zheng61 • Alicia Beeghly-Fadiel61 • Robert Winqvist62,63 • Mervi Grip64 • Irene L. Andrulis65,66 •
Gord Glendon65 • Montserrat Garcı´a-Closas67,68 • Jonine Figueroa68 • Kamila Czene69 • Judith S. Brand69 •
Hatef Darabi69 • Mikael Eriksson69 • Per Hall69 • Jingmei Li69 • Angela Cox70 • Simon S. Cross71 •
Paul D. P. Pharoah4,5 • Mitul Shah5 • Maria Kabisch37 • Diana Torres37,72 • Anna Jakubowska73 •
Jan Lubinski73 • Foluso Ademuyiwa74 • Christine B. Ambrosone74 • Anthony Swerdlow75,76 • Michael Jones75 •
Jenny Chang-Claude1,77
•
Received: 30 July 2015 / Accepted: 13 November 2015
Ó The Author(s) 2015. This article is published with open access at Springerlink.com
Abstract Immunosuppression plays a pivotal role in
assisting tumors to evade immune destruction and promoting tumor development. We hypothesized that genetic
variation in the immunosuppression pathway genes may be
implicated in breast cancer tumorigenesis. We included
42,510 female breast cancer cases and 40,577 controls of
European ancestry from 37 studies in the Breast Cancer
Association Consortium (2015) with available genotype
data for 3595 single nucleotide polymorphisms (SNPs) in
133 candidate genes. Associations between genotyped
SNPs and overall breast cancer risk, and secondarily
according to estrogen receptor (ER) status, were assessed
using multiple logistic regression models. Gene-level
associations were assessed based on principal component
Jieping Lei and Anja Rudolph share the first authorship.
Electronic supplementary material The online version of this
article (doi:10.1007/s00439-015-1616-8) contains supplementary
material, which is available to authorized users.
& Jenny Chang-Claude
1
Division of Cancer Epidemiology, German Cancer Research
Center (DKFZ), Im Neuenheimer Feld 581,
69120 Heidelberg, Germany
2
Department of Cancer Prevention and Control, Roswell Park
Cancer Institute, Buffalo, NY, USA
3
Department of Health Sciences Research, Mayo Clinic,
Rochester, MN, USA
123
Hum Genet
analysis. Gene expression analyses were conducted using
RNA sequencing level 3 data from The Cancer Genome
Atlas for 989 breast tumor samples and 113 matched normal tissue samples. SNP rs1905339 (A[G) in the STAT3
region was associated with an increased breast cancer risk
(per allele odds ratio 1.05, 95 % confidence interval
1.03–1.08; p value = 1.4 9 10-6). The association did not
differ significantly by ER status. On the gene level, in
addition to TGFBR2 and CCND1, IL5 and GM-CSF
showed the strongest associations with overall breast cancer risk (p value = 1.0 9 10-3 and 7.0 9 10-3, respectively). Furthermore, STAT3 and IL5 but not GM-CSF were
differentially expressed between breast tumor tissue and
normal tissue (p value = 2.5 9 10-3, 4.5 9 10-4 and
0.63, respectively). Our data provide evidence that the
immunosuppression pathway genes STAT3, IL5, and GMCSF may be novel susceptibility loci for breast cancer in
women of European ancestry.
Abbreviations
BCAC
Breast Cancer Association Consortium
CCND1
Cyclin D1
CI
Confidence interval
COGS
Collaborative Oncological Gene-Environment
Study
4
Centre for Cancer Genetic Epidemiology, Department of
Public Health and Primary Care, University of Cambridge,
Cambridge, UK
5
Centre for Cancer Genetic Epidemiology, Department of
Oncology, University of Cambridge, Cambridge, UK
6
7
8
15
Wellcome Trust Centre for Human Genetics and Oxford
NIHR Biomedical Research Centre, University of Oxford,
Oxford, UK
Human Cancer Genetics Program, Spanish National Cancer
Research Centre, Madrid, Spain
16
Department of Obstetrics and Gynecology, University of
Heidelberg, Heidelberg, Germany
Centro de Investigacio´n en Red de Enfermedades Raras,
Valencia, Spain
17
Molecular Epidemiology Group, German Cancer Research
Center (DKFZ), Heidelberg, Germany
Centre for Epidemiology and Biostatistics, Melbourne School
of Population and Global Health, The University of
Melbourne, Melbourne, Australia
18
National Center for Tumor Diseases, University of
Heidelberg, Heidelberg, Germany
19
Environmental Epidemiology of Cancer, Center for Research
in Epidemiology and Population Health, INSERM, Villejuif,
France
20
University Paris-Sud, Villejuif, France
21
Copenhagen General Population Study, Herlev Hospital,
Copenhagen University Hospital, Herlev, Denmark
22
Department of Clinical Biochemistry, Herlev Hospital,
Copenhagen University Hospital, Herlev, Denmark
23
Faculty of Health and Medical Sciences, University of
Copenhagen, Copenhagen, Denmark
24
Department of Breast Surgery, Herlev Hospital, Copenhagen
University Hospital, Herlev, Denmark
10
Netherlands Cancer Institute, Antoni van Leeuwenhoek
Hospital, Amsterdam, The Netherlands
13
TCGA
TGFBR2
Treg cells
TUBG2
Research Oncology, Guy’s Hospital, King’s College London,
London, UK
Department of Pathology, The University of Melbourne,
Melbourne, Australia
12
EM
ENCODE
eQTL
ER
GWAS
HWE
IL5
LD
MAF
MDSCs
OR
PCs
PTRF
RSEM
SD
SNPs
STAT3
Deoxyribonucleic acid
Granulocyte-macrophage colony stimulating
factor
Estimation maximization
Encyclopedia of DNA elements
Expression quantitative trait loci
Estrogen receptor
Genome-wide association study
Hardy–Weinberg equilibrium
Interleukin 5
Linkage disequilibrium
Minor allele frequency
Myeloid-derived suppressor cells
Odds ratio
Principal components
Polymerase I and transcript release factor
Quantile–quantile
RNA-Seq by expectation-maximization
Standard deviation
Single nucleotide polymorphisms
Signal transducer and activator of
transcription 3
The Cancer Genome Atlas
Transforming growth factor beta receptor II
Regulatory T cells
Tubulin, gamma 2
14
9
11
DNA
GM-CSF
Department of Gynaecology and Obstetrics, University
Hospital Erlangen, Friedrich-Alexander University ErlangenNuremberg, Comprehensive Cancer Center Erlangen-EMN,
Erlangen, Germany
David Geffen School of Medicine, Department of Medicine
Division of Hematology and Oncology, University of
California at Los Angeles, Los Angeles, CA, USA
Department of Non-Communicable Disease Epidemiology,
London School of Hygiene and Tropical Medicine, London,
UK
123
Hum Genet
Breast cancer is the most frequent cancer among women
and the second leading cause of cancer-related death after
lung cancer in Europe. In addition to genetic variants with
high and moderate penetrance, more than 90 common
germline genetic variants contributing to breast cancer risk
have been identified, comprising about 37 % of the familial
relative risk of the disease (Michailidou et al. 2013, 2015).
This suggests that a substantial portion of inherited variation has not yet been identified. In addition, most of the
known common susceptibility variants reside in non-coding
regions and result in subtle regulation of gene expression.
The biological mechanisms through which genetic variants
exert their functions are still not entirely understood.
The ability to evade immune destruction has been
increasingly recognized as a key hallmark of tumors
(Hanahan and Weinberg 2011). Tumor cells may secrete
immunosuppressive factors like TGF-b which hampers
infiltrating cytotoxic T lymphocytes and natural killer cells
(Yang et al. 2010). Inflammatory cells like regulatory T
cells (Treg cells), a subset of CD4? T lymphocytes, as well
as myeloid-derived suppressor cells (MDSCs) may be
recruited into the tumor environment, which are actively
immunosuppressive (Lindau et al. 2013; Reisfeld 2013).
Higher prevalence of Treg cells has been found in various
cancers (Chang et al. 2010; Michel et al. 2008; Watanabe
et al. 2002), including breast cancer (Bates et al. 2006).
There is evidence that tumor infiltrating Treg cells endowed
with immunosuppressive potential are associated with
tumor progression and unfavorable prognosis, especially in
estrogen receptor (ER)-negative breast cancer (Bates et al.
2006; Kim et al. 2013; Liu et al. 2012a). In addition, infiltrating MDSCs were also found in murine mammary tumor
models (Aliper et al. 2014; Gad et al. 2014), but their relevance for breast cancer patients also in terms of prognosis
is not well-understood. Furthermore, previous association
studies have identified susceptibility alleles for breast cancer in two genes, TGFBR2 (transforming growth factor beta
receptor II) (Michailidou et al. 2013) and CCND1 (cyclin
D1) (French et al. 2013), which may be involved in immune
regulation in cancer patients (Gabrilovich and Nagaraj
2009; Krieg and Boyman 2009), including those with breast
cancer. We hypothesized that immunosuppression pathway
genes, particularly those relevant to Treg cell and MDSC
functions, may harbor further susceptibility variants associated with breast cancer tumorigenesis, with a possible
differential association by ER status.
In this analysis, we investigated associations between
breast cancer risk and single nucleotide polymorphisms
(SNPs) in 133 candidate genes in the immunosuppression
pathway in individual level data from the Breast Cancer
Association Consortium (BCAC). We also assessed associations with breast cancer risk at the gene and pathway
25
Servicio de Anatomı´a Patolo´gica, Hospital Monte Naranco,
Oviedo, Spain
37
Molecular Genetics of Breast Cancer, German Cancer
Research Center (DKFZ), Heidelberg, Germany
26
Department of Epidemiology, University of California Irvine,
Irvine, CA, USA
38
Department of Obstetrics and Gynecology, Helsinki
University Hospital, University of Helsinki, Helsinki, Finland
Beckman Research Institute of City of Hope, Duarte, CA,
USA
39
Gynaecology Research Unit, Hannover Medical School,
Hannover, Germany
Division of Clinical Epidemiology and Aging Research,
German Cancer Research Center (DKFZ), Heidelberg,
Germany
40
Department of Radiation Oncology, Hannover Medical
School, Hannover, Germany
41
Cancer Center, Kuopio University Hospital, Kuopio, Finland
42
Institute of Clinical Medicine, Pathology and Forensic
Medicine, University of Eastern Finland, Kuopio, Finland
43
Imaging Center, Department of Clinical Pathology, Kuopio
University Hospital, Kuopio, Finland
44
Department of Genetics, QIMR Berghofer Medical Research
Institute, Brisbane, QLD, Australia
45
The Peter MacCallum Cancer Centre, Melbourne, VIC,
Australia
46
VIB Vesalius Research Center, Department of Oncology,
University of Leuven, Leuven, Belgium
47
Multidisciplinary Breast Center, University Hospitals
Leuven, University of Leuven, Leuven, Belgium
48
Institute for Medical Biometrics and Epidemiology,
University Medical Center Hamburg-Eppendorf, Hamburg,
Germany
Introduction
27
28
29
Division of Preventive Oncology, National Center for Tumor
Diseases (NCT) and German Cancer Research Center
(DKFZ), Heidelberg, Germany
30
German Cancer Consortium (DKTK), German Cancer
Research Center (DKFZ), Heidelberg, Germany
31
Division of Gynaecology and Obstetrics, Technische
Universitaăt Muănchen, Munich, Germany
32
Center for Hereditary Breast and Ovarian Cancer, University
Hospital of Cologne, Cologne, Germany
33
Center for Integrated Oncology (CIO), University Hospital of
Cologne, Cologne, Germany
34
Center for Molecular Medicine Cologne (CMMC),
University of Cologne, Cologne, Germany
35
Dr. Margarete Fischer-Bosch-Institute of Clinical
Pharmacology Stuttgart, Stuttgart, Germany
36
University of Tuăbingen, Tuăbingen, Germany
123
Hum Genet
levels. Furthermore, we used publicly available datasets
through the UCSC Genome Browser (2015) to examine the
putative genetic susceptibility loci for potential regulatory
function.
Materials and methods
Study participants
In this analysis, participants were restricted to 83,087
women of European ancestry from 37 case–control studies
participating in BCAC, including 42,510 invasive breast
cancer cases with stage I–III disease and 40,577 cancerfree controls. Of all breast cancer patients, 26,094 were
known to have ER-positive disease and 6870 to have ERnegative disease. Details of included studies are summarized in Online Resource 1. All studies were approved by
the relevant ethics committees and all participants gave
informed consent (Michailidou et al. 2013).
Ostrand-Rosenberg 2008; Poschke et al. 2011; Sakaguchi
et al. 2013; Sica et al. 2008; Wilczynski and Duechler
2010; Zitvogel et al. 2006; Zou 2005), using the search
terms
‘‘immunosuppression’’/‘‘immunosuppressive’’,
‘‘regulatory T cells’’/‘‘Treg cells’’/‘‘FOXP3? T cells’’,
‘‘myeloid derived suppressor cells’’/‘‘MDSCs’’, ‘‘immunosurveillance’’, and ‘‘tumor escape’’. The final candidate gene list included 133 immunosuppression-related
genes (Online Resource 2). SNPs within 50 kb upstream
and downstream of each gene were identified using HapMap CEU genotype data (2015) and dbSNP 126.
SNP association analyses
Candidate genes relevant to the Treg cell and MDSC
pathways were identified through a comprehensive literature review in PubMed (DeNardo et al. 2010; DeNardo and
Coussens 2007; Driessens et al. 2009; Gabrilovich and
Nagaraj 2009; Krieg and Boyman 2009; Mills 2004;
For the BCAC studies, genotyping was carried out using a
custom Illumina iSelect array (iCOGS) designed for the
Collaborative Oncological Gene-Environment Study
(COGS) project (Michailidou et al. 2013). Of the 211,155
SNPs on the array, 4246 were located within 50 kb of the
selected candidate genes. Centralized quality control of
genotype data led to the exclusion of 651 SNPs. The
exclusion criteria included a call rate less than 95 % in all
samples genotyped with iCOGS, minor allele frequency
(MAF) less than 0.05 in all samples, evidence of deviation
from Hardy–Weinberg equilibrium (HWE) at p value
\10-7, and concordance in duplicate samples less than
98 % (Michailidou et al. 2013). A total of 3595 SNPs
passed all quality controls and was analyzed.
49
Department of Cancer Epidemiology, Clinical Cancer
Registry, University Medical Center Hamburg-Eppendorf,
Hamburg, Germany
59
K.G. Jebsen Center for Breast Cancer Research, Institute of
Clinical Medicine, Faculty of Medicine, University of Oslo,
Oslo, Norway
50
Unit of Molecular Bases of Genetic Risk and Genetic
Testing, Department of Preventive and Predictive Medicine,
Fondazione IRCCS (Istituto Di Ricovero e Cura a Carattere
Scientifico) Istituto Nazionale dei Tumori (INT), Milan, Italy
60
Department of Clinical Molecular Biology, Oslo University
Hospital, University of Oslo, Oslo, Norway
61
Division of Epidemiology, Department of Medicine,
Vanderbilt-Ingram Cancer Center, Vanderbilt University
School of Medicine, Nashville, TN, USA
62
Laboratory of Cancer Genetics and Tumor Biology,
Department of Clinical Chemistry and Biocenter Oulu,
University of Oulu, Oulu, Finland
Candidate gene selection
51
IFOM, Fondazione Istituto FIRC (Italian Foundation of
Cancer Research) di Oncologia Molecolare, Milan, Italy
52
Department of Laboratory Medicine and Pathology, Mayo
Clinic, Rochester, MN, USA
53
Cancer Epidemiology Centre, Cancer Council Victoria,
Melbourne, Australia
63
Central Finland Hospital District, Jyvaăskylaă Central Hospital,
Jyvaăskylaă, Finland
54
Department of Preventive Medicine, Keck School of
Medicine, University of Southern California, Los Angeles,
CA, USA
64
Department of Surgery, Oulu University Hospital, University
of Oulu, Oulu, Finland
65
55
Genomics Center, Centre Hospitalier Universitaire de
Que´bec Research Center, Laval University, Que´bec City,
Canada
Lunenfeld-Tanenbaum Research Institute of Mount Sinai
Hospital, Toronto, Canada
66
Department of Medicine, McGill University, Montreal,
Canada
Department of Molecular Genetics, University of Toronto,
Toronto, Canada
67
Division of Clinical Epidemiology, Royal Victoria Hospital,
McGill University, Montreal, Canada
Division of Genetics and Epidemiology, The Institute of
Cancer Research, London, UK
68
Division of Cancer Epidemiology and Genetics, National
Cancer Institute, Rockville, MD, USA
56
57
58
Department of Genetics, Institute for Cancer Research, Oslo
University Hospital Radiumhospitalet, Oslo, Norway
123
Hum Genet
Per-allele associations with the number of minor alleles
were assessed using multiple logistic regression models,
adjusted for study, age (at diagnosis for cases or at
recruitment for controls) and nine principal components
(PCs) derived based on genotyped variants to account for
European population substructure. We assessed the associations of SNPs with overall breast cancer risk as primary
analyses, and then restricted to ER-positive (26,094 cases
and 40,577 controls) and ER-negative subtypes (6870 cases
and 40,577 controls) as secondary analyses. Differences in
the associations between ER-positive and ER-negative
diseases were assessed by case-only analyses, using ER
status as the dependent variable. To determine the number
of ‘‘independent’’ SNPs for adjustment of multiple testing,
we applied the option ‘‘–indep-pairwise’’ in PLINK (Purcell et al. 2007). SNPs were pruned by linkage disequilibrium (LD) of r2 \ 0.2 for a window size of 50 SNPs and
step size of 10 SNPs, yielding 689 ‘‘independent’’ SNPs.
The significance threshold using Bonferroni correction
corresponding to an alpha of 5 % was 7.3 9 10-5.
In order to identify more strongly associated variants,
genotypes were imputed for SNPs at the locus for which
strongest evidence of association was observed, via a twostage procedure involving SHAPEIT (Howie et al. 2012)
and IMPUTEv2 (Howie et al. 2009), using the 1000 Genomes Project data as the reference panel (Abecasis et al.
2012). Details of the imputation procedure are described
elsewhere (Michailidou et al. 2015). Models assessing
associations with imputed SNPs were adjusted for 16 PCs
based on 1000 Genome imputed data to further improve
adjustment for population stratification. To determine
independent signals within imputed SNPs at STAT3, we ran
a stepwise forward multiple logistic regression model
including the most significant genotyped SNP rs1905339
and all imputed SNPs, adjusted for study, age and 16 PCs.
SNP association analyses and case-only analyses were
all conducted using SAS 9.3 (Cary, NC, USA). All tests
were two-sided.
For multiple associated SNPs located at the same gene, a
Microsoft Excel SNP tool created by Chen et al. (2009) and
the software HaploView 4.2 (Barrett et al. 2005) were used to
examine LD structure between these SNPs. To be able to
inspect LD structures and also for gene-level analyses, allele
dosages of imputed SNPs had to be converted into the most
probable genotypes. Therefore, we categorized the imputed
allele dosage between [0, 0.5] as homozygote of the reference allele, the value between [0.5, 1.5] as heterozygote, and
the value between [1.5, 2.0] as homozygote of the counted
allele. The regional association plot was generated using the
online tool LocusZoom (Pruim et al. 2010).
Gene-level and pathway association analyses
69
Department of Medical Epidemiology and Biostatistics,
Karolinska Institutet, Stockholm, Sweden
70
Sheffield Cancer Research Centre, Department of Oncology,
University of Sheffield, Sheffield, UK
Gene-level associations were determined by a subset of
PCs, which were derived from a linear combination of
SNPs in each gene explaining 80 % of the variation in the
joint distribution of all relevant SNPs. Associations with
derived PCs were assessed within a logistic regression
framework (Biernacka et al. 2012), for overall breast cancer, ER-positive and ER-negative diseases, respectively.
Pathway association of the immunosuppression pathway
was assessed based on a global test of association by
combining the gene-level p values via the Gamma method
(Biernacka et al. 2012). For gene-level associations, associations with p value \3.8 9 10-4 (Bonferroni correction)
were considered statistically significant. To gain empirical
p values for gene-level associations of TGFBR2 and
CCND1 as well as for the pathway association, a Monte
Carlo procedure was used with up to 1,000,000 randomizations (Biernacka et al. 2012). An exact binomial test
based on the results of the single SNPs association analyses
was carried out to estimate enrichment of association in the
immunosuppression pathway. Gene-level and pathway
association analyses were carried out in R (version 3.1.1)
using the package ‘GSAgm’ version 1.0.
71
Academic Unit of Pathology, Department of Neuroscience,
University of Sheffield, Sheffield, UK
Haplotype analyses
72
Institute of Human Genetics, Pontificia Universidad
Javeriana, Bogota, Colombia
73
Department of Genetics and Pathology, Pomeranian Medical
University, Szczecin, Poland
74
Roswell Park Cancer Institute, Buffalo, NY, USA
75
Division of Genetics and Epidemiology, Institute of Cancer
Research, London, UK
76
Division of Breast Cancer Research, Institute of Cancer
Research, London, UK
77
University Cancer Center Hamburg (UCCH), University
Medical Center Hamburg-Eppendorf, Hamburg, Germany
To follow up the interesting gene associations observed,
haplotype analyses were performed to identify potential
susceptibility variants. Haplotype frequencies were determined with the use of the estimation maximization (EM)
algorithm (Long et al. 1995) implemented in PROC
HAPLOTYPE in SAS 9.3 (Cary, NC, USA). Haplotypes
with frequency more or equal than 1 % were examined and
the most common haplotype was used as the reference.
Rare haplotypes with frequency less than 1 % were
grouped into one category. Haplotype-specific odds ratios
123
Hum Genet
(ORs) and 95 % confidence intervals (CIs) were estimated
within a multiple logistic regression framework, adjusted
for the same covariates as in the single SNP association
analyses. Global p values for association of haplotypes
with breast cancer risk were computed using a likelihood
ratio test comparing models with and without haplotypes of
the gene of interest.
Gene expression analyses
In order to examine whether potential causative genes
influence RNA expression in breast tumor tissue, we
downloaded RNA sequence level 3 data from The Cancer
Genome Atlas (TCGA) (2015). We retrieved the
RNA expression level as the form of RNA-Seq by expectation–maximization (RSEM) based on the IlluminaHiSeq_RNASeqV2 array. Gene expression differences in
RNA levels between 989 invasive breast cancer tissues and
113 matched normal tissues for four genes of interest
(STAT3, PTRF, IL5, and GM-CSF) were analyzed using a
two-sided Wilcoxon–Mann–Whiney test. In addition, data
from 183 breast tissues in the GTEx (V6) (2015) publically
available online databases were evaluated to obtain information on whether the most interesting variants (rs1905339,
rs8074296, rs146170568, chr17:40607850:I and rs77942990)
were expression quantitative trait loci (eQTL) for any gene.
Also, GTEx was queried to obtain information on whether
the five variants were eQTL for STAT3 or PTRF.
Functional annotation
To investigate potential regulatory functions of interesting
polymorphisms, we used the Encyclopedia of DNA Elements (ENCODE) database through the UCSC Genome
Browser as well as Haploreg v4 (Ward and Kellis 2012).
Results
Selected characteristics of the study population are
described in Table 1. The controls and breast cancer
patients included in this study had comparable mean reference ages of 54.8 and 55.9 years and also the proportion
of postmenopausal women was similar (68 % in controls
and 69 % in breast cancer patients). The proportion of
women indicating a family history of breast cancer in first
degree relatives was as expected greater in breast cancer
patients (25 %) than in controls (12 %).
Single SNP associations
Excluding the known TGFBR2 and CCND1 breast cancer
susceptibility loci, the quantile–quantile (QQ) plot for
123
Table 1 Characteristics of breast cancer cases and controls
Characteristic
Controls
No.
Cases
%
No.
%
Total number
40,577
Age (mean, SD)
54.8
12.0
42,510
55.9
11.6
No
20,940
88
24,397
75
Yes
2829
12
7971
25
Unknown/missing
16,808
Family history of breast cancer
Menopausal status
Pre/perimenopausal
10,142
9174
32
Postmenopausal
19,753
68
Unknown/missing
11,650
9296
31
20,714
69
12,500
Estrogen receptor status
Negative
6870
21
Positive
26,094
79
Unknown/missing
9546
Progesterone receptor status
Negative
9299
33
Positive
19,017
67
Unknown/missing
14,194
Triple-negative cancer
No
13,675
84
Yes
2600
16
Unknown/missing
Stage
26,235
0
25
0.1
I
12,044
50
II
9711
40
III
1975
8
IV
496
2
Unknown/missing
18,259
Grade
Well differentiated
6125
Moderately differentiated
14,092
21
48
Poorly/un-differentiated
8937
31
Unknown/missing
13,356
SD standard deviation
associations with overall breast cancer risk for the genotyped SNPs of the other candidate genes indicated deviation
from expected p values and thus evidence of further SNPs
associated with breast cancer risk (Online Resource 3).
Genetic associations with overall breast cancer risk for all
assessed 3595 SNPs are summarized in Online Resource 4.
Four independent genotyped SNPs (LD r2 \ 0.3) were
significantly associated with breast cancer risk at p value
\7.3 9 10-5, accounting for the multiple comparisons
(Table 2). The four significant SNPs were located in or
near TGFBR2, STAT3 and CCND1. Since TGFBR2 and
Hum Genet
Table 2 TGFBR2, CCND1 and STAT3 SNPs associated with overall breast cancer risk in women of European ancestry after Bonferroni
correction (p value \7.3 9 10-5)
SNP
Chr.
Positiona
Gene
Minor allele
MAF cases
MAF controls
Cases
Controls
OR (95 %CI)b
p value
rs1431131
3
30,675,880
TGFBR2
A
0.37
0.36
42,508
40,574
1.06 (1.04–1.08)
2.6 9 10-8
rs11924422
3
30,677,484
TGFBR2
C
0.40
0.41
42,491
40,572
0.95 (0.94–0.97)
6.9 9 10-6
rs7177
11
69,466,115
CCND1
C
0.46
0.47
42,411
40,496
0.96 (0.94–0.98)
2.7 9 10-5
rs1905339
17
40,582,296
STAT3
G
0.34
0.33
42,504
40,576
1.05 (1.03–1.08)
1.4 9 10-6
SNP single nucleotide polymorphism, Chr. chromosome, MAF minor allele frequency, OR odds ratio, CI confidence interval, TGFBR2 transforming growth factor beta receptor II, CCND1 cyclin D1, STAT3 signal transducer and activator of transcription 3
a
Build 37
b
OR per minor allele, adjusted for age, study and nine European principal components
Table 3 Associations with overall breast cancer risk for seven independent imputed SNPs at STAT3 in women of European ancestry
SNP
rs8074296
Chr.
17
Positiona
40,583,421
Counted
allele
AFb
G
0.336
Cases
42,510
Controls
40,577
Single SNP analysis
Conditional analysisd
OR (95 % CI)c
p value
OR (95 %CI)c
p value
1.05 (1.03–1.08)
8.6 9 10-7
1.05 (1.03–1.07)
2.3 9 10-5
-5
rs146170568
17
40,517,716
T
0.005
42,510
40,577
1.32 (1.16–1.50)
2.1 9 10
1.27 (1.11–1.44)
3.2 9 10-4
rs141732716
17
40,469,832
A
0.005
42,510
40,577
1.38 (1.14–1.68)
0.001
1.33 (1.09–1.62)
0.004
rs138391971
17
40,505,106
G
0.003
42,510
40,577
0.60 (0.43–0.83)
0.002
0.61 (0.44–0.85)
0.003
rs12952342
17
40,553,640
G
0.119
42,510
40,577
1.07 (1.03–1.12)
0.002
1.07 (1.02–1.11)
0.005
rs190765034
17
40,428,622
G
0.026
42,510
40,577
1.14 (1.03–1.25)
0.010
1.17 (1.06–1.29)
0.002
rs190137766
17
40,422,371
T
0.002
42,510
40,577
0.68 (0.50–0.94)
0.018
0.66 (0.48–0.90)
0.009
SNP single nucleotide polymorphism, Chr. chromosome, OR odds ratio, CI confidence interval, STAT3 signal transducer and activator of
transcription 3
a
Build 37
b
Allele frequency (AF) of counted allele
c
OR per counted allele, adjusted for age, study and 16 European principal components
d
Each SNP was tested adjusting for rs8074296, age, study and 16 European principal components. Estimate for rs8074296 is based on model
including rs146170568
CCND1 have been identified as breast cancer susceptibility
loci in previous studies (French et al. 2013; Michailidou
et al. 2013; Rhie et al. 2013), we focused on the association
of the SNP at STAT3. The variant rs1905339 (A[G) at
STAT3 was positively associated with overall breast cancer
risk (per allele odds ratio (OR) 1.05, 95 % confidence
interval (CI) 1.03–1.08, p value = 1.4 9 10-6). It showed
similar associations with ER-positive and ER-negative
cancers (Online Resource 5). We did not observe further
SNPs that were significantly associated with ER-positive or
ER-negative disease (data not shown).
To identify additional susceptibility variants at STAT3,
we further investigated 707 SNPs that were well-imputed
(imputation accuracy r2 [ 0.3) and with MAF [0.01
spanning a ±50 kb window around STAT3. Seven independent signals at STAT3 were found through the stepwise
forward selection procedure. The genotyped SNP
rs1905339 was not selected. The imputed SNP rs8074296
(A[G), which was in high LD with rs1905339 (r2 = 0.99),
showed a comparable OR for the association with overall
breast cancer risk with a more extreme p value (per allele
OR 1.05, 95 % CI 1.03–1.08, p value = 8.6 9 10-7,
Table 3). A second imputed SNP rs146170568 (C[T),
associated with a per allele OR of 1.32 (95 % CI
1.16–1.50, p value = 2.1 9 10-5), was still strongly
associated at a p value of 3.2 9 10-4 after accounting for
rs8074296 (Table 3). None of the independently associated
imputed SNPs besides rs8074296 were correlated with
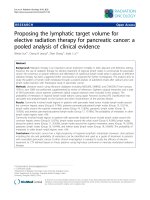
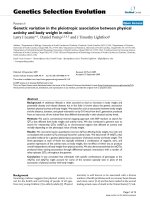
rs1905339 or with each other (r2 B 0.01, Fig. 1). As
rs8074296 and rs1905339 are located closer to PTRF than
to STAT3, we additionally analyzed data of 178 imputed
variants located within ±50 kb of PTRF. Associations of
most additional variants in the PTRF region with breast
cancer risk were attenuated in analyses conditioning on
rs8074296 (Table 4). The variants chr17:40607850:I and
rs77942990 still showed a strong association with breast
cancer risk (per allele OR 1.09, 95 % CI 1.04–1.15,
p value = 0.0005; and per allele OR 1.09, 95 % CI
1.04–1.15, p value = 0.0007, respectively). These two
variants were also not in LD with rs8074296 (r2 = 0.09
123
Hum Genet
Fig. 1 Linkage disequilibrium
plot showing r2 values and color
schemes for the genotyped SNP
rs1905339 and seven
independent imputed SNPs as
well as imputed SNP
rs181888151 within ±50 kb of
STAT3. The linkage
disequilibrium (LD) plot shows
that SNP rs1905339 is in strong
LD with the imputed SNP
rs8074296 (r2 = 0.99), and
independent of the other six
imputed SNPs (r2 B 0.01) at
STAT3. LD was estimated based
on control data
and 0.07, respectively) while all other variants in Table 4
were at least in moderate LD with rs8074296 (r2 C 0.46,
Online Resource 6). The LD plot (Online Resource 6) also
shows that chr17:40607850:I and rs77942990 are in high
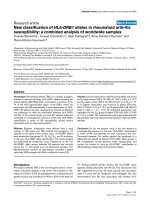
LD (r2 = 0.83). A regional association plot for the genotyped SNP rs1905339 and all 885 imputed SNPs within ±50 kb of STAT3 and PTRF included in this analysis is
shown in Fig. 2. Associations of SNPs shown in Table 3 as
well as associations of chr17:40607850:I and rs77942990
with breast cancer risk were not significantly heterogeneous between studies (all p values for heterogeneity
[0.1); forest plots can be found in Online Resource 7 to
16.
Gene-level and pathway associations
Gene-level associations with risks of overall breast cancer,
ER-positive and ER-negative diseases, respectively, for the
133 candidate genes in the immunosuppression pathway
are summarized in Online Resource 17. TGFBR2 and
CCND1 showed significant associations with overall breast
cancer risk (p value \10-6 and 3.0 9 10-4, respectively).
In addition, IL5 and GM-CSF may be further potential
susceptibility loci of breast cancer (p value = 1.0 9 10-3
and 7.0 9 10-3, respectively). STAT3 showed a less significant association with overall breast cancer risk
(p value = 0.033). The immunosuppression pathway as a
whole yielded a significant association with overall breast
123
cancer risk (p value \10-6). Similar gene-level and pathway associations were found for ER-positive but not for
ER-negative breast cancer (Online Resource 17). We found
significant enrichment of association in the immunosuppression pathway based on the results of the single SNPs
association analyses (313 of 3595 tests significant at
a = 0.05, exact binomial test p value = 2.2 9 10-16).
Haplotype analyses
Despite the evidence for a possible role of IL5 and GMCSF in breast cancer susceptibility from the gene-level
analysis, no individual SNPs at IL5 or GM-CSF yielded
significant genetic associations. To identify potential susceptibility haplotypes, haplotype-specific associations were
assessed based on seven SNPs in or near IL5 (rs4143832,
rs2079103, rs2706399, rs743562, rs739719, rs2069812 and
rs2244012) and nine SNPs in or near GM-CSF
(rs11575022, rs2069616, rs25881, rs25882, rs25883,
rs27349, rs27438, rs40401 and rs743564). The LD structures for these SNPs at IL5 and GM-CSF are shown in
Online Resource 18 and 19, respectively. In our study
sample of women of European ancestry, 11 and 7 common
haplotypes with frequency [1 % were observed at IL5 and
GM-CSF, respectively. The haplotype AAAACGG in IL5
was associated with a decreased overall breast cancer risk
(OR 0.96, 95 % CI 0.93–0.99, p value = 5.0 9 10-3,
Table 5). In GM-CSF, the haplotype AAGAGCGAA was
Hum Genet
Table 4 Associations with overall breast cancer risk for 19 imputed variants near PTRF in women of European ancestry
SNP
Chr
Positiona
Counted
allele
AFb
Cases
Controls
Conditional analysisd
Single SNP analysis
ORc
(95 % CI)
p value
ORc
(95 % CI)
p value
rs8074296
17
40,583,421
G
0.336
42,510
40,577
1.05
(1.03–1.08)
8.6 9 10-7
1.04
(1.02–1.06)
0.0006
rs1032070
17
40,618,251
T
0.269
42,510
40,577
1.06
(1.04–1.09)
1.5 9 10-7
1.04
(1.00–1.09)
0.0359
rs34460267
17
40,615,865
C
0.269
42,510
40,577
1.06
(1.04.1.09)
1.9 9 10-7
1.04
(1.00–1.09)
0.0424
-7
rs34807589
17
40,624,656
T
0.264
42,510
40,577
1.06
(1.04–1.09)
2.0 9 10
1.04
(1.00–1.09)
0.0423
rs36005199
17
40,597,555
G
0.268
42,510
40,577
1.06
(1.04–1.09)
2.1 9 10-7
1.04
(1.00–1.09)
0.0490
rs12603201
17
40,595,927
T
0.581
42,510
40,577
0.95
(0.93–0.97)
3.1 9 10-7
0.97
(0.93–1.00)
0.0662
chr17:40607850:I
rs4796662
17
17
40,607,850
40,594,882
CT
C
0.055
0.576
42,510
42,510
40,577
40,577
1.13
0.95
(1.07–1.18)
(0.93–0.97)
7.0 9 10-7
1.8 9 10-6
1.09
0.98
(1.04–1.15)
(0.94–1.01)
0.0005
0.2217
rs34349578
17
40,598,129
A
0.195
42,510
40,577
1.07
(1.04–1.10)
2.1 9 10-6
1.04
(1.00–1.08)
0.0809
rs62075801
17
40,593,921
T
0.576
42,510
40,577
0.95
(0.93–0.97)
2.1 9 10-6
0.98
(0.94–1.01)
0.2385
rs12951640
17
40,594,298
A
0.253
42,510
40,577
1.06
(1.03–1.08)
2.1 9 10-6
1.03
(0.98–1.07)
0.2269
rs77942990
17
40,622,538
A
0.046
42,510
40,577
1.13
(1.07–1.19)
2.2 9 10-6
1.09
(1.04–1.15)
0.0007
rs35111218
17
40,595,572
T
0.252
42,510
40,577
1.06
(1.03–1.08)
2.3 9 10-6
1.03
(0.98–1.07)
0.2311
-6
rs6503704
17
40,592,253
A
0.253
42,510
40,577
1.06
(1.03–1.08)
2.3 9 10
1.03
(0.98–1.07)
0.2413
rs12943498
17
40,593,901
C
0.253
42,510
40,577
1.06
(1.03–1.08)
2.5 9 10-6
1.02
(0.98–1.07)
0.2529
rs12951549
17
40,593,502
T
0.253
42,510
40,577
1.06
(1.03–1.08)
2.6 9 10-6
1.02
(0.98–1.07)
0.2537
chr17:40593802:I
17
40,593,802
GTTTC
0.251
42,510
40,577
1.06
(1.03–1.08)
3.5 9 10-6
1.02
(0.98–1.07)
0.2943
rs6503703
17
40,592,207
T
0.261
42,510
40,577
1.06
(1.03–1.08)
6.5 9 10-6
1.02
(0.98–1.06)
0.3775
chr17:40595896:D
17
40,595,896
C
0.211
42,510
40,577
1.06
(1.03–1.09)
9.0 9 10-6
1.02
(0.98–1.07)
0.2373
SNP single nucleotide polymorphism, Chr. chromosome, OR odds ratio, CI confidence interval, STAT3 signal transducer and activator of
transcription 3
a
Build 37
b
Allele frequency (AF) of counted allele
c
OR per counted allele, adjusted for age, study and 16 European principal components
d
Each SNP was tested adjusting for rs8074296, age, study and 16 European principal components. Estimate for rs8074296 was based on model
including chr17:40607850:I
Fig. 2 Regional association
plot for the genotyped SNP
rs1905339 and 885 imputed
SNPs within ±50 kb of STAT3
and PTRF. Each dot represents
an SNP. The color of each dot
reflects the extent of linkage
disequilibrium (r2) with SNP
rs1032070 (in purple diamond).
Genomic positions of SNPs
were plotted based on hg19/
1000 Genomes Mar 2012
European. Association is
represented at the -log10 scale.
cM/Mb centiMorgans/megabase
123
0.84
1.01 (0.95–1.07)
0.005
0.078
0.92 (0.84–1.01)
Gene expression analyses
b
OR adjusted for age, study and nine European principal components
OR odds ratio, CI confidence interval, IL5 interleukin 5
a
Globalb
Global p value for haplotype association, likelihood ratio test with ten degrees of freedom
–
–
–
–
–
–
–
Rare
123
also associated with a decreased overall breast cancer risk
(OR 0.92, 95 % CI 0.87–0.96, p value = 2.7 9 10-4,
Table 6). The global p value for haplotype association was
significant for both IL5 (p value = 0.005) and GM-CSF
(p value = 0.007).
0.03
0.035
0.92 (0.85–0.99)
G
G
G
C
A
A
A
C
9
A
C
8
C
G
A
A
0.01
0.15
0.021
0.95 (0.88–1.02)
1.09 (1.01–1.18)
A
G
C
C
6
7
C
C
G
A
G
A
C
C
A
A
0.02
0.24
0.96 (0.90–1.03)
0.02
0.02
0.85
0.99 (0.94–1.05)
0.03
G
A
A
C
A
A
A
A
5
A
C
4
A
G
A
A
0.04
0.005
0.55
1.02 (0.96–1.07)
0.04
G
C
3
C
G
G
C
G
0.62
1.01 (0.98–1.03)
0.96 (0.93–0.99)
0.14
0.22
G
A
A
C
A
A
A
A
2
C
C
1
A
A
C
G
–
1.00
0.42
A
G
C
C
Reference
C
G
G
rs2069812
(G[A)
rs739719
(C[A)
rs743562
(G[A)
rs2706399
(A[G)
rs2079103
(C[A)
rs4143832
(C[A)
Haplotype
Table 5 Haplotype associations with overall breast cancer risk for seven SNPs at IL5 in women of European ancestry
rs2244012
(A[G)
Frequency
ORa (95 %CI)
p value
Hum Genet
Using TCGA RNA sequencing level 3 data, we found that
RNA expression levels of STAT3 and IL5 were significantly higher in 113 normal tissue samples compared to
989 breast tumor samples (p value = 1.3 9 10-3 and
7.0 9 10-4, respectively, Online Resources 20 and 21),
while overall expression of IL5 was low in both tissues.
Also expression levels of PTRF were significantly higher
in normal tissue compared to tumor tissue samples
(p value B0.0001, Online Resource 22). GM-CSF expression was very low and did not differ between breast tumor
samples and normal tissue samples (p value = 0.49,
Online Resource 23). Among 183 mammary tissues in the
GTEx database, SNPs rs1905339, rs8074296 and
rs77942990 were not significantly correlated with STAT3
(p values = 0.36, 0.36, and 0.2, respectively; Online
Resource 24 to 26) or PTRF expression (p values = 0.4,
0.4, and 0.39 Online Resource 27 to 29). The SNPs
rs1905339 and rs8074296 were significant eQTL for
TUBG2 (both p values = 9.9 9 10-7, Online Resource 30
and 31). The STAT3/PTRF variants rs146170568 and
chr17:40607850:I were not available in the GTEx
database.
Discussion
Our comprehensive examination of associations between
polymorphisms in the immunosuppression pathway genes
and breast cancer risk revealed that STAT3, IL5, and GMCSF may play a role in overall breast cancer susceptibility
among women of European ancestry.
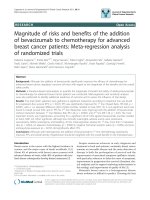
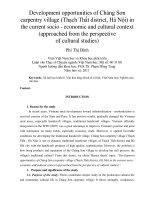
The in silico functional analysis revealed that within a
±50 kb window of STAT3, several polymorphisms are
located in regulatory regions that could actively affect
DNA transcription (Fig. 3). The SNP rs181888151, which
is in complete LD with rs146170568 (r2 = 1) but independent of rs1905339 (r2 = 0.01, Fig. 1) was significantly
associated with increased risk for overall breast cancer
(per allele OR 1.31, 95 % CI 1.16–1.49, p value =
2.8 9 10-5). Together with a further independently associated imputed SNP rs141732716, these polymorphisms
reside in strong DNase I hypersensitivity and transcription
regulatory sites (Fig. 3). This suggests that they may be
functional polymorphisms, but further experimental work
is required for confirmation.
0.23
0.007
0.96 (0.91–1.02)
0.03
–
–
OR adjusted for age, study and nine European principal components
Global p value for haplotype association, likelihood ratio test with 6 degrees of freedom
b
a
–
Rare
Globalb
OR odds ratio, CI confidence interval, GM-CSF granulocyte–macrophage colony stimulating factor
–
–
–
–
–
A
5
–
0.24
0.96 (0.91–1.03)
0.03
A
G
A
C
A
G
G
A
4
G
0.025
2.7 9 10-4
0.92 (0.87–0.96)
0.05
A
A
G
C
G
A
G
0.50
C
A
0.95 (0.91–0.99)
0.06
A
A
A
A
A
G
A
0.11
3
A
0.99 (0.96–1.02)
0.98 (0.96–1.00)
0.33
0.11
A
A
G
A
A
G
C
A
A
G
A
G
A
G
A
2
A
A
1
A
–
1.00
0.38
G
G
G
C
G
A
G
A
Reference
G
rs40401
(G[A)
rs27438
(G[A)
rs27349
(C[A)
rs25883
(G[A)
rs25882
(A[G)
rs25881
(G[A)
rs2069616
(A[G)
rs11575022
(A[C)
Haplotype
Table 6 Haplotype associations with overall breast cancer risk for nine SNPs at GM-CSF in women of European ancestry
rs743564
(A[G)
Frequency
OR (95 %CI)a
p value
Hum Genet
STAT3 encodes the signal transducer and activator of
transcription 3, which is a member of the STAT protein
family. Activated by corresponding cytokines or growth
factors, STAT3 can be phosphorylated and translocate into
the cell nucleus, acting as a transcription activator. In
addition, STAT3 plays a key role in regulating immune
response in the tumor microenvironment (Yu et al. 2009).
STAT3 signaling is required for immunosuppressive and
tumor-promoting functions of MDSCs (Cheng et al. 2003,
2008; Kortylewski et al. 2005, 2009; Kujawski et al. 2008;
Ostrand-Rosenberg and Sinha 2009; Yu et al. 2009), as
well as for Treg cell expansion (Kortylewski et al. 2005,
2009; Matsumura et al. 2007). STAT3 has been reported in
several previous genome-wide association studies (GWAS)
to be associated with immune relevant diseases such as
Crohn’s disease (Barrett et al. 2008; Franke et al. 2008;
Yamazaki et al. 2013), inflammatory bowel disease (Jostins et al. 2012), and multiple sclerosis (Jakkula et al. 2010;
Patsopoulos et al. 2011; Sawcer et al. 2011). Additionally,
expression of STAT3 was suggested to be enriched in triple-negative breast cancer, and negatively associated with
lymph node involvement and breast tumor stage in a study
based on an in silico network approach (Liu et al. 2012b).
However, the association of rs1905339 with triple-negative
breast cancer risk in our study (N triple-negative breast
cancer = 2600) was similar and not stronger compared to
the association observed for overall breast cancer risk (per
allele OR 1.06, 95 % CI 0.99–1.14, p value = 0.11).
The genotyped SNP rs1905339 is also located at 7 kb 50
of PTRF, which encodes the polymerase I and transcript
release factor, and is not known to be directly involved in
immunosuppression. In addition, two independently associated imputed SNPs rs8074296 and rs12952342 (r2 = 0.99
and 0 with rs1905339, respectively, Fig. 1) are located at
8 kb 50 and 0.8 kb 30 of PTRF, respectively (Fig. 3). PTRF is
known to contribute to the formation of caveolae, small
membrane caves involved in cell signaling, lipid regulation,
and endocytosis (Chadda and Mayor 2008). Recently, downregulation of PTRF was observed in breast cancer cell lines
and breast tumor tissue, suggesting that PTRF expression
might be an indicator for breast cancer progression (Bai et al.
2012). The SNPs rs1905339 and rs8074296 were also found
to be eQTL for TUBG2 (tubulin, gamma 2) in the GTEx
database, the expression of TUBG2 decreased with each
variant allele (Online Resources 30 and 31, respectively).
TUBG2 encodes c-tubulin, a protein required for the formation and polar orientation of microtubules in cells. It is
currently unknown, whether TUBG2 plays a role in breast
cancer development or progression.
The other two potential susceptibility loci, IL5 and GMCSF, are both located in a known cytokine gene cluster at
5q31. IL5 encodes interleukin 5, a cytokine secreted by
CD4? T helper 2 cells (Mills 2004; Parker 1993). IL5 is a
123
Hum Genet
Fig. 3 UCSC genome browser graphic for SNPs at the STAT3/PTRF
region. The UCSC genome browser graphic shows functional
annotations for the SNPs rs1905339 (red), correlated SNPs
(r2 [ 0.80, green), as well as the other independent imputed SNPs
(black) in or near the STAT3/PTRF region
growth and differentiation factor for both B cells and
eosinophils, triggering eosinophil- and B cell-dependent
immune response (Mills 2004; Parker 1993). GM-CSF
encodes granulocyte–macrophage colony stimulating factor, a cytokine that controls differentiation and function of
granulocytes and macrophages. GM-CSF is also a MDSCinducing and activating factor in the bone marrow (Ostrand-Rosenberg and Sinha 2009; Serafini et al. 2004). In
the tumor microenvironment, GM-CSF is the cytokine for
dendritic cell differentiation and function, and it is often
found to be underexpressed (Zou 2005). Additionally, 5q31
has been found to be a susceptibility locus for rheumatoid
arthritis (Okada et al. 2012, 2014) and inflammatory bowel
disease (Jostins et al. 2012).
Immunosuppression is a complex network with plenty
of contributors, including transcription factors (e.g.,
STAT3), as well as immune mediating cytokines (e.g., IL5
and GM-CSF). Results of this analysis indicate that genetic
variation in different components of the immunosuppression pathway may be susceptibility loci of breast cancer
among women of European ancestry.
The main strengths of the present analysis were its large
sample size, the uniform genotyping procedures and centralized quality controls used. The imputation of genotypes
in the most interesting susceptibility loci provided an
opportunity to identify more strongly associated variants.
Assessments of gene-level associations also provided evidence for additional putative susceptibility loci. A limitation was the lack of an independent sample to replicate the
observed associations; this will be feasible in the future
using new studies participating in the BCAC. Further
functional studies are still needed to identify causal variants
and to investigate the underlying biological mechanisms.
for mediating this association were STAT3, IL5, and GMCSF, but we cannot exclude the possibility of multiple
alleles each with effects too small to confirm.
Conclusions
Overall, our data provide strong evidence that common
variation in the immunosuppression pathway is associated
with breast cancer susceptibility. The strongest candidates
123
Acknowledgments We thank all the individuals who took part in
these studies and all the researchers, clinicians, technicians, and
administrative staff who have enabled this work to be carried out.
This analysis would not have been possible without the contributions
of the following: Per Hall (COGS); Douglas F. Easton, Paul Pharoah,
Kyriaki Michailidou, Manjeet K. Bolla, Qin Wang (BCAC), Andrew
Berchuck (OCAC), Rosalind A. Eeles, Douglas F. Easton, Ali Amin
Al Olama, Zsofia Kote-Jarai, Sara Benlloch (PRACTICAL), Georgia
Chenevix-Trench, Antonis Antoniou, Lesley McGuffog, Fergus
Couch and Ken Offit (CIMBA), Joe Dennis, Alison M. Dunning,
Andrew Lee, and Ed Dicks, Craig Luccarini and the staff of the
Centre for Genetic Epidemiology Laboratory, Javier Benitez, Anna
Gonzalez-Neira and the staff of the CNIO genotyping unit, Jacques
Simard and Daniel C. Tessier, Francois Bacot, Daniel Vincent, Sylvie
LaBoissie`re and Frederic Robidoux and the staff of the McGill
University and Ge´nome Que´bec Innovation Centre, Stig E. Bojesen,
Sune F. Nielsen, Borge G. Nordestgaard, and the staff of the
Copenhagen DNA laboratory, and Julie M. Cunningham, Sharon A.
Windebank, Christopher A. Hilker, Jeffrey Meyer and the staff of
Mayo Clinic Genotyping Core Facility. ABCFS would like to thank
Maggie Angelakos, Judi Maskiell, and Gillian Dite. ABCS would like
to thank Sanquin Amsterdam, the Netherlands. BBCS thanks Eileen
Williams, Elaine Ryder-Mills, and Kara Sargus. BIGGS thanks Niall
McInerney, Gabrielle Colleran, Andrew Rowan, and Angela Jones.
BSUCH would like to thank Peter Bugert and Medical Faculty
Mannheim. CGPS thanks Staff and participants of the Copenhagen
General Population Study, as well as excellent technical assistance
from Dorthe Uldall Andersen, Maria Birna Arnadottir, Anne Bank,
and Dorthe Kjeldga˚rd Hansen. CNIO-BCS would like to thank
´ lvarez, Pilar
Guillermo Pita, Charo Alonso, Daniel Herrero, Nuria A
Zamora, Primitiva Menendez, and the Human Genotyping-CEGEN
Unit. CTS would like to thank the CTS Steering Committee including
Leslie Bernstein, Susan Neuhausen, James Lacey, Sophia Wang,
Huiyan Ma, Yani Lu, and Jessica Clague DeHart at the Beckman
Research Institute of City of Hope, Dennis Deapen, Rich Pinder,
Eunjung Lee, and Fred Schumacher at the University of Southern
California, Pam Horn-Ross, Peggy Reynolds, Christina Clarke Dur
and David Nelson at the Cancer Prevention Institute of California, and
Hoda Anton-Culver, Argyrios Ziogas, and Hannah Park at the
University of California Irvine. ESTHER thanks Hartwig Ziegler,
Christa Stegmaier, Sonja Wolf, and Volker Hermann. GC-HBOC
thanks Stefanie Engert, Heide Hellebrand, and Sandra Kroăber.
GENICA would like to thank the GENICA Network, including Dr.
Margarete Fischer-Bosch-Institute of Clinical Pharmacology, Stuttgart, and University of Tuăbingen, Germany (HB, Wing-Yee Lo,
Hum Genet
Christina Justenhoven), German Cancer Consortium (DKTK) and
Deutsches Krebsforschungszentrum (DKFZ) (HB), Department of
Internal Medicine, Evangelische Kliniken Bonn gGmbH, Johanniter
Krankenhaus, Bonn, Germany (Yon-Dschun Ko, Christian Baisch),
Institute of Pathology, University of Bonn, Germany (Hans-Peter
Fischer), Molecular Genetics of Breast Cancer, DKFZ, Heidelberg,
Germany (UH), Institute for Prevention and Occupational Medicine
of the German Social Accident Insurance, Institute of the Ruhr
University Bochum (IPA), Bochum, Germany (Thomas Bruăning,
Beate Pesch, Sylvia Rabstein, Anne Lotz), and Institute of Occupational Medicine and Maritime Medicine, University Medical Center
Hamburg-Eppendorf, Germany (Volker Harth). HEBCS would like to
thank Kirsimari Aaltonen, Karl von Smitten, Sofia Khan, Tuomas
Heikkinen, and Irja Erkkilaă. HMBCS would like to thank Peter
Hillemanns, Hans Christiansen, and Johann H. Karstens. KBCP
thanks Eija Myoăhaănen and Helena Kemilaăinen. LMBC thanks Gilian
Peuteman, Dominiek Smeets, Thomas Van Brussel, and Kathleen
Corthouts. MARIE would like to thank Petra Seibold, Judith Heinz,
Nadia Obi, Alina Vrieling, Muhabbet Celik, Til Olchers, and Stefan
Nickels. MBCSG thanks Siranoush Manoukian, Bernard Peissel and
Daniela Zaffaroni at the Fondazione IRCCS Istituto Nazionale dei
Tumori (INT), Monica Barile and Irene Feroce at the Istituto Europeo
di Oncologia (IEO), and the personnel of the Cogentech Cancer
Genetic Test Laboratory. MTLGEBCS would like to thank Martine
Tranchant at the CHU de Que´bec Research Center, Marie-France
Valois, Annie Turgeon and Lea Heguy at the McGill University
Health Center, Royal Victoria Hospital, McGill University for DNA
extraction, sample management and skillful technical assistance, and
J.S. who is the Chairholder of the Canada Research Chair in Oncogenetics. NBCS would like to thank Dr. Kristine Kleivi, PhD (K.G.
Jebsen Centre for Breast Cancer Research, Institute of Clinical
Medicine, University of Oslo, Oslo, Norway and Department of
Research, Vestre Viken, Drammen, Norway), Dr. Lars Ottestad, MD
(Department of Genetics, Institute for Cancer Research, Oslo
University Hospital Radiumhospitalet, Oslo, Norway), Prof. Em. Rolf
Ka˚resen, MD (Department of Oncology, Oslo University Hospital and
Faculty of Medicine, University of Oslo, Oslo, Norway), Dr. Anita
Langerød, PhD (Department of Genetics, Institute for Cancer
Research, Oslo University Hospital Radiumhospitalet, Oslo, Norway),
Dr. Ellen Schlichting, MD (Department for Breast and Endocrine
Surgery, Oslo University Hospital Ullevaal, Oslo, Norway), Dr. Marit
Muri Holmen, MD (Department of Radiology and Nuclear Medicine,
Oslo University Hospital, Oslo, Norway), Prof. Toril Sauer, MD
(Department of Pathology at Akershus University hospital, Lørenskog, Norway), Dr. Vilde Haakensen, MD (Department of Genetics,
Institute for Cancer Research, Oslo University Hospital Radiumhospitalet, Oslo, Norway), Dr. Olav Engebra˚ten, MD (Institute for
Clinical Medicine, Faculty of Medicine, University of Oslo and
Department of Oncology, Oslo University Hospital, Oslo, Norway),
Prof. Bjørn Naume, MD (Division of Cancer Medicine and Radiotherapy, Department of Oncology, Oslo University Hospital Radiumhospitalet, Oslo, Norway), Dr. Cecile E. Kiserud, MD (National
Advisory Unit on Late Effects after Cancer Treatment, Department of
Oncology, Oslo University Hospital, Oslo, Norway and Department
of Oncology, Oslo University Hospital, Oslo, Norway), Dr. Kristin V.
Reinertsen, MD (National Advisory Unit on Late Effects after Cancer
Treatment, Department of Oncology, Oslo University Hospital, Oslo,
Norway and Department of Oncology, Oslo University Hospital,
˚ slaug Helland, MD (Department of
Oslo, Norway), Assoc. Prof. A
Genetics, Institute for Cancer Research and Department of Oncology,
Oslo University Hospital Radiumhospitalet, Oslo, Norway), Dr.
Margit Riis, MD (Dept of Breast- and Endocrine Surgery, Oslo
University Hospital, Ulleva˚l, Oslo, Norway), Dr. Ida Bukholm, MD
(Department of Breast-Endocrine Surgery, Akershus University
Hospital, Oslo, Norway and Department of Oncology, Division of
Cancer Medicine, Surgery and Transplantation, Oslo University
Hospital, Oslo, Norway), Prof. Per Eystein Lønning, MD (Section of
Oncology, Institute of Medicine, University of Bergen and Department of Oncology, Haukeland University Hospital, Bergen, Norway),
Dr Silje Nord, PhD (Department of Genetics, Institute for Cancer
Research, Oslo University Hospital Radiumhospitalet, Oslo, Norway)
and Grethe I. Grenaker Alnæs, M.Sc. (Department of Genetics,
Institute for Cancer Research, Oslo University Hospital Radiumhospitalet, Oslo, Norway). NBHS would like to thank study participants
and research staff for their contributions and commitment to this
study. OBCS thanks Meeri Otsukka and Kari Mononen. OFBCR
thanks Teresa Selander and Nayana Weerasooriya. PBCS thanks
Louise Brinton, Mark Sherman, Neonila Szeszenia-Dabrowska,
Beata Peplonska, Witold Zatonski, Pei Chao, and Michael Stagner.
SASBAC would like to thank the Swedish Medical Research Counsel. SBCS would like to thank Sue Higham, Helen Cramp, Ian Brock,
Sabapathy Balasubramanian, and Dan Connley. SEARCH thanks the
SEARCH and EPIC teams. SKKDKFZS thanks all study participants, clinicians, family doctors, researchers and technicians for their
contributions and commitment to this study. TNBCC thanks Robert
Pilarski and Charles Shapiro who were instrumental in the formation
of the OSU Breast Cancer Tissue Bank, and also thanks the Human
Genetics Sample Bank for processing of samples and providing OSU
Columbus area control samples. UKBGS would like to thank Breast
Cancer Now and the Institute of Cancer Research for support and
funding of the Breakthrough Generations Study, and the study participants, study staff, and the doctors, nurses and other health care
providers and health information sources who have contributed to the
study, and acknowledge the NHS funding to the Royal Marsden/ICR
NIHR Biomedical Research Centre. kConFab/AOCS wish to thank
Heather Thorne, Eveline Niedermayr, all the kConFab research nurses
and staff, the heads and staff of the Family Cancer Clinics, and the
Clinical Follow Up Study (which has received funding from the
NHMRC, the National Breast Cancer Foundation, Cancer Australia,
and the National Institute of Health (USA)) for their contributions to
this resource, and many families who contribute to kConFab.
pKARMA would like to thank the Swedish Medical Research
Counsel.
Compliance with ethical standards
Conflict of interest
peting interests.
The authors declare that they have no com-
Financial supports Funding for the iCOGS infrastructure came
from: the European Community’s Seventh Framework Programme
under grant agreement number 223175 (HEALTH-F2-2009-223175)
(COGS), Cancer Research UK (C1287/A10118, C1287/A10710,
C12292/A11174, C1281/A12014, C5047/A8384, C5047/A15007,
C5047/A10692, C8197/A16565), the National Institutes of Health
(NIH, CA128978, CA122443) and Post-Cancer GWAS initiative
(1U19 CA148537, 1U19 CA148065 and 1U19 CA148112—the
GAME-ON initiative), the Department of Defence (W81XWH-10-10341), the Canadian Institutes of Health Research (CIHR) for the
CIHR Team in Familial Risks of Breast Cancer, Komen Foundation
for the Cure, the Breast Cancer Research Foundation, and the Ovarian
Cancer Research Fund. BCAC is funded by Cancer Research UK
(C1287/A10118, C1287/A12014) and by the European Community´s
Seventh Framework Programme under grant agreement number
223175 (grant number HEALTH-F2-2009-223175) (COGS). The
ABCFS study was supported by grant UM1 CA164920 from the
National Cancer Institute (USA). This study was also supported by
the National Health and Medical Research Council of Australia, the
New South Wales Cancer Council, the Victorian Health Promotion
Foundation (Australia) and the Victorian Breast Cancer Research
Consortium. The ABCS study was supported by the Dutch Cancer
Society (grants NKI 2007-3839; 2009 4363), and Biobanking and
123
Hum Genet
BioMolecular resources Research Infrastructure—Netherlands
(BBMRI-NL), which is a Research Infrastructure financed by the
Dutch government (NWO 184.021.007). The work of the BBCC was
partly funded by ELAN-Fond of the University Hospital of Erlangen.
The BBCS study was funded by Cancer Research UK and Breakthrough Breast Cancer and acknowledges National Health Service
(NHS) funding to the National Institute for Health Research (NIHR)
Biomedical Research Centre, and the National Cancer Research
Network (NCRN). The BIGGS study was supported by NIHR
Comprehensive Biomedical Research Centre, Guy’s & St. Thomas’
NHS Foundation Trust in partnership with King’s College London,
United Kingdom. IT was supported by the Oxford Biomedical
Research Centre. The BSUCH study was supported by the DietmarHopp Foundation, the Helmholtz Society and the Deutsches Krebsforschungszentrum (DKFZ). The CECILE study was funded by
Fondation de France, Institut National du Cancer (INCa), Ligue
Nationale contre le Cancer, Ligue contre le Cancer Grand Ouest,
Agence Nationale de Se´curite´ Sanitaire (ANSES), Agence Nationale
de la Recherche (ANR). The CGPS study was supported by the Chief
Physician Johan Boserup and Lise Boserup Fund, the Danish Medical
Research Council and Herlev Hospital. The CNIO-BCS study was
supported by the Instituto de Salud Carlos III, the Red Tema´tica de
Investigacio´n Cooperativa en Ca´ncer and grants from the Asociacio´n
Espan˜ola Contra el Ca´ncer and the Fondo de Investigacio´n Sanitario
(PI11/00923 and PI12/00070). The CTS study was initially supported
by the California Breast Cancer Act of 1993 and the California Breast
Cancer Research Fund (contract 97-10500) and is currently funded
through the NIH (R01 CA77398). Collection of cancer incidence data
(GLOBOCAN 2012) was supported by the California Department of
Public Health as part of the statewide cancer reporting program
mandated by California Health and Safety Code Sect. 103885. HAC
received support from the Lon V Smith Foundation (LVS39420). The
ESTHER study was supported by a grant from the Baden Wuărttemberg Ministry of Science, Research and Arts. Additional cases were
recruited in the context of the VERDI study, which was supported by
a grant from the German Cancer Aid (Deutsche Krebshilfe). The GCHBOC study was supported by the German Cancer Aid (grant no
110837, coordinator: Rita K. Schmutzler). The GENICA study was
funded by the Federal Ministry of Education and Research (BMBF)
Germany grants 01KW9975/5, 01KW9976/8, 01KW9977/0 and
01KW0114, the Robert Bosch Foundation, Stuttgart, DKFZ, Heidelberg, the Institute for Prevention and Occupational Medicine of the
German Social Accident Insurance, Institute of the Ruhr University
Bochum (IPA), Bochum, as well as the Department of Internal
Medicine, Evangelische Kliniken Bonn gGmbH, Johanniter
Krankenhaus, Bonn, Germany. The HEBCS study was financially
supported by the Helsinki University Central Hospital Research Fund,
Academy of Finland (266528), the Finnish Cancer Society, the Nordic
Cancer Union and the Sigrid Juselius Foundation. The HMBCS study
was supported by a grant from the Friends of Hannover Medical
School and by the Rudolf Bartling Foundation. The KBCP study was
financially supported by the special Government Funding (EVO) of
Kuopio University Hospital grants, Cancer Fund of North Savo, the
Finnish Cancer Organizations, and by the strategic funding of the
University of Eastern Finland. The LMBC study was supported by the
‘Stichting tegen Kanker’ (232-2008 and 196-2010). The MARIE
study was supported by the Deutsche Krebshilfe e.V. (70-2892-BR I,
106332, 108253, 108419), the Hamburg Cancer Society, DKFZ and
the Federal Ministry of Education and Research (BMBF) Germany
(01KH0402). The MBCSG study was supported by grants from the
Italian Association for Cancer Research (AIRC) and by funds from
the Italian citizens who allocated the 5/1000 share of their tax payment in support of the Fondazione IRCCS Istituto Nazionale Tumori,
according to Italian laws (INT-Institutional strategic projects
‘‘5 9 100000 ). The MCBCS study was supported by the NIH grants
CA128978, CA116167, CA176785 and NIH Specialized Program of
123
Research Excellence (SPORE) in Breast Cancer (CA116201), and the
Breast Cancer Research Foundation and a generous gift from the
David F. and Margaret T. Grohne Family Foundation and the Ting
Tsung and Wei Fong Chao Foundation. The MCCS cohort recruitment was funded by VicHealth and Cancer Council Victoria. This
study was further supported by Australian NHMRC grants 209057,
251553 and 504711 and by infrastructure provided by Cancer Council
Victoria. Cases and their vital status were ascertained through the
Victorian Cancer Registry (VCR) and the Australian Institute of
Health and Welfare (AIHW), including the National Death Index. The
MEC study was support by NIH grants CA63464, CA54281,
CA098758 and CA132839. The work of MTLGEBCS was supported
by the Quebec Breast Cancer Foundation, the Canadian Institutes of
Health Research (CIHR) for the ‘‘CIHR Team in Familial Risks of
Breast Cancer’’ program—grant # CRN-87521 and the Ministry of
Economic Development, Innovation and Export Trade—grant # PSRSIIRI-701. The NBCS study has received funding from the K.G.
Jebsen Centre for Breast Cancer Research, the Research Council of
Norway grant 193387/V50 (to A-L Børresen-Dale and V.N. Kristensen) and grant 193387/H10 (to A-L Børresen-Dale and V.N.
Kristensen), South Eastern Norway Health Authority (grant 39346 to
A-L Børresen-Dale) and the Norwegian Cancer Society (to A-L
Børresen-Dale and V.N. Kristensen). The NBHS study was supported
by NIH grant R01CA100374. Biological sample preparation was
conducted the Survey and Biospecimen Shared Resource, which is
supported by P30 CA68485. The OBCS study was supported by
research grants from the Finnish Cancer Foundation, the Academy of
Finland (grant number 250083, 122715 and Center of Excellence
grant number 251314), the Finnish Cancer Foundation, the Sigrid
Juselius Foundation, the University of Oulu, the University of Oulu
Support Foundation and the special Governmental EVO funds for
Oulu University Hospital-based research activities. The OFBCR study
was supported by grant UM1 CA164920 from the National Cancer
Institute (USA). The PBCS study was funded by Intramural Research
Funds of the National Cancer Institute, Department of Health and
Human Services, USA. The SASBAC study was supported by funding from the Agency for Science, Technology and Research of Singapore (A*STAR), the US National Institute of Health and the Susan
G. Komen Breast Cancer Foundation. The SBCS study was supported
by Yorkshire Cancer Research S295, S299, S305PA and Sheffield
Experimental Cancer Medicine Centre. The SEARCH study was
funded by a programme grant from Cancer Research UK (C490/
A10124) and supported by the UK National Institute for Health
Research Biomedical Research Centre at the University of Cambridge. The SKKDKFZS study was supported by the DKFZ. The
SZBCS study was supported by Polish State Committee for Scientific
Research Grant PBZ_KBN_122/P05/2004. The TNBCC study was
supported by: a Specialized Program of Research Excellence
(SPORE) in Breast Cancer (CA116201), a grant from the Breast
Cancer Research Foundation, a generous gift from the David F. and
Margaret T. Grohne Family Foundation, the Stefanie Spielman Breast
Cancer fund and the OSU Comprehensive Cancer Center, the Hellenic Cooperative Oncology Group research grant (HR R_BG/04) and
the Greek General Secretary for Research and Technology (GSRT)
Program, Research Excellence II, the European Union (European
Social Fund—ESF), and Greek national funds through the Operational Program ‘‘Education and Lifelong Learning’’ of the National
Strategic Reference Framework (NSRF)—ARISTEIA. The UKBGS
study was funded by Breast Cancer Now and the Institute of Cancer
Research (ICR), London. ICR acknowledged NHS funding to the
NIHR Biomedical Research Centre. The kConFab study was supported by a grant from the National Breast Cancer Foundation, and
previously by the National Health and Medical Research Council
(NHMRC), the Queensland Cancer Fund, the Cancer Councils of
New South Wales, Victoria, Tasmania and South Australia, and the
Cancer Foundation of Western Australia. Financial support for the
Hum Genet
AOCS was provided by the United States Army Medical Research
and Materiel Command (DAMD17-01-1-0729), Cancer Council
Victoria, Queensland Cancer Fund, Cancer Council New South
Wales, Cancer Council South Australia, the Cancer Foundation of
Western Australia, Cancer Council Tasmania and the National Health
and Medical Research Council of Australia (NHMRC; 400413,
400281, 199600). The pKARMA study was supported by Maărit and
Hans Rausings Initiative Against Breast Cancer.
Open Access This article is distributed under the terms of the
Creative Commons Attribution 4.0 International License (http://crea
tivecommons.org/licenses/by/4.0/), which permits unrestricted use,
distribution, and reproduction in any medium, provided you give
appropriate credit to the original author(s) and the source, provide a
link to the Creative Commons license, and indicate if changes were
made.
References
Abecasis GR, Auton A, Brooks LD, DePristo MA, Durbin RM,
Handsaker RE, Kang HM, Marth GT, McVean GA (2012) An
integrated map of genetic variation from 1,092 human genomes.
Nature 491:56–65. doi:10.1038/nature11632
Aliper AM, Frieden-Korovkina VP, Buzdin A, Roumiantsev SA,
Zhavoronkov A (2014) Interactome analysis of myeloid-derived
suppressor cells in murine models of colon and breast cancer.
Oncotarget 5:11345–11353
Bai L, Deng X, Li Q, Wang M, An W, Deli A, Gao Z, Xie Y, Dai Y,
Cong YS (2012) Down-regulation of the cavin family proteins in
breast cancer. J Cell Biochem 113:322–328. doi:10.1002/jcb.23358
Barrett JC, Fry B, Maller J, Daly MJ (2005) Haploview: analysis and
visualization of LD and haplotype maps. Bioinformatics
21:263–265. doi:10.1093/bioinformatics/bth457
Barrett JC, Hansoul S, Nicolae DL, Cho JH, Duerr RH, Rioux JD,
Brant SR, Silverberg MS, Taylor KD, Barmada MM, Bitton A,
Dassopoulos T, Datta LW, Green T, Griffiths AM, Kistner EO,
Murtha MT, Regueiro MD, Rotter JI, Schumm LP, Steinhart AH,
Targan SR, Xavier RJ, Libioulle C, Sandor C, Lathrop M,
Belaiche J, Dewit O, Gut I, Heath S, Laukens D, Mni M,
Rutgeerts P, Van Gossum A, Zelenika D, Franchimont D, Hugot
JP, de Vos M, Vermeire S, Louis E, Cardon LR, Anderson CA,
Drummond H, Nimmo E, Ahmad T, Prescott NJ, Onnie CM,
Fisher SA, Marchini J, Ghori J, Bumpstead S, Gwilliam R,
Tremelling M, Deloukas P, Mansfield J, Jewell D, Satsangi J,
Mathew CG, Parkes M, Georges M, Daly MJ (2008) Genomewide association defines more than 30 distinct susceptibility loci
for Crohn’s disease. Nat Genet 40:955–962. doi:10.1038/ng.175
Bates GJ, Fox SB, Han C, Leek RD, Garcia JF, Harris AL, Banham
AH (2006) Quantification of regulatory T cells enables the
identification of high-risk breast cancer patients and those at risk
of late relapse. J Clin Oncol 24:5373–5380. doi:10.1200/jco.
2006.05.9584
Biernacka JM, Jenkins GD, Wang L, Moyer AM, Fridley BL (2012)
Use of the gamma method for self-contained gene-set analysis of
SNP data. Eur J Hum Genet 20:565–571. doi:10.1038/ejhg.2011.
236
Breast Cancer Association Consortium. e.
medschl.cam.ac.uk/consortia/bcac/. Accessed 19 May 2015
Chadda R, Mayor S (2008) PTRF triggers a cave in. Cell 132:23–24.
doi:10.1016/j.cell.2007.12.021
Chang WC, Li CH, Huang SC, Chang DY, Chou LY, Sheu BC (2010)
Clinical significance of regulatory T cells and CD8? effector
populations in patients with human endometrial carcinoma.
Cancer 116:5777–5788. doi:10.1002/cncr.25371
Chen B, Wilkening S, Drechsel M, Hemminki K (2009) SNP_tools: a
compact tool package for analysis and conversion of genotype
data for MS-Excel. BMC Res Note 2:214. doi:10.1186/17560500-2-214
Cheng F, Wang HW, Cuenca A, Huang M, Ghansah T, Brayer J, Kerr
WG, Takeda K, Akira S, Schoenberger SP, Yu H, Jove R,
Sotomayor EM (2003) A critical role for Stat3 signaling in
immune tolerance. Immunity 19:425–436
Cheng P, Corzo CA, Luetteke N, Yu B, Nagaraj S, Bui MM, Ortiz M,
Nacken W, Sorg C, Vogl T, Roth J, Gabrilovich DI (2008)
Inhibition of dendritic cell differentiation and accumulation of
myeloid-derived suppressor cells in cancer is regulated by
S100A9 protein. J Exp Med 205:2235–2249. doi:10.1084/jem.
20080132
DeNardo DG, Coussens LM (2007) Inflammation and breast cancer.
Balancing immune response: crosstalk between adaptive and
innate immune cells during breast cancer progression. Breast
Cancer Res 9:212. doi:10.1186/bcr1746
DeNardo DG, Andreu P, Coussens LM (2010) Interactions between
lymphocytes and myeloid cells regulate pro- versus anti-tumor
immunity. Cancer Metastasis Rev 29:309–316. doi:10.1007/
s10555-010-9223-6
Driessens G, Kline J, Gajewski TF (2009) Costimulatory and
coinhibitory receptors in anti-tumor immunity. Immunol Rev
229:126–144. doi:10.1111/j.1600-065X.2009.00771.x
Franke A, Balschun T, Karlsen TH, Hedderich J, May S, Lu T,
Schuldt D, Nikolaus S, Rosenstiel P, Krawczak M, Schreiber S
(2008) Replication of signals from recent studies of Crohn’s
disease identifies previously unknown disease loci for ulcerative
colitis. Nat Genet 40:713–715. doi:10.1038/ng.148
French JD, Ghoussaini M, Edwards SL, Meyer KB, Michailidou K,
Ahmed S, Khan S, Maranian MJ, O’Reilly M, Hillman KM,
Betts JA, Carroll T, Bailey PJ, Dicks E, Beesley J, Tyrer J, Maia
AT, Beck A, Knoblauch NW, Chen C, Kraft P, Barnes D,
Gonzalez-Neira A, Alonso MR, Herrero D, Tessier DC, Vincent
D, Bacot F, Luccarini C, Baynes C, Conroy D, Dennis J, Bolla
MK, Wang Q, Hopper JL, Southey MC, Schmidt MK, Broeks A,
Verhoef S, Cornelissen S, Muir K, Lophatananon A, StewartBrown S, Siriwanarangsan P, Fasching PA, Loehberg CR, Ekici
AB, Beckmann MW, Peto J, dos Santos Silva I, Johnson N,
Aitken Z, Sawyer EJ, Tomlinson I, Kerin MJ, Miller N, Marme
F, Schneeweiss A, Sohn C, Burwinkel B, Guenel P, Truong T,
Laurent-Puig P, Menegaux F, Bojesen SE, Nordestgaard BG,
Nielsen SF, Flyger H, Milne RL, Zamora MP, Arias Perez JI,
Benitez J, Anton-Culver H, Brenner H, Muller H, Arndt V,
Stegmaier C, Meindl A, Lichtner P, Schmutzler RK, Engel C,
Brauch H, Hamann U, Justenhoven C, Aaltonen K, Heikkila P,
Aittomaki K, Blomqvist C, Matsuo K, Ito H, Iwata H, Sueta A,
Bogdanova NV, Antonenkova NN, Dork T, Lindblom A,
Margolin S, Mannermaa A, Kataja V, Kosma VM et al (2013)
Functional variants at the 11q13 risk locus for breast cancer
regulate cyclin D1 expression through long-range enhancers. Am
J Hum Genet 92:489–503. doi:10.1016/j.ajhg.2013.01.002
Gabrilovich DI, Nagaraj S (2009) Myeloid-derived suppressor cells as
regulators of the immune system. Nat Rev Immunol 9:162–174.
doi:10.1038/nri2506
Gad E, Rastetter L, Slota M, Koehnlein M, Treuting PM, Dang Y,
Stanton S, Disis ML (2014) Natural history of tumor growth and
immune modulation in common spontaneous murine mammary
tumor models. Breast Cancer Res Treat 148:501–510. doi:10.
1007/s10549-014-3199-9
GLOBOCAN 2012: Estimated Cancer Incidence, Mortality and
Prevalence Worldwide in 2012. International Agency for
123
Hum Genet
Research on Cancer. />Accessed 9 Apr 2015
Hanahan D, Weinberg RA (2011) Hallmarks of cancer: the next
generation. Cell 144:646–674. doi:10.1016/j.cell.2011.02.013
Howie BN, Donnelly P, Marchini J (2009) A flexible and accurate
genotype imputation method for the next generation of genomewide association studies. PLoS Genet 5:e1000529. doi:10.1371/
journal.pgen.1000529
Howie B, Fuchsberger C, Stephens M, Marchini J, Abecasis GR
(2012) Fast and accurate genotype imputation in genome-wide
association studies through pre-phasing. Nat Genet 44:955–959.
doi:10.1038/ng.2354
International HapMap Project. Accessed 26
Mar 2015
Jakkula E, Leppa V, Sulonen AM, Varilo T, Kallio S, Kemppinen A,
Purcell S, Koivisto K, Tienari P, Sumelahti ML, Elovaara I,
Pirttila T, Reunanen M, Aromaa A, Oturai AB, Sondergaard HB,
Harbo HF, Mero IL, Gabriel SB, Mirel DB, Hauser SL, Kappos
L, Polman C, De Jager PL, Hafler DA, Daly MJ, Palotie A,
Saarela J, Peltonen L (2010) Genome-wide association study in a
high-risk isolate for multiple sclerosis reveals associated variants
in STAT3 gene. Am J Hum Genet 86:285–291. doi:10.1016/j.
ajhg.2010.01.017
Jostins L, Ripke S, Weersma RK, Duerr RH, McGovern DP, Hui KY,
Lee JC, Schumm LP, Sharma Y, Anderson CA, Essers J,
Mitrovic M, Ning K, Cleynen I, Theatre E, Spain SL,
Raychaudhuri S, Goyette P, Wei Z, Abraham C, Achkar JP,
Ahmad T, Amininejad L, Ananthakrishnan AN, Andersen V,
Andrews JM, Baidoo L, Balschun T, Bampton PA, Bitton A,
Boucher G, Brand S, Buning C, Cohain A, Cichon S, D’Amato
M, De Jong D, Devaney KL, Dubinsky M, Edwards C,
Ellinghaus D, Ferguson LR, Franchimont D, Fransen K, Gearry
R, Georges M, Gieger C, Glas J, Haritunians T, Hart A, Hawkey
C, Hedl M, Hu X, Karlsen TH, Kupcinskas L, Kugathasan S,
Latiano A, Laukens D, Lawrance IC, Lees CW, Louis E, Mahy
G, Mansfield J, Morgan AR, Mowat C, Newman W, Palmieri O,
Ponsioen CY, Potocnik U, Prescott NJ, Regueiro M, Rotter JI,
Russell RK, Sanderson JD, Sans M, Satsangi J, Schreiber S,
Simms LA, Sventoraityte J, Targan SR, Taylor KD, Tremelling
M, Verspaget HW, De Vos M, Wijmenga C, Wilson DC,
Winkelmann J, Xavier RJ, Zeissig S, Zhang B, Zhang CK, Zhao
H, Silverberg MS, Annese V, Hakonarson H, Brant SR, RadfordSmith G, Mathew CG, Rioux JD, Schadt EE et al (2012) Hostmicrobe interactions have shaped the genetic architecture of
inflammatory bowel disease. Nature 491:119–124. doi:10.1038/
nature11582
Kim ST, Jeong H, Woo OH, Seo JH, Kim A, Lee ES, Shin SW, Kim
YH, Kim JS, Park KH (2013) Tumor-infiltrating lymphocytes,
tumor characteristics, and recurrence in patients with early breast
cancer. Am J Clin Oncol 36:224–231. doi:10.1097/COC.
0b013e3182467d90
Kortylewski M, Kujawski M, Wang T, Wei S, Zhang S, PilonThomas S, Niu G, Kay H, Mule J, Kerr WG, Jove R, Pardoll D,
Yu H (2005) Inhibiting Stat3 signaling in the hematopoietic
system elicits multicomponent antitumor immunity. Nat Med
11:1314–1321. doi:10.1038/nm1325
Kortylewski M, Xin H, Kujawski M, Lee H, Liu Y, Harris T, Drake
C, Pardoll D, Yu H (2009) Regulation of the IL-23 and IL-12
balance by Stat3 signaling in the tumor microenvironment.
Cancer Cell 15:114–123. doi:10.1016/j.ccr.2008.12.018
Krieg C, Boyman O (2009) The role of chemokines in cancer immune
surveillance by the adaptive immune system. Semin Cancer Biol
19:76–83. doi:10.1016/j.semcancer.2008.10.011
Kujawski M, Kortylewski M, Lee H, Herrmann A, Kay H, Yu H
(2008) Stat3 mediates myeloid cell-dependent tumor angiogenesis in mice. J Clin Invest 118:3367–3377. doi:10.1172/jci35213
123
Lindau D, Gielen P, Kroesen M, Wesseling P, Adema GJ (2013) The
immunosuppressive tumour network: myeloid-derived suppressor cells, regulatory T cells and natural killer T cells. Immunology 138:105–115. doi:10.1111/imm.12036
Liu F, Li Y, Ren M, Zhang X, Guo X, Lang R, Gu F, Fu L (2012a)
Peritumoral FOXP3(?) regulatory T cell is sensitive to
chemotherapy while intratumoral FOXP3(?) regulatory T cell
is prognostic predictor of breast cancer patients. Breast Cancer
Res Treat 135:459–467. doi:10.1007/s10549-012-2132-3
Liu LY, Chang LY, Kuo WH, Hwa HL, Lin YS, Huang SF, Chen CN,
Chang KJ, Hsieh FJ (2012b) Major Functional Transcriptome of
an Inferred Center Regulator of an ER(-) Breast Cancer Model
System. Cancer Inform 11:87–111. doi:10.4137/cin.s8633
Long JC, Williams RC, Urbanek M (1995) An E-M algorithm and
testing strategy for multiple-locus haplotypes. Am J Hum Genet
56:799–810
Matsumura Y, Kobayashi T, Ichiyama K, Yoshida R, Hashimoto M,
Takimoto T, Tanaka K, Chinen T, Shichita T, Wyss-Coray T,
Sato K, Yoshimura A (2007) Selective expansion of foxp3positive regulatory T cells and immunosuppression by suppressors of cytokine signaling 3-deficient dendritic cells. J Immunol
179:2170–2179
Michailidou K, Hall P, Gonzalez-Neira A, Ghoussaini M, Dennis J,
Milne RL, Schmidt MK, Chang-Claude J, Bojesen SE, Bolla
MK, Wang Q, Dicks E, Lee A, Turnbull C, Rahman N, Fletcher
O, Peto J, Gibson L, Dos Santos Silva I, Nevanlinna H, Muranen
TA, Aittomaki K, Blomqvist C, Czene K, Irwanto A, Liu J,
Waisfisz Q, Meijers-Heijboer H, Adank M, van der Luijt RB,
Hein R, Dahmen N, Beckman L, Meindl A, Schmutzler RK,
Muller-Myhsok B, Lichtner P, Hopper JL, Southey MC, Makalic
E, Schmidt DF, Uitterlinden AG, Hofman A, Hunter DJ,
Chanock SJ, Vincent D, Bacot F, Tessier DC, Canisius S,
Wessels LF, Haiman CA, Shah M, Luben R, Brown J, Luccarini
C, Schoof N, Humphreys K, Li J, Nordestgaard BG, Nielsen SF,
Flyger H, Couch FJ, Wang X, Vachon C, Stevens KN,
Lambrechts D, Moisse M, Paridaens R, Christiaens MR,
Rudolph A, Nickels S, Flesch-Janys D, Johnson N, Aitken Z,
Aaltonen K, Heikkinen T, Broeks A, Veer LJ, van der Schoot
CE, Guenel P, Truong T, Laurent-Puig P, Menegaux F, Marme
F, Schneeweiss A, Sohn C, Burwinkel B, Zamora MP, Perez JI,
Pita G, Alonso MR, Cox A, Brock IW, Cross SS, Reed MW,
Sawyer EJ, Tomlinson I, Kerin MJ, Miller N, Henderson BE et al
(2013) Large-scale genotyping identifies 41 new loci associated
with breast cancer risk. Nat Genet 45:353–361. doi:10.1038/ng.
2563 (361e1-2)
Michailidou K, Beesley J, Lindstrom S, Canisius S, Dennis J, Lush
MJ, Maranian MJ, Bolla MK, Wang Q, Shah M, Perkins BJ,
Czene K, Eriksson M, Darabi H, Brand JS, Bojesen SE,
Nordestgaard BG, Flyger H, Nielsen SF, Rahman N, Turnbull
C, Fletcher O, Peto J, Gibson L, Dos-Santos-Silva I, ChangClaude J, Flesch-Janys D, Rudolph A, Eilber U, Behrens S,
Nevanlinna H, Muranen TA, Aittomaki K, Blomqvist C, Khan S,
Aaltonen K, Ahsan H, Kibriya MG, Whittemore AS, John EM,
Malone KE, Gammon MD, Santella RM, Ursin G, Makalic E,
Schmidt DF, Casey G, Hunter DJ, Gapstur SM, Gaudet MM,
Diver WR, Haiman CA, Schumacher F, Henderson BE, Le
Marchand L, Berg CD, Chanock SJ, Figueroa J, Hoover RN,
Lambrechts D, Neven P, Wildiers H, van Limbergen E, Schmidt
MK, Broeks A, Verhoef S, Cornelissen S, Couch FJ, Olson JE,
Hallberg E, Vachon C, Waisfisz Q, Meijers-Heijboer H, Adank
MA, van der Luijt RB, Li J, Liu J, Humphreys K, Kang D, Choi
JY, Park SK, Yoo KY, Matsuo K, Ito H, Iwata H, Tajima K,
Guenel P, Truong T, Mulot C, Sanchez M, Burwinkel B, Marme
F, Surowy H, Sohn C, Wu AH, Tseng CC, Van Den Berg D,
Stram DO, Gonzalez-Neira A, Benitez J et al (2015) Genomewide association analysis of more than 120,000 individuals
Hum Genet
identifies 15 new susceptibility loci for breast cancer. Nat Genet
47:373–380. doi:10.1038/ng.3242
Michel S, Benner A, Tariverdian M, Wentzensen N, Hoefler P,
Pommerencke T, Grabe N, von Knebel Doeberitz M, Kloor M
(2008) High density of FOXP3-positive T cells infiltrating
colorectal cancers with microsatellite instability. Br J Cancer
99:1867–1873. doi:10.1038/sj.bjc.6604756
Mills KH (2004) Regulatory T cells: friend or foe in immunity to
infection? Nat Rev Immunol 4:841–855. doi:10.1038/nri1485
Okada Y, Terao C, Ikari K, Kochi Y, Ohmura K, Suzuki A,
Kawaguchi T, Stahl EA, Kurreeman FA, Nishida N, Ohmiya H,
Myouzen K, Takahashi M, Sawada T, Nishioka Y, Yukioka M,
Matsubara T, Wakitani S, Teshima R, Tohma S, Takasugi K,
Shimada K, Murasawa A, Honjo S, Matsuo K, Tanaka H, Tajima
K, Suzuki T, Iwamoto T, Kawamura Y, Tanii H, Okazaki Y,
Sasaki T, Gregersen PK, Padyukov L, Worthington J, Siminovitch KA, Lathrop M, Taniguchi A, Takahashi A, Tokunaga
K, Kubo M, Nakamura Y, Kamatani N, Mimori T, Plenge RM,
Yamanaka H, Momohara S, Yamada R, Matsuda F, Yamamoto
K (2012) Meta-analysis identifies nine new loci associated with
rheumatoid arthritis in the Japanese population. Nat Genet
44:511–516. doi:10.1038/ng.2231
Okada Y, Wu D, Trynka G, Raj T, Terao C, Ikari K, Kochi Y,
Ohmura K, Suzuki A, Yoshida S, Graham RR, Manoharan A,
Ortmann W, Bhangale T, Denny JC, Carroll RJ, Eyler AE,
Greenberg JD, Kremer JM, Pappas DA, Jiang L, Yin J, Ye L, Su
DF, Yang J, Xie G, Keystone E, Westra HJ, Esko T, Metspalu A,
Zhou X, Gupta N, Mirel D, Stahl EA, Diogo D, Cui J, Liao K,
Guo MH, Myouzen K, Kawaguchi T, Coenen MJ, van Riel PL,
van de Laar MA, Guchelaar HJ, Huizinga TW, Dieude P,
Mariette X, Bridges SL Jr, Zhernakova A, Toes RE, Tak PP,
Miceli-Richard C, Bang SY, Lee HS, Martin J, Gonzalez-Gay
MA, Rodriguez-Rodriguez L, Rantapaa-Dahlqvist S, Arlestig L,
Choi HK, Kamatani Y, Galan P, Lathrop M, Eyre S, Bowes J,
Barton A, de Vries N, Moreland LW, Criswell LA, Karlson EW,
Taniguchi A, Yamada R, Kubo M, Liu JS, Bae SC, Worthington
J, Padyukov L, Klareskog L, Gregersen PK, Raychaudhuri S,
Stranger BE, De Jager PL, Franke L, Visscher PM, Brown MA,
Yamanaka H, Mimori T, Takahashi A, Xu H, Behrens TW,
Siminovitch KA, Momohara S, Matsuda F, Yamamoto K, Plenge
RM (2014) Genetics of rheumatoid arthritis contributes to
biology and drug discovery. Nature 506:376–381. doi:10.1038/
nature12873
Ostrand-Rosenberg S (2008) Immune surveillance: a balance between
protumor and antitumor immunity. Curr Opin Genet Dev
18:11–18. doi:10.1016/j.gde.2007.12.007
Ostrand-Rosenberg S, Sinha P (2009) Myeloid-derived suppressor
cells: linking inflammation and cancer. J Immunol 182:4499–
4506. doi:10.4049/jimmunol.0802740
Parker DC (1993) T cell-dependent B cell activation. Annu Rev
Immunol 11:331–360. doi:10.1146/annurev.iy.11.040193.001555
Patsopoulos NA, Esposito F, Reischl J, Lehr S, Bauer D, Heubach J,
Sandbrink R, Pohl C, Edan G, Kappos L, Miller D, Montalban J,
Polman CH, Freedman MS, Hartung HP, Arnason BG, Comi G,
Cook S, Filippi M, Goodin DS, Jeffery D, O’Connor P, Ebers
GC, Langdon D, Reder AT, Traboulsee A, Zipp F, Schimrigk S,
Hillert J, Bahlo M, Booth DR, Broadley S, Brown MA,
Browning BL, Browning SR, Butzkueven H, Carroll WM,
Chapman C, Foote SJ, Griffiths L, Kermode AG, Kilpatrick TJ,
Lechner-Scott J, Marriott M, Mason D, Moscato P, Heard RN,
Pender MP, Perreau VM, Perera D, Rubio JP, Scott RJ, Slee M,
Stankovich J, Stewart GJ, Taylor BV, Tubridy N, Willoughby E,
Wiley J, Matthews P, Boneschi FM, Compston A, Haines J,
Hauser SL, McCauley J, Ivinson A, Oksenberg JR, PericakVance M, Sawcer SJ, De Jager PL, Hafler DA, de Bakker PI
(2011) Genome-wide meta-analysis identifies novel multiple
sclerosis susceptibility loci. Ann Neurol 70:897–912. doi:10.
1002/ana.22609
Poschke I, Mougiakakos D, Kiessling R (2011) Camouflage and
sabotage: tumor escape from the immune system. Cancer
Immunol Immunother 60:1161–1171. doi:10.1007/s00262-0111012-8
Pruim RJ, Welch RP, Sanna S, Teslovich TM, Chines PS, Gliedt TP,
Boehnke M, Abecasis GR, Willer CJ (2010) LocusZoom:
regional visualization of genome-wide association scan results.
Bioinformatics 26:2336–2337. doi:10.1093/bioinformatics/
btq419
Purcell S, Neale B, Todd-Brown K, Thomas L, Ferreira MA, Bender
D, Maller J, Sklar P, de Bakker PI, Daly MJ, Sham PC (2007)
PLINK: a tool set for whole-genome association and populationbased linkage analyses. Am J Hum Genet 81:559–575. doi:10.
1086/519795
Reisfeld RA (2013) The tumor microenvironment: a target for
combination therapy of breast cancer. Crit Rev Oncog
18:115–133
Rhie SK, Coetzee SG, Noushmehr H, Yan C, Kim JM, Haiman CA,
Coetzee GA (2013) Comprehensive functional annotation of
seventy-one breast cancer risk Loci. PLoS One 8:e63925. doi:10.
1371/journal.pone.0063925
Sakaguchi S, Vignali DA, Rudensky AY, Niec RE, Waldmann H
(2013) The plasticity and stability of regulatory T cells. Nat Rev
Immunol 13:461–467. doi:10.1038/nri3464
Sawcer S, Hellenthal G, Pirinen M, Spencer CC, Patsopoulos NA,
Moutsianas L, Dilthey A, Su Z, Freeman C, Hunt SE, Edkins S,
Gray E, Booth DR, Potter SC, Goris A, Band G, Oturai AB,
Strange A, Saarela J, Bellenguez C, Fontaine B, Gillman M,
Hemmer B, Gwilliam R, Zipp F, Jayakumar A, Martin R, Leslie
S, Hawkins S, Giannoulatou E, D’Alfonso S, Blackburn H,
Martinelli Boneschi F, Liddle J, Harbo HF, Perez ML, Spurkland
A, Waller MJ, Mycko MP, Ricketts M, Comabella M, Hammond
N, Kockum I, McCann OT, Ban M, Whittaker P, Kemppinen A,
Weston P, Hawkins C, Widaa S, Zajicek J, Dronov S, Robertson
N, Bumpstead SJ, Barcellos LF, Ravindrarajah R, Abraham R,
Alfredsson L, Ardlie K, Aubin C, Baker A, Baker K, Baranzini
SE, Bergamaschi L, Bergamaschi R, Bernstein A, Berthele A,
Boggild M, Bradfield JP, Brassat D, Broadley SA, Buck D,
Butzkueven H, Capra R, Carroll WM, Cavalla P, Celius EG,
Cepok S, Chiavacci R, Clerget-Darpoux F, Clysters K, Comi G,
Cossburn M, Cournu-Rebeix I, Cox MB, Cozen W, Cree BA,
Cross AH, Cusi D, Daly MJ, Davis E, de Bakker PI, Debouverie
M, D’Hooghe MB, Dixon K, Dobosi R, Dubois B, Ellinghaus D,
Elovaara I, Esposito F et al (2011) Genetic risk and a primary
role for cell-mediated immune mechanisms in multiple sclerosis.
Nature 476:214–219. doi:10.1038/nature10251
Serafini P, Carbley R, Noonan KA, Tan G, Bronte V, Borrello I
(2004) High-dose granulocyte-macrophage colony-stimulating
factor-producing vaccines impair the immune response through
the recruitment of myeloid suppressor cells. Cancer Res
64:6337–6343. doi:10.1158/0008-5472.can-04-0757
Sica A, Larghi P, Mancino A, Rubino L, Porta C, Totaro MG,
Rimoldi M, Biswas SK, Allavena P, Mantovani A (2008)
Macrophage polarization in tumour progression. Semin Cancer
Biol 18:349–355. doi:10.1016/j.semcancer.2008.03.004
The Cancer Genome Atlas. />Accessed 1 Apr 2015
The Genotype-Tissue Expression Portal. />home/. Accessed 19 Oct 2015
UCSC Genome Browser. />hgGateway?redirect=manual&source=genome.ucsc.edu. Accessed 19 Oct 2015
Ward LD, Kellis M (2012) HaploReg: a resource for exploring
chromatin states, conservation, and regulatory motif alterations
123
Hum Genet
within sets of genetically linked variants. Nucleic Acid Res
40:D930–D934. doi:10.1093/nar/gkr917
Watanabe Y, Kinoshita A, Yamada T, Ohta T, Kishino T, Matsumoto
N, Ishikawa M, Niikawa N, Yoshiura K (2002) A catalog of 106
single-nucleotide polymorphisms (SNPs) and 11 other types of
variations in genes for transforming growth factor-beta1 (TGFbeta1) and its signaling pathway. J Hum Genet 47:478–483.
doi:10.1007/s100380200069
Wilczynski JR, Duechler M (2010) How do tumors actively escape
from host immunosurveillance? Arch Immunol Ther Exp
(Warsz) 58:435–448. doi:10.1007/s00005-010-0102-1
Yamazaki K, Umeno J, Takahashi A, Hirano A, Johnson TA,
Kumasaka N, Morizono T, Hosono N, Kawaguchi T, Takazoe
M, Yamada T, Suzuki Y, Tanaka H, Motoya S, Hosokawa M,
Arimura Y, Shinomura Y, Matsui T, Matsumoto T, Iida M,
Tsunoda T, Nakamura Y, Kamatani N, Kubo M (2013) A
123
genome-wide association study identifies 2 susceptibility Loci
for Crohn’s disease in a Japanese population. Gastroenterology
144:781–788. doi:10.1053/j.gastro.2012.12.021
Yang L, Pang Y, Moses HL (2010) TGF-beta and immune cells: an
important regulatory axis in the tumor microenvironment and
progression. Trends Immunol 31:220–227. doi:10.1016/j.it.2010.
04.002
Yu H, Pardoll D, Jove R (2009) STATs in cancer inflammation and
immunity: a leading role for STAT3. Nat Rev Cancer
9:798–809. doi:10.1038/nrc2734
Zitvogel L, Tesniere A, Kroemer G (2006) Cancer despite immunosurveillance: immunoselection and immunosubversion. Nat Rev
Immunol 6:715–727. doi:10.1038/nri1936
Zou W (2005) Immunosuppressive networks in the tumour environment and their therapeutic relevance. Nat Rev Cancer
5:263–274. doi:10.1038/nrc1586