Application of molecular marker start codon target (scot) in individual identification of cat hoa loc mango (mangifera indica l)
Bạn đang xem bản rút gọn của tài liệu. Xem và tải ngay bản đầy đủ của tài liệu tại đây (2.77 MB, 43 trang )
NGUYEN TAT THANH
UNIVERSITY
/TVgaSV*
NGUYEN TAT THANH
True learning - True practice - True success - True future
FACULTY OF BIOTECHNOLOGY
GRADUATION THESIS
APPLICATION OF MOLECULAR MARKER:
START CODON TARGET (SCOT) IN
INDIVIDUAL IDENTIFICATION OF CAT HOA
LOC MANGO (Mangifera indica L)
Student’s name
: Pham Thi Hoa Mai
Student ID
:1611540685
Supervisor
: MSc. Nguyen Thi Nha
Ho Chi Minh City, 2020
TABLE OF CONTENTS
ACKNOWLEDGEMENTS.................................................................................................. i
TABLE OF CONTENTS..................................................................................................... ii
ABSTRACT...........................................................................................................................iv
LIST OF FIGURES............................................................................................................... V
LIST OF TABLES................................................................................................................ vi
LIST OF ACRONYMS...................................................................................................... vii
INTRODUCTION............................................................................................................. viii
CHAPTER 1. LITERATURE REVIEW........................................................................ 1
1.1 Introduction of Cat Hoa Loc Mango tree..................................................................... 1
1.1.1 Ecological characteristics............................................................................................ 1
1.1.2 Distribution place.........................................................................................................2
1.1.3 The values of Cat Hoa Loc mango.............................................................................2
1.2 Techniques used in research.......................................................................................... 3
1.2.1 Molecular marker technique........................................................................................3
1.2.2 Molecular marker SCoT..............................................................................................3
1.3 Research situation of SCoT molecular indicator and application of molecular
indicator in individual identification..................................................................................... 4
1.3.1 Studies ofSCoT directive application....................................................................... 4
1.3.2 Application of molecular markers in individual identification.............................. 7
CHAPTER 2. CONTENTS AND METHODS............................................................. 9
2.1 Place of administration....................................................................................................9
2.2 Contents............................................................................................................................ 9
2.3 Methods............................................................................................................................ 9
ii
2.3.1 DNA extraction............................................................................................................ 9
2.3.2 Screening polymorphic SCoT markers................................................................... 12
2.3.3 PCR data analysis....................................................................................................... 14
CHAPTER 3. RESULTS AND DISCUSSION............................................................17
3.1 Sample collection.......................................................................................................... 17
3.2 DNA extraction.............................................................................................................. 20
3.3 Evaluate the polymorphism of 27 primers on 15 individuals of Hoa Loc mango ..21
3.4 Identify specific DNA bands to demonstrate certain individuals...........................27
CONCLUSIONS AND RECOMMENDATION .......................................................... 29
REFERENCES.................................................................................................................... 30
APPENDICES...................................................................................................................... 32
iii
ABSTRACT
The study “Application of molecular marker: start Codon Target (SCoT) in
individual identification of Cat Hoa Loc mango (Mangiferaindica £)" was carried out
from October 2019 to July 2020 in Molecular Biology lab, Faculty of Biotechnology,
Nguyen Tat Thanh Univerisity with an aim to based on Start Codon Target (SCoT)
marker system.
A total of 15 Cat Hoa Loc mango cultivars included in the study were performed
DNA extraction, polymorphic selection, and amplification of SCoT markers, and
genetic diversity analysis using NTSYSpc software. The polymorphism of 27 primers
on 15 individuals of Hoa Loc mango was evaluated. The study resulted in the successful
identification of specific DNA bands for 15 individuals.
IV
LIST OF FIGURES
Figure 1.1 Picture of Cat Hoa Loc mango............................................................................ 1
Figure 2.1 Preparation and data entry in Microsoft Excel.............................................. 15
Figure 2.2 Example of similarity matrice of sample...................................................... 15
Figure 2.3 Example of dendrograms drawing (phylogenetic trees)..............................16
Figure 3.1 Total DNA on electrophoresis gel................................................................. 20
Figure 3.2 PCR products of SC0TO6, SCoT14, SC0TI8, and SC0T44 across 15 Cat
Hoa Loc mango cultivars......................................................................................................23
Figure 3.3 Similarity matrix of 27 polymorphic SCoT marker across 15 Hoa Loe
cultivars using SM coefficient............................................................................................. 24
Figure 3.4 Phylogenetic tree of 27 polymorphic SCoT marker across 15 Cat Hoa Loc
mango cultivars...................................................................................................................... 24
Figure 3.5 Similarity matrix of 27 polymorphic SCoT marker across 15 Hoa Loc
cultivars from SOFR1 using SM coefficient...................................................................... 26
Figure 3.6 Phylogenetic tree of 27 polymorphic SCoT marker across 15 Cat Hoa Loc
mango cultivars from SOFRI.............................................................................................. 26
Figure 3.7 PCR products of SCoT19 across 15 Cat Hoa Loc mango cultivars from
SOFRI..................................................................................................................................... 27
V
LIST OF TABLES
Table 2.1 Sequences of SCoT markers using in this study............................................. 12
Table 2.2 Component content of PCR reaction............................................................... 13
Table 2.3 PCR cycling conditions..................................................................................... 13
Table 3.1 List of mango cultivars using in this study....................................................17
Table 3.2 OD concentration of 15 DNA samples.......................................................... 20
Table 3.3 List of polymorphic SCoT markers selected..................................................22
Table 3.4 List of SCoT identified cultivars..................................................................... 27
vi
LIST OF ACRONYMS
bp
Base pair
DNA
Deoxyribonucleic acid
SCoT
Start Codon Target
UPGMA
Unweighted Pair Group Method with Arithmetic mean
Rnase
Ribonuclease
PLS
Plant Lysis buffer
PBB
Plant Binding buffer
PWB
Plant Wash buffer
EB
Elution Buffer
PCR
Polymerase Chain Reaction
uv
Ultraviolet
TBE
Tris-Borate - EDTA
OD
Optical Density
Vil
INTRODUCTION
1. Rationale for this thesis
Identifying varieties is very important in choosing which varieties of plants to take
the best advantages of the natural conditions and other resources of the region. The best
way to utilise that advantages is choosing the plants with the most favorable conditions
for them to nuture, develop, and produce high yields. Besides, identification of the
varieties is important to the management and exploitation of its use-value. Identifying
varieties with agronomic properties such as appearance observing, color, taste, ... still
faces with many difficulties and inaccuracy when identifying seed samples with similar
characteristics in shapes and sizes.
Molecular technology has appeared and become an effective application for the
selection of plant varieties, genomic, genetic diversity, and phylogenetic research in
many types of plants. Several crops such as tomato, rice, maize, wheat, soybean that are
resistant to pests, salinity, drought with high productivity have been successfully
selected with the help of molecular markers.
Currently, compared to other methods to evaluate genetic diversity, molecular
techniques help US to do the task easier and faster. More and more researches apply
molecular markers in the study of plant molecular genetics. In particular, the SCoT
molecular marker technique is a simple technique based on the PCR reaction of
amplifying DNA fragments that contain the ATG codon. SCoT advantages includes
highly polymorphic amplification which is related to functional genes, ability to perform
reactions without genetic information, and application in genetic diversity analysis, QTL
mapping as well as bulked segregant analysis.
The study of using SCoT on mangoes in Vietnam has been conducted, besides the
genetic grouping for 30 cultivar samples, this study has discovered some specific DNA
bands that can be used to identify individuals of mango.
Among the current mango varieties grown in Vietnam, Cat Hoa Loc mango
(Mangiferci indica L) is a fruit food favored by both its taste and the nutritional value.
This mango is high in nutrients such as calcium, potassium, carbohydrates,
phosphorus, magnesium, vitamins such as vitamins A, and c. Besides, Hoa Loc
viii
mango has a high economic value in exporting big markets such as the United States,
Singapore, China, Europe, Korea, Japan, Australia, New Zealand, etc. The
identification of Cat Hoa Loc mangoes is very crucial in the management and
exploitation of the use-value of Hoa Loc mangoes.
2. Objectives
The aim of this study is to identify specific DNA bands that identify certain
individuals and evaluate the polymorphism of 27 primers on 15 individuals of Hoa Loe
mango.
IX
Chapter 1. Literature review
CHAPTER 1. LITERATURE REVIEW
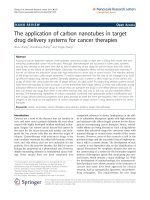
1.1 Introduction of Cat Hoa Loc Mango tree
Scientific name and location of Mango in the classification system:
Kingdom
Plantae
Phylum
Mangoliophyta
Class
Mangoliopsida
Order
Sapindales
Family
Anacardiaceae
Genus
Mangifera
Species
Itĩdica L
Figure 1 Picture of Cat Hoa
Loc mango
Hoa Loc mango was first grown in Hoa Loc village, Giao Duc district, Dinh Tuong
province in 1930 (now Hoa hamlet, Hoa Hung village, Cai Be district, Tien Giang
province).
Mango characteristics involve moderate growing plants, oblique branches,
umbrella-shaped canopy, oblong leaves, wavy leaf covers, pointed tail, 400 - 600 grams
in weight of fruit, oblong fruit, near-inflated stems, bright yellow skin when ripping, 28
- 32 mm in thick and fleshy fruit, 78 - 80 % edible fleshy rate, low fiber, firm and
smooth flesh, a sweet bar, Brix degree from 20 - 22 %, 105 - 120 days in flower-tofruit process from, good drought tolerance L
1.1.1 Ecological characteristics
Cat Hoa Loc Mango has average growth and development rate. Suitable soil is
alluvial soil in the riverside, rich in nutrients. Besides, Cat Hoa Loc mango can also be
grown on acidic or saline soils.
The appropriate temperature for growing Hoa Loc mangoes is between 18 - 35 °C
but still tolerant at temperatures of 0 °C and above 40 °C for several weeks. Terrain
altitude 1300 m, where precipitation is about 1000 mm or more, however, 2-4 month
drought period will help in fruiting better.
1
Chapter 1. Literature review
Prevent cardiovascular disease: Mango is an excellent fruit that provides vitamins
-
A, E, and selenium to the body and helps fight heart disease.
-
Improve memory: Mangoes contain glutamine acid, a substance known to
improve memory and keep brain cells active.
Enhance eyesight: The vitamin A component of mango will be an important
-
nutrient to develop the vision, prevent night blindness and dry eye.
-
Enhancing fertility,...
1.2 Techniques used in research
1.2.1 Molecular marker technique
Molecular markers are the kind of markers that indicate the gulfs between different
species based on the differences in their DNA, protein, and enzyme molecules.
Molecular markers are divided into several categories grounded on the differences in
methods and techniques in determining polymorphism.
DNA markers are the most widely used due to great varieties of them. DNA
markers are made up of different types of DNA mutations such as substitutions (point
mutations), rearrangements (addition or subtraction of nucleotides), or errors in
replicating adjacent DNA segments. DNA markers are not often located in transcription
areas.
DNA markers are widely used in kinds of studies involving genetic mapping,
breeding selection, evaluation of genetic diversity, cultivar identification, selection for
disease resistance traits, resistance to adverse environmental conditions, genetic studies
of yield and quality, and phylogenetics3.
1.2.2 Molecular marker SCoT
The Start Codon Targeted markers - SCoT is a DNA marker technique for
polymorphism detection grounded on PCR reaction with 15 to 18 nucleotide primers,
which were first published by Collard and Mackill in 2009, were designed based on high
conservation sequences around the ATG opening codon of plants4.
3
Chapter 1. Literature review
The SCoT marker has similarities with the Random Amplification of Polymorphic
DNA (RAPD) techniques and Inter Simple Sequence Repeat (ISSR) techniques because
all of them use only one DNA fragment for both forward and reverse primers 5.
The difference of SCoT technology from other techniques is that it uses the highly
conserved fragments around the ATG codon in the plant genome to perform PCR, which
makes the SCoT markers get high sensitivity for amplifying plant genes as well as being
able to relate to functional and specific plant genes. At the same time, SCoT markers
can be used to determine polymorphism at an individual level without genome
information of the species. Low - cost and easy - performed advantages are the points
that make SCoT more elite than other molecular markers.
The SCoT marker is published to be highly effective in applying quantitative trait
mapping (QTL map), bulked segregant analysis, especially in genetic diversity research.
SCoT can also be combined with RAPD and SSR markers at the same time in genetic
analysis in plants6.
The SCoT markers have been successfully implemented in analyzing genetic
diversity in many subjects including mango 4, sugar cane 7, wheat8, medicinal plants9,
and others.
1.3 Research situation of SCoT molecular indicator and application of molecular
indicator in individual identification
1.3.1 Studies of SCoT directive application
In 2009, SCoT was first designed and published by Collard and Mackill after they
realized the disadvantages of the RAPD markers such as genomic information
requirements and low - reproducible ability. The SCoT markers appeared to solve these
difficulties and were successfully tested on rice '°.
In 2013, Jian-Ming Wu at al. analyzed genetic diversity in sugarcane in China
based on the SCoT markers system. In this study, 20 SCoT primers were designed to
evaluate genetic diversity among 107 sugarcane varieties. These primers amplified 176
DNA band patterns, of which 163 polymorphic bands (92.85 %). The value of genetic
polymorphism (PIC) ranges from 0.783 to 0.907 with an average value of 0.84. The
ƯPGMA method divided 107 sugarcane varieties into 6 groups with an average genetic
4
Chapter 1. Literature review
similarity coefficient at 0.674. High genetic diversity was found on three main sugarcane
cultivars including ROC22, ROC 16, and ROCIO (accounting for about 80 % of the total
sugarcane area in China). Results of genetic diversity among local sugarcane varieties
provides basic data for the management of sugarcane cultivars, as well as, development
of genetic collections, regional distribution, and grading 7.
In 2014, the SCoT marker system was used in determining fruit quality
characteristics and genetic comparative analysis between 20 mango varieties (15 local
varieties and 5 common varieties) in India. With 80 SCoT markers used, they
successfully selected 19 makers to amplify. These primers produced 117 bands on 20
samples with 96 polymorphic bands (79.57 %) with an average of 5.05 polymorphism
band per primer. 17 of 19 used primers created 34 cultivars - specific DNA fingerprints.
SCT40, SCoT45, and SCoT51 are the most informative in determining different types
of mango. 20 types of mangoes are divided into 2 main groups by the ƯPGMA method.
Three indigenous mango varieties including Khodi, Amrutiyo, Kaju, and Dasheri - a
popular mango variety are grouped into one group with a very low similarity of 11 %.
In the clustering pattern, indigenous cultivars - Kaju and Amrutiyo were grouped and
shared 37 % similarity with higher bootstrap values (63 %). This result confirms the
useful application of the SCoT marker system in determining varieties and analyzing
genetic diversity based on their biological characteristics 1'.
In 2015, Fahad Al - Qurainy chose the SCoT primers among various types of DNA
- based polymorphism markers to evaluate the genetic diversity of 6 palm crops in Saudi
Arabia. The results obtained from the polymorphic locus rate (PPL) at the population
level ranged from 3.28 to 13.11 with an average polymorphism value of 7.10. The
genetic diversity of Nei (h) and the Information index of Shannon (I) are 0.033 and 0.046
respectively. However, at the seed level, PPL, the genetic diversity of Nei (h) and the
information index of Shannon (I) are 42.62, 0.090, and 0.1555 respectively. The
ƯPGMA method divided six varieties into five main clusters with a genetic similarity
coefficient of 0.95 l2.
In 2016, Reza Talebi, Farzad Fayaz combined SCoT marker and other DNA -
based polymorphism marker (conserved DNA - derived polymorphism - CDDP) in the
5
Chapter 1. Literature review
study to evaluate genetic diversity and the relationship of Wheat varieties in Iran. 10
CDDP markers and 10 SCoT markers were used to analyze 38 varieties. When
conducting comparisons, the results demonstrated that both the CDDP and SCoT
markers were proved to be more effective than any type of markers and the polymorphic
values of the two markers are relatively similar. The average polymorphic value of
CDDP is 0.39, which is relatively higher than the polymorphic value of SCoT of 0.35.
Using Neighbor - Joining clustering, CDDP, and SCoT markers are used to construct
phylogenetic trees to arrange varieties in three and two main groups respectively. In this
study, CDDP markers have demonstrated more information in studying the genetic
diversity of wheat varieties. The results showed that CDDP and SCoT markers are useful
for analyzing the genetic diversity of wheat varieties 8.
In 2017, Xutian Chai selected the SCoT markers for the study of maximizing
effective sample size in assessing genetic diversity on the subject of vetch. In this study,
they investigated the minimum number of individuals that could represent the genetic
diversity of a single population. Two commercial varieties and two wild varieties were
evaluated using 5 SCoT primers and tested with different amounts of samples: 1, 2, 3,
5, 8, 10,20, 30,40, 50, and 60 individuals. The results showed that the number of alleles
and polymorphic information (PIC) differs between 4 varieties. Cluster analysis by
Unweighted Pair Group Method with Arithmetic Mean (UPGMA) and STRUCTURE
placed the 240 individuals into four distinct clusters. The Expected Heterozygosity (HE)
and PIC increased along with an increase in sampling size from 1 to 10 plants but did
not change significantly when the sample sizes exceeded 10 individuals At least 90 %
of genetic variants in four genotypes was represented when the sample size is 10. Finally,
Xutain Chai at al. concluded that 10 individuals can effectively represent the genetic
diversity of a Vetch population-based on SCoT markers. This study provides theoretical
support for genetic diversity, plant variety identification, evolution, and selection of
varieties that support the identification of common vetch varieties 5.
In 2018, Yan Guo at al recognized the status of Bletilla striata - a rare herbal plant
in China severely affected by excessive exploitation and destruction of natural habitats.
So he and his colleagues conducted a genetic diversity assessment on this subject by
6
Chapter 1. Literature review
combining two molecular markers systems consisting of SCoT and IRAP for exploiting
and utilizing the germplasm resources of Bletilla striata. The result of genetic diversity
across 50 Bletilla striata analyzed by SCoT and IRAP techniques showed that 20 SCoT
primers amplified a total of 209 bands with 201 polymorphisms bands (96.17 %); 8
IRAP primers produced 50 bands with 47 polymorphic bands (94 %). 50 samples of
Bletilla striata were divided into 2 main groups by 2 types of SCoT and IRAP markers
with a genetic similarity coefficient of 0.60 and 0.68 respectively. This showed the rich
genetic diversity among the Bletilla striata varieties from different areas as well as
provided useful information for resource protection work9.
1.3.2 Application of molecular markers in individual identification
There have been studies on the use of molecular markers in individual
identification such as:
SCoT and ISSR molecular markers were used to identify and analyze genetic
comparisons of 23 mango gene samples collected in China's Guangxi province.
Using 18 selective SCoT primers, 158 DNA bands were identified, of which
104 (65.82%) were polymorphic. The eighteen ISSR primers selected amplified
156 bands with 87 (55.77%) polymorphs. 23 varieties were classified into two
main groups based on SCoT analysis and three main groups based on ISSR
analysis with ƯPGMA 6.
Using 10 ISSR primers, from the DNA identification characteristics of 18
samples representing 6 potential avocado strains, based on the presence or
absence of characteristic bands, 9 single-molecule markers, and 25 markers
were identified, double molecule to identify these 06 lines. Provide the
necessary data for the avocado breeding and development in general and
identify the varieties with 6 potential avocado varieties 13.
The M12 has a clear polymorphism between the high sugar and low sugar group.
This SSR can be used to effectively identify high sugar cane varieties 14.
Using 31 SSR (Simple sequence repeats) to identify 382 varieties of cucumber
available in the China market by Target SSR-seq method. Genetic analysis
7
Chapter 1. Literature review
identified four populations: northern China, southern China, European and
Xishuangbanna l5.
The study used 42 superior soybean varieties in Indonesia analyzed with 14
fluorescent SSRs, identified 5 SSRs, namely Satt414, Satt 147, Satt3O8, Satt009,
and Satt516. This 5 SSR can be considered as ID of 42 soybean varieties in
Indonesia l6.
Use the EST - SSR marker set to authenticate the reality of all nine ginseng
plants registered in Korea l7.
8
Chapter 2. Contents and Methods
CHAPTER 2. CONTENTS AND METHODS
2.1 Place of administration
-
Location: Department of Plant Molecular Biology, Nguyen Tat Thanh
University.
-
Duration: 6 months, starting in October 2019.
2.2 Contents
-
Collection of 15 Cat Hoa Loc mango cultivars
-
Extraction of 15 DNA samples
-
Selection and amplification SCoT markers
-
Genetic diversity analyses of 15 Cat Hoa Loc mango cultivars using
NTSYSpc software (version 2.02)
2.3 Methods
2.3.1 DNA extraction
2.3.1.1 Collection of leaf samples
Sample collection location: Samples were collected in Southern Vietnam,
including 2 samples from Ben Tre, 9 samples from Tien Giang, 1 sample from Long An,
3 samples from Khanh Hoa, and 15 samples from Southern Horticultural Research
Institute (SOFRI).
Leaves sample: Leaves samples should be the 4th or 5th one from the top of the
branches.
Preliminary treatment of collected leaf samples: Leaves samples were washed
underwater. 70 % alcohol was used to wipe the leaves, which were then left in indoor
conditions to make them dry.
Samples preservation if not immediately extracted: the cleaned leaves samples
were placed into zip bags and labeled the sampling date and place, then stored in the
freezer at - 21 °C
9
Chapter 2. Contents and Methods
2.3.1.2 Total DNA extraction
To weigh the sample, the foil was put on the analytical balance, the scissors and
tweezers that have been disinfected were used to cut the leaf sample, each leaf samples
had an approximate weight of 100 mg. Then the leaf samples were separated into small
pieces and placed in 2.0 ml tubes to prepare for DNA extraction.
The method of total DNA extraction (according to ABT kit code HI - 123) includes
the following steps:
The liquid nitrogen was put into 2.0 ml tubes that already contained leaf sample,
the samples were then crushed with a glass rod until the samples were broken into a fine
powder.
Next, the extraction process was carried out according to the protocol attached to
the manufacturer's ABT Kit, including:
Step 1: Sample resolution:
-
400 pl PLS 1 solution was added into 2 ml tube (containing the sample to
extract) and then vortexed evenly.
-
10 pl Rnase was added, then lighten vortexed and incubated at 65 °C for 30
minutes until the cell is completely dissolved.
-
130 pl PLS 2 was added, then mixed completely and incubated for 5 minutes
on ice at 4 °C.
-
After incubation, tubes were centrifuged at maximum speed (15000 rpm) for 5
minutes and all floating fluids (about 450 pl) were sucked into 1.5 ml tube.
Step 2: DNA Attachment to the silica column:
-
675 pl PBB solution was added and stirred evenly at room temperature for 1 2 minutes.
-
Then, 600 pl floating fluid after adding PBB was transferred into the silica
column.
-
Silica columns were centrifuged at 11000 rpm.
-
The filtrates were removed, the silicas containing the solution were reused and
retained.
10
Chapter 2. Contents and Methods
-
Next, the silicas were centrifuged again with the amount of remaining mixture.
Step 3: Wash the column for the first time
-
500 pl PWB was transferred into the silica column.
-
The silicas were centrifuged at 11000 rpm for 1 minute.
-
The filtrates were removed, the silicas containing the solution were reused and
retained.
Step 5: Wash the column for the second time
-
500 pl PWB was transferred into the silica column.
-
The silicas were centrifuged at 11000 rpm for 1 minute.
-
The filtrates were removed, the silicas containing the solution were reused and
retained.
Step 6: Dry silica column
-
The silicas were centrifuged at 11000 rpm for 2 minutes.
-
The solution in the tubes was removed and silica columns were retained.
Step 7: DNA storage
-
Silica columns were transferred into 1.5 ml tube.
-
100 pl EB solution (incubated at 70 °C) was added to the silica column.
-
Centrifugal 11000 rounds in 2 minutes
Keep 1.5 ml tube and store - 20 °C if not used.
2.3.1.2 DNA quality testing
Qualitative testing of total DNA samples was carried out by the electrophoresis
method on 0.8 % standard agarose gel with a 6X red gel dye color. Results were shown
on electrophoresis gel with the appearance of bright bands indicating total DNA.
Quantify total DNA by OD system: Total DNA quantitative reactions were
conducted with 3 pl per reaction.
11
Chapter 2. Contents and Methods
2.3.2 Screening polymorphic SCoT markers
All of forty - six SCoT markers (Table 2.1) were utilized from researches of Luo 4,
Gajera ", Yan 9, and Yong 7 and purchased from PHUSA Biochem Co., Ltd.
Polymorphism Screening of SCoT markers with 15 Cat Hoa Loc mango cultivars were
carried out by PCR reaction 3 times for uniform thermal cycles (Table 2.2) and
components (Table 2.3). The DNA bands were scored only for clear and reproducible
ones which were not detected any new bands after 3 repeats.
Table 2.1 Sequences of SCoT markers using in this study 4’7’9’11
Primer
Sequence (5' to 3')
ID
Cite
Primer
from
ID
Sequence (5' to 3')
Cite
from
SCoTOl
CAACAATGGCTACCACCA
Luo
SCoT26
ACCATGGCTACCACCGTC
Gajera
SCoT02
CAACAATGGCTACCACCC
Gajera
SC0T27
ACCATGGCTACCACCGTG
Yong
SC0TO3
CAACAATGGCTACCACCG
Luo
SCoT28
CCATGGCTACCACCGCCA
Yong
SCoT04
CAACAATGGCTACCACCT
Yan
SCoT30
CCATGGCTACCACCGGCG
Yan
SCoT05
CAACAATGGCTACCACGA
Gajera
SCoT31
CCATGGCTACCACCGCCT
Yong
SC0TO6
CAACAATGGCTACCACGC
Gajera
SCoT32
CCATGGCTACCACCGCAC
New
SCoT07
CAACAATGGCTACCACGG
Yan
SC0T33
CCATGGCTACCACCGCAG
Gajera
SC0TO8
CAACAATGGCTACCACGT
Yong
SC0T34
ACCATGGCTACCACCGCA
Luo
SCoT09
CAACAATGGCTACCAGCA
Luo
SC0T35
CATGGCTACCACCGGCCC
Yong
SCoTIO
CAACAATGGCTACCAGCC
Yan
SCoT36
GCAACAATGGCTACCACC
New
SCoTll
AAGCAATGGCTACCACCA
Yong
SCoT40
CAATGGCTACCACTACAG
Gajera
SC0TI2
ACGACATGGCGACCAACG
Yong
SC0T44
CAATGGCTACCATTAGCC
New
SCoT13
ACGACATGGCGACCATCG
Yan
SC0T45
ACAATGGCTACCACTGAC
Gajera
SCoT14
ACGACATGGCGACCACGC
Gajera
SCoT51
ACAATGGCTACCACTGTC
Gajera
SCoT15
ACGACATGGCGACCGCGA
Yong
SC0T6O
ACAATGGCTACCACCACA
New
SC0TI6
ACCATGGCTACCACCGAC
Gajera
SC0T6I
CAACAATGGCTACCACCG
Luo
SCoT17
ACCATGGCTACCACCGAG
Yong
SC0T63
ACCATGGCTACCACGGGC
Gajera
SC0TI8
ACCATGGCTACCACCGCC
Yan
SC0T65
ACCATGGCTACCACGGCA
Gajera
SCoT19
ACCATGGCTACCACCGGC
Gajera
SC0T66
ACCATGGCTACCAGCGAG
Gajera
SCoT20
ACCATGGCTACCACCGCG
Luo
SCoT70
ACCATGGCTACCAGCGCG
Gajera
SC0T22
AACCATGGCTACCACCAC
Yong
SC0T73
CCATGGCTACCACCGGCT
Gajera
SC0T23
CACCATGGCTACCACCAG
Yong
SC0T77
CCATGGCTACCACTACCC
Gajera
SC0T25
ACCATGGCTACCACCGGG
Luo
SCoT78
CCATGGCTACCACTAGCA
Gajera
12
Chapter 2. Contents and Methods
Table 2.2 Component content of PCR reaction 11
No.
Components
Volumn
1
DNA Tag mix 2X
6 pl
2
SCoT primers
Ipl
3
DNA sample
2 pl
4
Water (ddH2O)
3 pl
Total volumn
12 pl
Table 2.3 PCR cycling conditions 4’11
Step
Tempetature (°C)
Time
Cycles
Initial denaturation
94
3 mins
1
Denaturation
94
45 secs
Annealing
50
1 mins
Extension
72
2 mins
Final extension
72
5 mins
40
1
Electrophoresis method: PCR products were detected by electrophoresis
on agarose gel with a concentration of 0.8 %.
Step 1: Prepare 0.8 % agarose gel
- Add 0.4 g of agarose powder to Erlen, add 50 ml of TBE, shake to dissolve.
- Put in microwave for 1 - 2 minutes.
- Allow to cool to 50 ° c then pour into a pre-set mold.
- Let stand for 15-20 minutes for the gel to solidify.
Step 2: Inject the sample into the gel well and run the electrophoresis
- Put the prepared gel pad into the electrophoresis tank containing the TBE solution,
the well of the gel pad is facing the cathode.
- Add 2 pl of gelred 6X and 12 pl of PCR sample then mix well.
- Pump all 14 pl of the mixture into the gel well.
13
Chapter 2. Contents and Methods
- Inject the DNA ladder into the first well.
- Close the lid of the electrophoresis tank and plug in the power source.
- Electrophoresis is performed for 90 minutes at 45 V.
Step 3: Check the results of electrophoresis
- After electrophoresis, place the gel into the gel scanner.
- Observe and photograph the results.
2.3.3 PCR data analysis
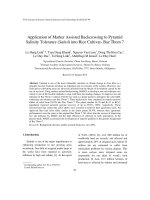
2.3.3.1 Input data
After electrophoresis and reading the results on the gel, enter data obtained from
on agarose gel as 0 and 1 representing of absence and presence of a DNA band in the
following order in Microsoft Office Excel 97 ~ 2016:
-
Enter each primer’s data in a separate data sheet in a single file.
-
Write always “1” in “Al” cell as a sign of a rectangular matrix.
-
In “Bl” cell write the total number of individuals (isolates or varieties or races
or genotypes, etc.).
-
In “C1 ” cell write the maximum band number you have got using this primer.
Leave blank the second raw (A2, B2, C2.Z2).
-
Write the name, number, code, or acronym of individuals starting from “A3” ~
“An”, n = number of - individuals.
-
Enter 0 and 1 data in “B3” ~ “Z3” for the first individual and “B4” ~ “Z4” for
the second one and ...
-
Save the file as an arbitrary name using by “Save as” sub-menu in File menu l8.
-
After that, synthesis and import all primers data into a separate datasheet.
14
Chapter 2. Contents and Methods
Home
Insert
-
a"
*
m*
Font
•-
- C“
Q31
A
1
u
>51
v
*
Acrobat
General
Wrap Text
-jcj Merge &. Center *
è
rs 1
Add-Ins
View
Review
Alignment
$
*
%
Gt
Nurr
1
J
A
c
B
1
Data
II M
z
H
l
Clipboard
B
Formulas
III
*11
Calibri
J
Paste
Page Layout
D
250
7
0
F
E
H
G
2
3
Abk
0
10
0
4
Abs
1111
o
1
o
5
Ahr
1
0
1
0
0
0
0
6
Ajb
1
0
1
o
10
0
7
AJd
1
0
1
0
10
0
8
Ajm
1
1
1
o
1
o
o
1
o
9
Ard
1
0
1
o
10
0
10
Arf
1
0
1
o
10
0
11
Aro
1111
1
0
12
Asa
o
13
Asi
1
1
1
1
10
14
Azr
1
0
1
o
o
0
0
15
Bnb
o
1
1
1
1
o
0
16
ô ã
Did
1
0
o
1
1
10
4
4
0
X*
0
1
0
o
111
0
Figure 2.1 Preparation and data entry in Microsoft Excel
23.3.2 Data accession and clustering analysis
I- renllxl
SỈRepurt listing
Fie
Edr
Opbons
Help
* by Cols
- 3IMQUAL: input=D:\Toan TTPT\NT3Y3PC\DaigiangNT3Y3PC.xls, coeff=3M
* by Cols
3 141 14
0
ABCEFGMKMNLOPQ
1.0000000
0.6666667
1.0000000
0.6666667
1.0000000 1.0000000
0.5555556 0.6666667 0.6666667
1.0000000
0.4444444
0.1111111 0.1111111 0.4444444
1.0000000
0.4444444
0.1111111 0.1111111 0.4444444
1.0000000
1.0000000
0.4444444
0.1111111 0.1111111 0.4444444
0.7777778
0.7777778
0.6666667
0.5555556 0.2222222
0.2222222 0.5555556 0.6666667
1.0000000
0.6666667 0.5555556 0.2222222
0.2222222
0.5555556 0.6666667
0.5555556 1.0000000
0.5555556 0.6666667 0.6666667 0.5555556 0.2222222
0.2222222
0.5555556
1.0000000
1.0000000
0.8888889 0.5555556 0.5555556 0.6666667
0.5555556 0.5555556
0.6666667 0.6666667
0.6666667
1.0000000
0.6666667 0.6666667 0.3333333
0.4444444
0.7777778
0.4444444
0.3333333
0.5555556 0.5555556 0.6666667
1.0000000
0.6666667
0.5555556 0.5555556 0.2222222
0.3333333
0.3333333
0.6666667
0.6666667 0.5555556 0.8888889 1.0000000
0.4444444
0.5555556 0.2222222
0.6666667
0.2222222 0.5555556 0.6666667
0.7777778
0.5555556 0.5555556 0.6666667 0.5555556 0.6666667
1
I
1.0000000
0.8888889
0.4444444
U)
(✓)
zr
o
I
0.4444444
0.5555556
0.2222222
0.3333333
0.6666667
1.0000000
Figure 2.2 Example of similarity matrice of sample
With NTSYSpc 2.02, we could access the similarity matrice by the “Similarity”
tab and draw the dendrogram by “Clustering” tab 18.
15
Chapter 2. Contents and Methods
|*^f
File
Tree plot
Edit
Options
Help
Matrix |h
c
Figure 2.3 Example of dendrograms drawing (phylogenetic trees)
16
Chapter 3. Results and Discussion
CHAPTER 3. RESULTS AND DISCUSSION
3.1 Sample collection
Fresh leaves of 15 Cat Hoa Loc mango samples were collected in Southern
Vietnam, including 2 samples from Ben Tre, 9 samples from Tien Giang, 1 sample from
Long An, and 3 samples from Khanh Hoa. In addition, 15 samples were also collected
from Southern Horticultural Research Institute (SOFRI), Long Dinh Village, Chau
Thanh District, Tien Giang Province, and were coded from Al to A15 (Table 3.1).
Table 3.1 List of mango cultivars used in this study
No.
Name of sample
Code
1
Cat Hoa Loc 1
XI
Collecting location
Hoa Loc Village, Cai Be District, Tien Giang
Province
Hoa Loc Village, Cai Be District, Tien Giang
2
Cat Hoa Loc 2
X2
Province
Hoa Loc Village, Cai Be District, Tien Giang
3
Cat Hoa Loc 3
X3
Province
Hoa Loc Village, Cai Be District, Tien Giang
4
Cat Hoa Loc 4
X4
Province
Hoa Loc Village, Cai Be District, Tien Giang
5
Cat Hoa Loc 5
X5
Province
Hoa Loc Village, Cai Be District, Tien Giang
6
Cat Hoa Loc 6
X6
Province
Southern Horticultural Research Institute
7
Cat Hoa Loc 7
X7
(SOFRI), Long Dinh Village, Chau Thanh
District, Tien Giang Province
Southern Horticultural Research Institute
8
Cat Hoa Loc 8
X8
(SOFRI), Long Dinh Village, Chau Thanh
District, Tien Giang Province
17