AVAILABLE AND EMERGING TECHNOLOGIES FOR REDUCING GREENHOUSE GAS EMISSIONS FROM THE PULP AND PAPER MANUFACTURING INDUSTRY doc
Bạn đang xem bản rút gọn của tài liệu. Xem và tải ngay bản đầy đủ của tài liệu tại đây (421.27 KB, 62 trang )
Office of Air and Radiation October 2010
AVAILABLE AND EMERGING TECHNOLOGIES FOR
REDUCING GREENHOUSE GAS EMISSIONS FROM
THE PULP AND PAPER MANUFACTURING INDUSTRY
Available and Emerging Technologies for Reducing
Greenhouse Gas Emissions from the Pulp and Paper
Manufacturing Industry
Prepared by the
Sector Policies and Programs Division
Office of Air Quality Planning and Standards
U.S. Environmental Protection Agency
Research Triangle Park, North Carolina 27711
October 2010
i
Table of Contents
I. Introduction 1
A. Description of the Pulp and Paper Manufacturing Process 1
1. Wood Preparation 3
2. Pulping 3
3. Bleaching 4
4. Chemical Recovery 5
5. Pulp Drying/Papermaking 6
B. Pulp and Paper GHG Emission Sources 6
C. Pulp and Paper Energy Use 9
II. Control Measures and Energy Efficiency Improvements for Direct GHG Emission
Sources 11
A. Power Boilers, Chemical Recovery Furnaces, and Turbines 12
1. Control Measures and Energy Efficiency Options for Boilers 12
2. Control Measures and Energy Efficiency Options for Chemical Recovery
Furnaces and Combustion Units 16
3. Energy Efficiency Associated with CHP Systems 18
B. Natural Gas-Fired Dryers and Thermal Oxidizers 22
C. Kraft and Soda Lime Kilns 23
D. Makeup Chemicals 25
E. Flue Gas Desulfurization Systems 26
F. Anaerobic Wastewater Treatment 26
G. On-site Landfills 27
III. Additional Energy Efficiency Improvements 29
A. Energy Efficiency Improvements in Steam Systems 29
B. Energy Efficiency Improvements in Raw Material Preparation 32
1. Debarking 32
2. Chip Handling, Screening, and Conditioning 33
C. Energy Efficiency Improvements in Chemical Pulping 33
1. Digesters (Chip Cooking) 33
2. Pulp Washing 34
3. Bleaching 34
D. Energy Efficiency Improvements in Mechanical Pulping 35
1. Mechanical Pulping 35
2. Repulping of Market Pulp 36
3. Secondary (Recovered) Fiber Processing 36
E. Energy Efficiency Improvements in Papermaking 37
1. Paper Machines – Forming and Pressing Sections 37
2. Paper Machines – Drying Section 38
F. Energy Efficiency Improvements in Facility Operations 40
1. Energy Monitoring and Control Systems 40
2. High-Efficiency Motors 40
3. Pumps 40
4. High-Efficiency Fans 41
5. Optimization of Compressed Air Systems 41
ii
6. Lighting System Efficiency Improvements 42
7. Process Integration Pinch Analysis 42
G. Emerging Energy Efficiency Technologies 44
1. Raw Material Preparation 44
2. Chemical Pulping 44
3. Pulp Washing 46
4. Secondary Fiber Processing 46
5. Papermaking 46
6. Paper Machines – Drying Section 47
7. Facility Operations - Motors 48
IV. Energy Programs and Management Systems 50
A. Sector-Specific Plant Energy Performance Benchmarks 52
B. Industry Energy Efficiency Initiatives 52
EPA Contacts 53
References 54
iii
Acronyms and Abbreviations
AF&PA American Forest and Paper Association
ANSI American National Standards Institute
ASB Aerated stabilization basin
ASD Adjustable-speed drive
BACT Best available control technology
BLO Black liquor oxidation
BLS Black liquor solids
Btu British thermal unit(s)
Ca Calcium
Ca(OH)
2
Calcium hydroxide
CaCO
3
Calcium carbonate
CaCO
3
MgCO
3
Dolomite
CaO Calcium oxide (lime)
CH
4
Methane
CHP Combined heat and power
CIPEC Canadian Industry Program for Energy Conservation
ClO
2
Chlorine dioxide
CMP Chemi-mechanical pulping
CO Carbon monoxide
CO
2
Carbon dioxide
CO
2
e CO
2
equivalent
DCE Direct contact evaporator
DIP De-inked pulp
DOC Degradable organic carbon
DOE U.S. Department of Energy
E/T Electric-to-thermal
EnMS Energy Management Systems
EPA U.S. Environmental Protection Agency
EPI Plant Energy Performance Indicator(s)
ESP Electrostatic precipitator
FGD Flue gas desulfurization
gal Gallon(s)
GHG Greenhouse gas
GWh Gigawatt-hour(s)
H
2
SO
3
Sulfurous acid
HAP Hazardous air pollutant
HHV Higher heating value
hp Horsepower
hr Hour(s)
HRSG Heat recovery steam generator
HSO
3
-
Bisulfite
ICFPA International Council of Forest and Paper Associations
IPCC Intergovernmental Panel on Climate Change
ISO International Organization for Standardization
kg Kilogram(s)
iv
kW Kilowatt(s)
kWe Killowatt(s)-electric
kWh Kilowatt-hour(s)
lb Pound(s)
MC-ASD Magnetically-coupled adjustable-speed drive
MEE Multiple-effect evaporator
Mg Magnesium
min Minute(s)
MMBtu Million Btu
MRR GHG Mandatory Reporting Rule
MSW Municipal solid waste
mtCO
2
e Metric tonne(s) of CO
2
equivalents
MW Megawatt(s)
MWe Megawatt(s)-electric
MWh Megawatt-hour(s)
N
2
O Nitrous oxide
Na Sodium
Na
2
CO
3
Sodium carbonate
Na
2
S Sodium sulfide
Na
2
SO
4
Sodium sulfate
NaOH Sodium hydroxide
NCASI National Council for Air and Stream Improvement
NCG Non-condensable gases
NDCE Nondirect contact evaporator
NESHAP National emissions standards for hazardous air pollutants
NH
3
Ammonia
NO
X
Nitrogen oxides
NSSC Neutral sulfite semi-chemical
PCC Precipitated calcium carbonate
PM Particulate matter
PRV Pressure reduction valve
PSD Prevention of significant deterioration
RCO Regenerative catalytic oxidizer
RMP Refiner mechanical pulping
rpm Revolution(s) per minute
RTOs Regenerative thermal oxidizer
RTS Residence time-temperature-speed
SDT Smelt dissolving tank
SO
2
Sulfur dioxide
SOG Stripper off gas
STIG Steam injected gas
TBtu Trillion Btu
TMP Thermo-mechanical pulping
TRS Total reduced sulfur
VOC Volatile organic compound
WBCSD World Business Council for Sustainable Development
v
WRI World Resources Institute
WWTP Wastewater treatment plant
yr Year(s)
1
I. Introduction
This document is one of several white papers that summarize readily available
information on control techniques and measures to mitigate greenhouse gas (GHG) emissions
from specific industrial sectors. These white papers are solely intended to provide basic
information on GHG control technologies and reduction measures in order to assist States and
local air pollution control agencies, tribal authorities, and regulated entities in implementing
technologies or measures to reduce GHGs under the Clean Air Act, particularly in permitting
under the prevention of significant deterioration (PSD) program and the assessment of best
available control technology (BACT). These white papers do not set policy, standards or
otherwise establish any binding requirements; such requirements are contained in the applicable
EPA regulations and approved state implementation plans.
II. Purpose of this Document
This document provides information on control techniques and measures that are
available to mitigate greenhouse gas (GHG) emissions from the pulp and paper manufacturing
industry at this time. Because the primary GHG emitted by the pulp and paper manufacturing
industry include carbon dioxide (CO
2
), methane (CH
4
), and nitrous oxide (N
2
O), and the control
technologies and measures presented here focus on these pollutants. While a large number of
available technologies are discussed here, this paper does not necessarily represent all potentially
available technologies or measures that that may be considered for any given source for the
purposes of reducing its GHG emissions. For example, controls that are applied to other
industrial source categories with exhaust streams similar to the pulp and paper manufacturing
sector may be available through “technology transfer” or new technologies may be developed for
use in this sector.
The information presented in this document does not represent U.S. EPA endorsement of
any particular control strategy. As such, it should not be construed as EPA approval of a
particular control technology or measure, or of the emissions reductions that could be achieved
by a particular unit or source under review.
A. Description of the Pulp and Paper Manufacturing Process
The manufacturing of paper or paperboard can be divided into six main process areas,
which are discussed further in the sections below: (1) wood preparation; (2) pulping;
(3) bleaching; (4) chemical recovery; (5) pulp drying (non-integrated mills only); and
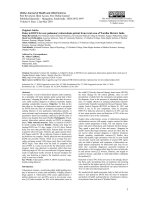
(6) papermaking. Figure 1 below presents a flow diagram of the pulp and paper manufacturing
process. Some pulp and paper mills may also include converting operations (e.g., coating, box
making, etc.); however, these operations are usually performed at separate facilities.
There are an estimated 386 pulp and/or paper manufacturing facilities in the in the U.S.,
including:
• 120 mills that carry out chemical wood pulping (kraft, sulfite, soda, or semi-chemical),
• 47 mills that carry out mechanical, groundwood, secondary fiber, and non-wood pulping,
2
• 102 mills that perform bleaching, and
• 369 mills that manufacture paper or paperboard products. (EPA 2010b)
Some integrated pulp and paper mills perform multiple operations (e.g., chemical
pulping, bleaching, and papermaking; pulping and unbleached papermaking; etc.). Non-
integrated mills may perform either pulping (with or without bleaching), or papermaking (with or
without bleaching).
Figure 1. Flow Diagram of the Pulp and Paper Manufacturing Process (Staudt 2010)
3
1. Wood Preparation
Wood is the primary raw material used to manufacture pulp, although other raw materials
can be used. Wood typically enters a pulp and paper mill as logs or chips and is processed in the
wood preparation area, referred to as the woodyard. In general, woodyard operations are
independent of the type of pulping process. If the wood enters the woodyard as logs, a series of
operations converts the logs into a form suitable for pulping, usually wood chips. Logs are
transported to the slasher, where they are cut into desired lengths, followed by debarking,
chipping, chip screening, and conveyance to storage. The chips produced from logs or
purchased chips are usually stored on-site in large storage piles. (EC/R 2005)
2. Pulping
During the pulping process, wood chips are separated into individual cellulose fibers by
removing the lignin (the intercellular material that cements the cellulose fibers together) from the
wood. There are five main types of pulping processes: (1) chemical; (2) mechanical; (3) semi-
chemical; (4) recycle; and (5) other (e.g., dissolving, non-wood). Chemical pulping is the most
common pulping process.
Chemical (i.e., kraft, soda, and sulfite) pulping involves “cooking” of raw materials (e.g.,
wood chips) using aqueous chemical solutions and elevated temperature and pressure to extract
pulp fibers. Kraft pulping is by far the most common pulping process used by plants in the U.S.
for virgin fiber, accounting for more than 80 percent of total U.S. pulp production.
The kraft pulping process uses an alkaline cooking liquor of sodium hydroxide (NaOH)
and sodium sulfide (Na
2
S) to digest the wood, while the similar soda process uses only NaOH.
This cooking liquor (white liquor) is mixed with the wood chips in a reaction vessel (digester).
After the wood chips have been “cooked,” the contents of the digester are discharged under
pressure into a blow tank. As the mass of softened, cooked chips impacts on the tangential entry
of the blow tank, the chips disintegrate into fibers or “pulp.” The pulp and spent cooking liquor
(black liquor) are subsequently separated in a series of brown stock washers. (EPA 2001a, EPA
2008)
The cooking liquor in the sulfite pulping process is an acidic mixture of sulfurous acid
(H
2
SO
3
) and bisulfite ion (HSO
3
-
). In preparing sulfite cooking liquors, cooled sulfur dioxide
(SO
2
) gas is absorbed in water containing one of four chemical bases - magnesium (Mg),
ammonia (NH
3
), sodium (Na), or calcium (Ca). The sulfite pulping process uses the acid
solution in the cooking liquor to degrade the lignin bonds between wood fibers. Sulfite pulps
have less color than kraft pulps and can be bleached more easily, but are not as strong. The
efficiency and effectiveness of the sulfite process is also dependent on the type of wood furnish
and the absence of bark. For these reasons, the use of sulfite pulping has declined in comparison
to kraft pulping over time. (EPA 2001a, EPA 2008)
4
In mechanical pulping (i.e., refiner mechanical pulping [RMP], thermo-mechanical
pulping [TMP], chemi-mechanical pulping [CMP]), pulp fibers are separated from the raw
materials (e.g., round wood, wood chips) by physical energy such as grinding or shredding,
although some mechanical processes use thermal and/or chemical energy to pretreat raw
materials. (EPA 2008)
Semi-chemical pulping uses a combination of chemical and mechanical (i.e., grinding)
energy to extract pulp fibers. Wood chips first are partially softened in a digester with
chemicals, steam, and heat. Once chips are softened, mechanical methods complete the pulping
process. The pulp is washed after digestion to remove cooking liquor chemicals and organic
compounds dissolved from the wood chips. This virgin pulp is then mixed with 20 to 35 percent
recovered fiber (e.g., double-lined kraft clippings) or repulped secondary fiber (e.g., old
corrugated containers) to enhance machinability. The chemical portion (e.g., cooking liquors,
process equipment) of the pulping process and pulp washing steps are very similar to kraft and
sulfite processes. At currently operating mills, the chemical portion of the semi-chemical
pulping process uses either a nonsulfur or neutral sulfite semi-chemical (NSSC) process. The
nonsulfur process uses either sodium carbonate (Na
2
CO
3
) only or mixtures of Na
2
CO
3
and
NaOH for cooking the wood chips, while the NSSC process uses a sodium-based sulfite cooking
liquor. (EPA 2001a, EPA 2008)
In the recycle (i.e., secondary fiber) pulping process, pulp fiber from previously
manufactured products (e.g., cardboard, office paper) are recovered by hydration and agitation.
Secondary fibers include any fibrous material that has undergone a manufacturing process and is
being recycled as the raw material for another manufactured product. Secondary fibers have less
strength and bonding potential than virgin fibers. The fibrous material is dropped into a large
tank, or pulper, and mixed by a rotor. The pulper may contain either hot water or pulping
chemicals to promote dissolution of the paper matrix. Debris and impurities are removed by
“raggers” (wires that are circulated in the secondary fiber slurry so that debris accumulates on
the wire) and “junkers” (bucket elevators that collect heavy debris pulled to the side of the pulper
by centrifugal force). (EPA 2001b, EPA 2008)
Dissolving kraft and sulfite pulping processes are used to produce highly bleached and
purified wood pulp suitable for conversion into products such as rayon, viscose, acetate, and
cellophane. (EPA 2002)
Non-wood pulping is the production of pulp from fiber sources other than trees. Non-
wood fibers used for papermaking include straws and grasses (e.g., flax, rice), bagasse (sugar
cane), hemp, linen, ramie, kenaf, cotton, and leaf fibers. Pulping of these fibers may be
performed by mechanical means at high temperatures or using a modified kraft or soda process.
Non-wood fiber pulp production is not common in the U.S. (EPA 2001b)
3. Bleaching
The bleaching process removes color from the pulp (due to residual lignin) by adding
chemicals to the pulp in varying combinations, depending on the end use of the product. The
same bleaching processes can be used for any of the pulping process categories. The most
common bleaching chemicals are chlorine, chlorine dioxide, hydrogen peroxide, oxygen, caustic,
5
and sodium hypochlorite. Concerns over chlorinated compounds such as dioxins, furans, and
chloroform have resulted in a shift away from the use of chlorinated compounds in the bleaching
process. Bleaching chemicals are added to the pulp in stages in the bleaching towers. Spent
bleaching chemicals are removed between each stage in the washers. Washer effluent is
collected in the seal tanks and either re-used in other stages as wash water or sent to wastewater
treatment. (EC/R 2005)
4. Chemical Recovery
For economic and environmental reasons, chemical and semi-chemical pulp mills employ
chemical recovery processes to reclaim spent cooking chemicals from the pulping process. At
kraft and soda pulp mills, spent cooking liquor, referred to as “weak black liquor,” from the
brown stock washers is routed to the chemical recovery area at kraft and soda pulp mills. The
chemical recovery process involves concentrating weak black liquor, combusting organic
compounds, reducing inorganic compounds, and reconstituting the cooking liquor. The typical
kraft chemical recovery process consists of the general steps described in the following
paragraphs. (EPA 2001a, EPA 2008)
Black liquor concentration. Residual weak black liquor from the pulping process is a
dilute solution (approximately 12 to 15 percent solids) of wood lignins, organic materials,
oxidized inorganic compounds (sodium sulfate [Na
2
SO
4
], Na
2
CO
3
), and white liquor (Na
2
S and
NaOH). The weak black liquor is first directed through a series of multiple-effect evaporators
(MEEs) to increase the solids content to about 50 percent to form “strong black liquor.” The
strong black liquor from the MEE system is either oxidized in the black liquor oxidation (BLO)
system if it is further concentrated in a direct contact evaporator (DCE) or routed directly to a
nondirect contact evaporator (NDCE), also called a concentrator. Oxidation of the black liquor
prior to evaporation in a DCE reduces emissions of odorous total reduced sulfur (TRS)
compounds, which are stripped from the black liquor in the DCE when it contacts hot flue gases
from the recovery furnace. The solids content of the black liquor following the final evaporator/
concentrator typically averages 65 to 68 percent. The soda chemical recovery process is similar
to the kraft process, except that the soda process does not require BLO systems, since it is a
nonsulfur process that does not result in TRS emissions.
Recovery furnace. The concentrated black liquor is then sprayed into the recovery
furnace, where organic compounds are combusted, and the Na
2
SO
4
is reduced to Na
2
S. The
black liquor burned in the recovery furnace has a high energy content (5,800 to 6,600 British
thermal units per pound [Btu/lb] of dry solids), which is recovered as steam for process
requirements, such as cooking wood chips, heating and evaporating black liquor, preheating
combustion air, and drying the pulp or paper products. The process steam from the recovery
furnace is often supplemented with fossil fuel-fired and/or wood-fired power boilers. Particulate
matter (PM) (primarily Na
2
SO
4
) exiting the furnace with the hot flue gases is collected in an
electrostatic precipitator (ESP) and added to the black liquor to be fired in the recovery furnace.
Additional makeup Na
2
SO
4
, or “saltcake,” may also be added to the black liquor prior to firing.
Molten inorganic salts, referred to as “smelt,” collect in a char bed at the bottom of the furnace.
Smelt is drawn off and dissolved in weak wash water in the smelt dissolving tank (SDT) to form
6
a solution of carbonate salts called “green liquor,” which is primarily Na
2
S and Na
2
CO
3
. Green
liquor also contains insoluble unburned carbon and inorganic impurities, called dregs, which are
removed in a series of clarification tanks.
Causticizing and calcining. Decanted green liquor is transferred to the causticizing area,
where the Na
2
CO
3
is converted to NaOH by the addition of lime (calcium oxide [CaO]). The
green liquor is first transferred to a slaker tank, where CaO from the lime kiln reacts with water
to form calcium hydroxide (Ca(OH)
2
). From the slaker, liquor flows through a series of agitated
tanks, referred to as causticizers, that allow the causticizing reaction to go to completion (i.e.,
Ca(OH)
2
reacts with Na
2
CO
3
to form NaOH and calcium carbonate [CaCO
3
]). The causticizing
product is then routed to the white liquor clarifier, which removes CaCO
3
precipitate, referred to
as “lime mud.” The lime mud is washed in the mud washer to remove the last traces of sodium.
The mud from the mud washer is then dried and calcined in a lime kiln to produce “reburned”
lime, which is reintroduced to the slaker. The mud washer filtrate, known as weak wash, is used
in the SDT to dissolve recovery furnace smelt. The white liquor (NaOH and Na
2
S) from the
clarifier is recycled to the digesters in the pulping area of the mill.
5. Pulp Drying/Papermaking
After pulping and bleaching, the pulp is processed into the stock used for papermaking.
At non-integrated mills, market pulp is dried, baled, and then shipped off-site to paper mills. At
integrated mills, the paper mill uses the pulp manufactured on-site. The processing of pulp at
integrated mills includes pulp blending specific to the desired paper product desired, dispersion
in water, beating and refining to add density and strength, and addition of any necessary wet
additives (to create paper products with special properties or to facilitate the papermaking
process). Wet additives include resins and waxes for water repellency; fillers such as clays,
silicas, talc, inorganic/organic dyes for coloring; and certain inorganic chemicals (calcium
sulfate, zinc sulfide, and titanium dioxide) for improved texture, print quality, opacity, and
brightness. (EPA 2002)
The papermaking process is similar for all types of pulp. The pulp is taken from a
storage chest, screened and refined (if necessary), and placed into a head box of the paper
machine. From the head box, a slurry of pulp is created using water, usually recycled whitewater
(drainage from wet pulp stock in pulping and papermaking operations). The pulp slurry is put
through a paper machine and then passed through a press section, where the whitewater is
drained and the sheet forming process is begun. The paper sheet is then put through a dryer and
a series of booths for coating and drying. The finished product then goes through a calender
(where the sheet is pressed to reduce thickness and smooth the surface) and is wound onto
storage reels. (EPA 2001b, EPA 2002, EC/R 2005)
B. Pulp and Paper GHG Emission Sources
Greenhouse gas emissions from the pulp and paper source category are predominantly
CO
2
with smaller amounts of CH
4
and N
2
O. The GHG emissions associated with the pulp and
paper mill operations can be attributed to: (1) the combustion of on-site fuels; and (2) non-
7
energy-related emission sources, such as by-product CO
2
emissions from the lime kiln chemical
reactions and CH
4
emissions from wastewater treatment. These emissions are emitted directly
from the pulp and paper plant site. In addition, indirect emissions of GHG are associated with
the off-site generation of steam and electricity that are purchased by or transferred to the mill.
Table 1 shows the relative magnitude of nationwide GHG emissions (in million metric tonnes of
CO
2
equivalents per year [mtCO
2
e/yr] and million short tons of CO
2
equivalents per year [ton
CO
2
e/yr ) from stationary sources in the pulp and paper manufacturing sector.
Table 1. Nationwide GHG Emissions from the Pulp and Paper Manufacturing Industry
Emission Source
Million metric
tonnes of CO
2
e per
year
1
Million short tons of
CO
2
e per year
Direct Emissions
Direct emissions associated with fuel
combustion (excluding biomass CO
2
)
57.7 63.6
Wastewater treatment plant CH
4
releases 0.4 0.4
Forest products industry landfills
2
2.2 2.4
Use of carbonate make-up chemicals and flue
gas desulfurization chemicals
0.39
3
0.43
3
Secondary pulp and paper manufacturing
operations (i.e., converting primary products
into final products)
2.5 2.8
Direct emissions of CO
2
from biomass fuel
combustion (biogenic)
4
113 125
Process-related CO
2
including CO
2
emitted
from lime kilns (biogenic)
4
unavailable
5
unavailable
5
Indirect Emissions
Electricity purchases by pulp and paper mills 25.4 28
Electricity purchases by secondary
manufacturing operations (i.e., converting
primary products into final products)
8.9 9.8
Steam purchases unavailable
5
unavailable
5
1. Except for make-up chemicals, nationwide mtCO
2
e/yr totals are from National Council for Air and Stream
Improvement (NCASI) Special Report No. 08-05, The Greenhouse Gas and Carbon Profile of the U.S. Forest
Products Sector, September 2008; the mtCO
2
e/yr values are representative of year 2004.
2. Total includes emissions from wood products industry landfills (but it is expected that pulp and paper landfills are
the dominant portion of the total).
3. Nationwide mtCO
2
e/yr totals associated with carbonate makeup chemical use are from memorandum from Reid
Miner, NCASI, to Becky Nicholson, RTI International, Calculations Documenting the Greenhouse Gas Emissions
from the Pulp and Paper Industry, May 21, 2008; the mtCO
2
e/yr values are representative of years 1995 (CaCO
3
)
and 1999 (Na
2
CO
3
).
4. Historically, in voluntary GHG reporting, biogenic emissions at pulp and paper mills were considered “other
emissions” and were not reported consistently across the industry. EPA’s final GHG mandatory reporting rule
(MRR) does require reporting of biogenic emissions (40 CFR Part 98).
5. Information on emissions of process-related CO
2
(including CO
2
emitted from lime kilns) and indirect emissions
from steam purchases was not available in the literature reviewed. However, this information is required to be
reported under subpart AA of EPA’s final GHG MRR (40 CFR Part 98).
8
Secondary manufacturing facilities are not engaged in manufacturing primary pulp or
paper products, but instead convert paper products into other products (e.g., paperboard into
containers, coated/laminated papers). Some converting operations may operate small fossil fuel-
fired package boilers. Direct and indirect emissions from secondary manufacturing operations
are included in Table 1 above, along with emissions from primary manufacturing operations.
Table 2 lists the stationary direct GHG emission sources found in the pulp and paper
manufacturing industry. GHG emissions associated with mobile sources and machinery are not
discussed in this document. Almost all direct GHG emissions from pulp and paper
manufacturing are the result of fuel combustion, and CO
2
emissions from stationary fuel
combustion represent the majority of GHG emissions from pulp and paper millson-site
Mill projects might also involve indirect emissions of GHG associated with energy
consumption by pulp and paper processing equipment, such as new or modified digesters,
brownstock washers, bleach plant equipment, paper machines, and various other pulp and paper
mill equipment. Emissions related to energy consumption depend on the type and source of the
energy (e.g., electrical energy and/or process heat/steam generated on-site or from an outside
source).
A number of tools are available to assist with estimating GHG emissions for the pulp and
paper industry. Notably, EPA’s GHG MRR (40 CFR part 98) contains equations and emission
factors for stationary combustion (Subpart C), pulp and paper manufacturing (Subpart AA),
industrial landfills (Subpart TT), and industrial wastewater treatment (Subpart II). The
calculation procedures in the GHG MRR regulatory text are further described in technical
support documents (TSDs) related to each subpart. These GHG MRR subparts and TSDs were
compiled considering various GHG inventory and calculation protocols. Additional resources
include the 2006 Intergovernmental Panel on Climate Change (IPCC) Guidelines for National
Greenhouse Gas Inventories available at c-
nggip.iges.or.jp/public/2006gl/index.html and industry-specific guidance for the pulp and paper
sector entitled Calculation Tools for Estimating Greenhouse Gas Emissions from Pulp and
Paper Mills, which was developed by the National Council for Air and Stream Improvement
(NCASI) for the International Council of Forest and Paper Associations (ICFPA) and accepted
by the World Resources Institute (WRI) and the World Business Council for Sustainable
Development (WBCSD) (available at />paper). It should be noted that these protocols use different emission factors for estimating GHG
emissions and are broader in scope than the MRR (e.g., include mobile sources).
9
Table 2. Direct GHG Emission Sources at Pulp, Paper, and Paperboard Facilities
Emissions Source
Types of pulp and paper mills
where emissions sources typically
are located
Type of GHG
emissions
Fossil fuel- and/or biomass-
fired boilers
All types of pulp and paper mills fossil CO
2
, CH
4
, N
2
O
biogenic CO
2
, CH
4
,
N
2
O
Thermal oxidizers and
regenerative thermal oxidizers
(RTOs)
Kraft pulp mills for NCG control
and semi-chemical pulp mills (for
combustion unit control)
fossil CO
2
, CH
4
, N
2
O
Direct-fired dryers Gas-fired dryers at some pulp and
paper mills
fossil CO
2
, CH
4
, N
2
O
Combustion turbines All types of pulp and paper mills fossil CO
2
, CH
4
, N
2
O
Chemical recovery furnaces –
kraft & soda
Kraft and soda pulp mills fossil CO
2
, CH
4
, N
2
O
biogenic CO
2
, CH
4
,
N
2
O
Chemical recovery furnaces –
sulfite
Sulfite pulp mills fossil CO
2
, CH
4
, N
2
O
biogenic CO
2
, CH
4
,
N
2
O
Chemical recovery combustion
units – stand-alone semi-
chemical
Stand-alone semi-chemical pulp
mills
fossil CO
2
, CH
4
, N
2
O
biogenic CO
2
, CH
4
,
N
2
O
Kraft and soda lime kilns Kraft and soda pulp mills fossil CO
2
, CH
4
, N
2
O
process biogenic CO
2
Makeup chemicals (CaCO
3
,
Na
2
CO
3)
Kraft and soda pulp mills process CO
2
Flue gas desulfurization systems Mills that operate coal-fired boilers
required to limit SO
2
emissions
process CO
2
Anaerobic wastewater treatment Chemical pulp mills (kraft, mostly) biogenic CO
2
, CH
4
On-site landfills All types of pulp and paper mills biogenic CO
2
, CH
4
C. Pulp and Paper Energy Use
The pulp and paper manufacturing process is highly energy intensive. Natural gas, fuel
oil, biomass-based materials, purchased electricity, and coal are the major energy-related GHG
emission sources for U.S. pulp and paper mills. When biomass-derived GHG emissions are not
counted, the remaining four energy sources accounted for an estimated 80 percent or more of the
industry’s energy related GHG emissions in 2002. Thus, a primary option to reduce GHG
emissions is to improve energy efficiency. In 2002, the pulp and paper manufacturing industry
consumed over 2,200 trillion Btu (TBtu), which accounted for around 14 percent of all fuel
consumed by the U.S. manufacturing sector. (Kramer 2009)
Two biomass by-products of the pulp and paper manufacturing process, black liquor and
hog fuel (i.e., wood and bark), meet over half of the industry’s annual energy requirements. The
American Forest and Paper Association (AF&PA) estimates that biomass comprises 64 percent
10
of total fuel use by AF&PA members’ pulp and paper facilities. (AF&PA 2008) The use of these
by-products as fuels significantly reduces the industry’s dependence on purchased fossil fuels
and electricity, with the added benefits of reduced raw material costs (i.e., avoided pulping
chemical purchases) and reduced waste generation. Natural gas and coal comprise the majority
of the remaining fuel used by the industry. (Kramer 2009) Incidental amounts of pulping vent
gases and pulping by-products (tall oil and turpentine) are also used, as discussed further in
Section II.B.
Steam is the largest end use of energy in the pulp and paper industry, with more than
1,026 TBtu used in 2002. The next largest end use of energy is electricity, with approximately
339 TBtu of electricity (purchased and self-generated) consumed in 2002. Therefore, energy
efficiency initiatives that are targeted at reducing steam system losses and improving the
efficiency of process steam-using equipment are likely to reduce energy use at pulp and paper
mills. (Kramer 2009)
For many of the control techniques listed in this document, CO
2
emission reductions are
not explicitly provided. Energy efficiency improvements lead to reduced fuel consumption or
reduced electricity demand. Thus, where CO
2
emission reductions are not provided, these
reductions can be calculated from the reduction of fuel usage at the boiler or other combustion
device. In addition, emission reductions that result from reduced electricity usage can be
calculated from the reduced amount of fuel consumed at the power plant (if fuel combustion
rather than waste heat is used for this purpose).
11
II. Control Measures and Energy Efficiency Improvements for Direct
GHG Emission Sources
The control measures and energy efficiency options that are currently available for pulp
and paper mill processes are listed in Table 3 and discussed in further detail in the sections
below.
Table 3. List of Control Measures and Energy Efficiency Options
Boilers
Burner replacement Boiler maintenance
Boiler process control Condensate return
Reduction of flue gas quantities Minimizing boiler blow down
Reduction of excess air Blow down steam recovery
Improved boiler insulation Flue gas heat recovery
Chemical Recovery Furnaces
Boiler control measures and energy efficiency options
(see above)
Recovery furnace deposition monitoring
Black liquor solids concentration Quaternary air injection
Improved composite tubes for recovery furnaces
Turbines
Boiler/steam turbine CHP Replacement of pressure reducing valves
Simple cycle gas turbine CHP Steam injected gas turbines
Combined cycle CHP Regular performance monitoring and maintenance
Natural-Gas Fired Dryers and Thermal Oxidizers
Energy efficiency measures Use of thermal oxidizers employing heat recovery (e.g.,
regenerative or recuperative thermal oxidizers)
Selection of technologies requiring less fuel
consumption
Proper design and attention to monitoring and
maintenance
Use of existing combustion processes (e.g., power
boilers or lime kilns) over a separate thermal oxidizer
Kraft and Soda Lime Kilns
Piping of stack gas to adjacent PCC plant Lime kiln modifications (e.g., high-efficiency filters,
higher efficiency refractory insulation brick)
Lime kiln oxygen enrichment Lime kiln ESP
Makeup Chemicals
Practices to ensure good chemical recovery rates in the
pulping and chemical recovery processes
Addition of Na and Ca in forms that do not contain
carbon (e.g., Na
2
SO
4
, NaOH, CaO)
Flue Gas Desulfurization (FGD) Systems
Use of sorbents other than carbonates Use of lower-emitting FGD systems
Wastewater Treatment
Use of mechanical clarifiers or aerobic biological
treatment systems (instead of anaerobic treatment
systems)
Minimization of potential for formation of anaerobic
zones in wastewater treatment systems (e.g., through
placement of aerators where practical)
On-site Landfills
Dewatering and burning of wastewater treatment plant
residuals in on-site boiler
Capture and control of landfill gas by burning it in on-
site combustion device (e.g., boilers) for energy
recovery and solid waste management
12
A. Power Boilers, Chemical Recovery Furnaces, and Turbines
The U.S. pulp and paper industry is the largest self-generator of electricity in the U.S.
manufacturing sector, with pulp and paper mills using on-site power boilers to generate steam,
electricity, and process heat needed for mill processes. Recovery furnaces and other types of
chemical recovery combustion units—used at pulp mills primarily to recover pulping process
chemicals—also produce steam, electricity, and process heat for the mill. The need to keep up
with significant mill demands for process steam and electricity, the high annual operating hours,
and the presence of on-site generated fuels (i.e., wood waste and black liquor) has made
combined heat and power (CHP) systems an operationally and financially attractive option for
many mills around the country.
Major industrial CHP “prime mover” technologies include steam turbines, gas turbines,
reciprocating engines, and fuel cells. Of these, steam and gas turbines dominate in U.S. pulp and
paper mill applications. Traditional boilers, recovery furnaces, and steam turbine systems are by
far the most common, and account for nearly 70 percent of current installed CHP capacity at
pulp and paper mills. Around half of these boiler-based systems are fired by on-site fuels (i.e.,
by black liquor and hog fuel), and the other half are fired by purchased fuels (i.e., by coal,
natural gas, and other fuels). These systems generally produce much more steam than electricity
and, as a result, do not typically generate enough electricity to meet a mill’s total electricity
demand.
CHP systems based on natural gas-fired combustion turbines account for around
30 percent of the total installed CHP capacity at pulp and paper mills. Roughly two-thirds of
these turbine-based systems use combined cycles, which augment a primary gas turbine system
with a secondary, steam-based turbine system for improved power generation. Combustion
turbine systems produce more electricity per unit of heat than boiler and steam turbine systems,
and can often meet a mill’s total electricity demand. From a fuels perspective, around one-third
of the current CHP capacity in the U.S. pulp and paper industry is fired by biomass-based energy
sources.
1. Control Measures and Energy Efficiency Options for Boilers
Control technologies, energy efficiency measures, and fuel switching options for power
boilers are presented in a separate related document of this series titled, Available and Emerging
Technologies for the Control of Greenhouse Gas Emissions from Industrial, Commercial, and
Institutional Boilers. Several energy efficiency measures for boilers presented in that document
that could apply most effectively for boilers at pulp and paper mills were also reported in the
document Energy Efficiency Improvement and Cost Saving Opportunities for the Pulp and Paper
Industry. (Kramer 2009)
1
Those boiler energy efficiency measures are listed in Table 3 above
and discussed further in the paragraphs below. The boiler energy efficiency measures presented
below focus primarily on improved process control, reduced heat loss, and improved heat
recovery. Additional energy efficiency measures related to stream distribution systems and
1
Kramer 2009 provides example costs for various energy efficiency measures. However, it is noted that estimates
of initial installation costs, annual operating costs, and total emissions reductions would be specific to the emission
source and were not available for inclusion in this document.
13
reduced electrical consumption that can result in small incremental reductions in boiler demand
are discussed in Section III of this document. It is expected that new state-of-the-art boiler
designs would incorporate many of the energy efficiency measures discussed below.
Burner replacement. According to a study conducted for the U.S. Department of Energy
(DOE), roughly half of the U.S. industrial boiler population (across all sectors) is over 40 years
old. Replacing old burners with more efficient modern burners can lead to significant energy
savings. Energy and cost savings vary widely based on the condition and efficiency of the
burners being replaced. In one example from the pulp and paper industry, replacing circular oil
burners with more efficient parallel throat burners with racer type atomizers had a payback
period of approximately one year. The U.S. DOE estimates that upgrading burners to more
efficient models or replacing worn burners can reduce the boiler fuel use of U.S. pulp and paper
mills by around 2.4 percent, with a payback period of around 19 months. (Kramer 2009)
Boiler process control. Flue gas monitors maintain optimum flame temperature and
monitor carbon monoxide (CO), oxygen, and smoke. The oxygen content of the exhaust gas is a
combination of excess air (which is deliberately introduced to improve safety or reduce
emissions) and air infiltration. By combining an oxygen monitor with an intake airflow monitor,
it is possible to detect even small leaks. A small 1 percent air infiltration will result in 20 percent
higher oxygen readings. A higher CO or smoke content in the exhaust gas is a sign that there is
insufficient air to complete fuel burning. Using a combination of CO and oxygen readings, it is
possible to optimize the fuel/air mixture for high flame temperature (and thus the best energy
efficiency) and lower air pollutant emissions. (Kramer 2009)
Typically, this measure is financially attractive only for relatively large boilers (e.g.,
250,000 pounds per hour [lb/hr] of steam), because smaller boilers often will not make up the
initial capital cost as easily. Several case studies indicate that the average payback period for
this measure is 1.7 years or less. (Kramer 2009)
One case study showed that installing a control system to measure, monitor, and control
oxygen and CO levels on coal-fired boilers was estimated to save nearly $475,000 in annual
energy costs; at an investment cost of $200,000, the payback period was less than six months.
(Kramer 2009) Another estimate suggests capital costs around $0.031 per million Btu (MMBtu)
(2008 dollars) for this measure, with a fuel savings of 2.8 percent. (Staudt 2010)
Reduction of flue gas quantities. Often, excessive flue gas results from leaks in the boiler
and/or in the flue. These leaks can reduce the heat transferred to the steam and increase pumping
requirements. However, such leaks are often easily repaired, saving 2 to 5 percent of the energy
formerly used by the boiler. This measure differs from flue gas monitoring in that it consists of a
periodic repair based on visual inspection. The savings from this measure and from flue gas
monitoring are not cumulative, as they both address the same losses. (Kramer 2009)
Reduction of excess air.
Boilers must be fired with excess air to ensure complete
combustion and to reduce the presence of CO in the unburned fuel in exhaust gases. When too
much excess air is used to burn fuel, energy is wasted because excessive heat is transferred to the
air rather than to the steam. Air slightly in excess of the ideal stochiometric fuel-to-air ratio is
required for safety and to reduce emissions of nitrogen oxides (NO
X
); approximately 15 percent
14
excess air (around 3 percent excess oxygen) is generally adequate. Most industrial boilers
already operate at 15 percent excess air or lower; thus, this measure may not be widely
applicable. However, if a boiler is using too much excess air, numerous industrial case studies
indicate that the payback period for this measure is less than one year. (Kramer 2009)
Examples of improvements to reduce excess air include changing automatic oxygen
control set points, periodic tuning of single set point control mechanisms, installing automatic
flue gas monitoring and control, fixing broken baffles, and repairing air leaks into the boiler.
The U.S. DOE estimates that U.S. pulp and paper plants could reduce boiler fuel use by around
2.3 percent through application of this measure (it was assumed that this measure would be
feasible at around one-third of U.S. pulp and paper mills). The estimated average payback
period for this measure was 5 months. (Kramer 2009)
One case study showed that combustion tuning of a combination fuel-fired boiler
(typically green wood and bark) reduced flue gas oxygen concentrations from the 8 to 12 percent
range to the 6 to 7 percent range. The savings in green wood was reported to be around $70,000
per year. Similar benefits were predicted for adjusting the boiler oxygen trim controls on another
mill to lower the oxygen levels to between 2.5 and 3 percent; boiler efficiency improvements
would save 15,500 MMBtu per year at an annual cost savings of around $118,000. (Kramer
2009)
Improved boiler insulation. New materials insulate better and have a lower heat capacity.
Savings ranging from 6 to 26 percent can be achieved if this improved insulation is combined
with improved heater circuit controls. This improved control is required to maintain the output
temperature range of the old firebrick system. As a result of the ceramic fiber’s lower heat
capacity, the output temperature is more vulnerable to temperature fluctuations in the heating
elements. The shell losses of a well-maintained boiler should be less than 1 percent. (Kramer
2009)
Boiler maintenance. A simple maintenance program to ensure that all components of a
boiler are operating at peak performance can result in substantial fuel savings (6.5 percent) with
negligible capital cost investment. (Staudt 2010) In the absence of a good maintenance system,
burners and condensate return systems can wear or get out of adjustment. These factors can end
up costing a steam system up to 30 percent of initial efficiency over two to three years. On
average, the energy savings associated with improved boiler maintenance are estimated at 10
percent. Improved maintenance may also reduce the emissions of criteria air pollutants.
(Kramer 2009)
Fouling on the fire side of boiler tubes or scaling on the water side of boilers should also
be controlled. Fouling and scaling are more of a problem with coal-fed boilers than natural gas-
or oil-fed boilers. (Boilers that burn solid fuels like coal should be checked more often, as they
have a higher fouling tendency than liquid fuel boilers do.) Tests reported by the Canadian
Industry Program for Energy Conservation (CIPEC) show that a fire side soot layer of
0.03 inches (0.8 millimeters [mm]) reduces heat transfer by 9.5 percent, while a 0.18-inch (4.5-
mm) soot layer reduces heat transfer by 69 percent. For water side scaling, 0.04 inches (1 mm)
of buildup can increase fuel consumption by 2 percent. (Kramer 2009)
15
Condensate return. For indirect uses of steam, returning hot condensate to boilers for re-
use saves energy and reduces the need for treated boiler feed water. Typically, fresh feed water
must be treated to remove solids that might accumulate in the boiler; however, returning
condensate to a boiler can substantially reduce the amount of purchased chemical required to
accomplish this treatment. The fact that this measure can save substantial energy costs and
purchased chemicals costs often makes building a return piping system attractive. The U.S.
DOE estimates that this measure can lead to a 1.5 percent reduction in boiler fuel use at U.S.
pulp and paper mills, at an average payback period of around 15 months. (Kramer 2009)
In a specific example, the U.S. DOE reports that a large specialty paper plant reduced its
boiler makeup water rate from about 35 percent of total steam production to less than 20 percent
by returning additional condensate; annual savings were around $300,000 (2004 dollars).
(Kramer 2009) Another estimate, provided to the U.S. EPA, indicates a capital cost of
$0.292/MMBtu (2008 dollars) and a fuel savings of 13.8 percent for this measure. (Staudt 2010)
Minimizing boiler blow down. Boiler blow down is important for maintaining proper
steam system water properties and must be done periodically to minimize boiler deposit
formation. However, excessive blow down will waste energy, as well as water and chemicals.
The optimum blow down rate depends on a number of factors, including the type of boiler and its
water treatment requirements, but typically ranges from 4 to 8 percent of the boiler feed water
flow rate. Automatic blow down systems can be installed to optimize blow down rates. Case
studies from the pulp and paper industry suggest that automatic blow down systems can have a
payback period of just six months. (Kramer 2009)
The U.S. DOE estimates that around 20 percent of U.S. pulp and paper mills could
improve blow down practices, which would lead to annual boiler fuel savings of around
1.1 percent. (Kramer 2009)
Blow down steam recovery. Boiler blow down is important for maintaining proper steam
system water properties. However, blow down can result in significant thermal losses if the
steam is not recovered for beneficial use. Blow down steam is typically low grade, but can be
used for space heating and feed water preheating. In addition to energy savings, blow down
steam recovery may reduce the potential for corrosion damage in steam system piping.
Examples of blow down steam recovery in the pulp and paper industry suggest a payback period
of around 12 to 18 months for this measure. (Kramer 2009)
The U.S. DOE estimates that the installation of continuous blow down heat recovery
systems is feasible at around 20 percent of U.S. pulp and paper mills and would reduce boiler
fuel use by around 1.2 percent. (Kramer 2009)
In one case study, an existing boiler blow down system was modified by installing a
plate-and-tube heat exchanger and associated piping to recover energy from the mill’s
continuous blow downstream from the boiler blow down flash tank. The project resulted in
annual energy savings of 14,000 MMBtu, with annual fuel cost savings of over $30,000 (2002
dollars). The period of payback for this project was about six months. In a second case study, a
plant-wide assessment estimated that the pursuit of blow down heat recovery (as opposed to the
current practice of venting blow down to atmosphere) could save the mill around $370,000 per
year (2006 dollars). In a third case study, it was estimated that a significant amount of additional
16
thermal energy could be recovered from the liquid blow down rejected from the flash vessel. If a
second stage of blow down energy recovery were installed on the remaining boilers, additional
blow down energy recovery savings of $100,000 per year were projected (2006 dollars).
(Kramer 2009) Another estimate, provided to the U.S. EPA, indicates a capital cost of
$0.061/MMBtu (2008 dollars) and fuel savings of 1.2 percent for this measure. (Staudt 2010)
Flue gas heat recovery. Heat recovery from flue gas is often the best opportunity for heat
recovery in steam systems. Heat from flue gas can be used to preheat boiler feed water in an
economizer. While this measure is fairly common in large boilers, there is often still room for
more heat recovery. The limiting factor for flue gas heat recovery is that one must ensure that the
economizer wall temperature does not drop below the dew point of acids contained in the flue
gas (such as sulfuric acid in sulfur-containing fossil fuels). Traditionally, this has been done by
keeping the flue gases exiting the economizer at a temperature significantly above the acid dew
point. In fact, the economizer wall temperature is much more dependent on feed water
temperature than on flue gas temperature because of the high heat transfer coefficient of water.
As a result, it makes more sense to preheat feed water to close to the acid dew point before it
enters the economizer. This approach allows the economizer to be designed so that exiting flue
gas is just above the acid dew point. (Kramer 2009)
Typically, one percent of fuel use is saved for every 45°F reduction in exhaust gas
temperature. A conventional economizer would result in savings of 2 to 4 percent, while a
condensing economizer could result in energy savings of 5 to 8 percent. However, the use of
condensing economizers is limited to boilers using clean fuels due to the risk of corrosion.
(Kramer 2009)
The U.S. DOE estimates that the installation of boiler feedwater economizers is feasible
at around 19 percent of U.S. pulp and paper mills and would reduce boiler fuel use by around 3.5
percent. (Kramer 2009) An estimate for flue gas heat recovery provided to the U.S. EPA
indicates a capital cost of $0.054/MMBtu (2008 dollars) and 1.3 percent fuel savings. (Staudt
2010)
2. Control Measures and Energy Efficiency Options for Chemical Recovery Furnaces
and Combustion Units
Concentrated spent pulping liquors generated as a byproduct of chemical pulping are
burned in chemical recovery furnaces (or other types of chemical recovery combustion units) to
produce steam for use in facility processes and to recover chemicals for re-use in the pulping
process. Carbon dioxide emissions associated with combustion of spent pulping liquor (e.g.,
black liquor at kraft mills) in chemical recovery furnaces are biomass-derived CO
2
because the
carbon originates from the wood or other cellulosic materials. The carbon in the spent pulping
liquor exits the recovery furnace in two forms: (1) as CO
2
emissions from the recovery furnace
stack, and (2) as carbonates in the smelt flowing from the bottom of the recovery furnace (which
eventually makes its way to the lime kiln). (EPA 2009c)
Fuel switching is generally not an option of significance for recovery furnaces and other
chemical recovery combustion units because spent pulping liquor comprises most of the heat
input. Small amounts of supplemental fossil fuels (e.g., oil or natural gas) are also fired in the
17
furnace, usually during startup or shutdown conditions. Therefore, chemical recovery furnaces
are sources of both biogenic and fossil fuel-based CO
2
(which must be accounted for separately
for the federal GHG reporting rule) as well as small amounts of CH
4
and N
2
O. (EPA 2009c)
Many of the boiler control technologies and/or energy efficiency measures noted in the
previous section for power boilers will also apply for chemical recovery furnaces and
combustion units. Additional control technologies, energy efficiency measures, and fuel
switching options for power boilers are presented in a separate related document entitled,
Available and Emerging Technologies for the Control of Greenhouse Gas Emissions from
Industrial, Commercial, and Institutional Boilers. Efficiency measures specific to recovery
furnaces are summarized in the following sections.
Black liquor solids concentration. Black liquor concentrators are designed to increase the
solids content of black liquor prior to combustion in a recovery furnace. Increased solids content
means less water must be evaporated in the recovery furnace, which can increase the efficiency
of steam generation substantially. There are two primary types in use today: submerged tube
concentrators and falling film concentrators. (Kramer 2009)
In a submerged tube concentrator, black liquor is circulated in submerged tubes, where it
is heated but not evaporated; the liquor is then flashed to the concentrator vapor space, causing
evaporation. One study estimated that, for a 1,000 ton per day pulp mill, increasing the solids
content in black liquor from 66 to 80 percent would lead to fuel savings of 30 MMBtu per hour
(hr), or about $550,000. Capital costs of the high solids concentrator would include concentrator
bodies, piping for liquor and steam supplies, and pumps. (Kramer 2009)
A tube-type falling film evaporator effect operates almost exactly the same way as a more
traditional rising film effect, except that the black liquor flow is reversed. The falling film effect
is more resistant to fouling because the liquor is flowing faster and the bubbles flow in the
opposite direction of the liquor. This resistance to fouling allows the evaporator to produce
black liquor with considerably higher solids content (up to 70 percent solids, rather than the
traditional 50 percent), thus eliminating the need for a final concentrator. One study estimated a
steam savings of 0.76 MMBtu per ton of pulp with this type of concentrator. (Kramer 2009)
According to another study, a 900 ton per day pulp and paper mill which installed a
liquor concentrator increased its solids content from 73 to 80 percent and reduced annual energy
usage by about 110,000 MMBtu. Cost savings for the mill were about $900,000 per year, with
an estimated payback period of 4 years. (Kramer 2009)
Improved composite tubes for recovery furnaces
. Recovery furnaces consist of tubes that
circulate pressurized water to permit steam generation. These tubes are normally made out of
carbon steel, but severe corrosion thinning and occasional tube failure has led to the research and
development of more advanced tube alloys, including new weld overlay and co-extruded tubing
alloys. Replacing carbon steel tubes in the recovery furnace with these composite alloy tubes
allows the use of black liquor with higher dry solids content, which increases the thermal
efficiency of the recovery furnace and decreases the number of furnace shutdowns. Improved
composite tubes have been installed in more than 18 kraft recovery furnaces in the U.S., leading
to a cumulative energy savings of 4.6 TBtu since their commercialization in 1996. (Kramer
2009)
18
Recovery furnace deposition monitoring. Better control of deposits on heat transfer
surfaces in recovery furnaces can lead to higher operating efficiencies, reduced downtime (by
avoiding plugging), and more predictable shutdown schedules. A handheld infrared inspection
system is currently available that can provide early detection of defective fixtures (tube leaks or
damaged soot blower) and slag formation, preventing impact damage and enabling cleaning
before deposits harden. The system can reportedly provide clear images in highly particle-laden
boiler interiors and enable inspection anywhere in the combustion chamber. As of 2005, 69 units
were in use in the U.S., generating 1.4 TBtu in energy savings since their introduction in 2002
(energy savings are attributable to reduced soot blower steam use). (Kramer 2009)
Quaternary air injection. Most recovery furnaces in the U.S. have three stages of air
injection but use the third stage in a limited fashion. Fully using the third stage and adding a
fourth air injection port can reduce carry over and tube fouling, thereby reducing the frequency
of recovery furnace washing, which will lead to energy savings, because boiler shutdowns and
reheat can be reduced. One estimate indicated each boiler reheat cycle will consume around 10
MMBtu at a cost of around $50,000. Capital costs for this measure are estimated at $300,000 to
$500,000. (Kramer 2009)
3. Energy Efficiency Associated with CHP Systems
The benefits of CHP are significant and well-documented. Pulp and paper mills benefit
from improved power quality and reliability, greater energy cost stability, and, possibly, higher
revenues from the export of excess electrical power to the grid. CHP systems are significantly
more efficient than standard power plants, because they take advantage of waste heat that is
usually lost in central power generating systems and also reduce electricity transmission losses.
Thus, society also benefits from CHP in the form of reduced grid demand, reduced air pollution,
and reduced GHG emissions.
CHP systems in the pulp and paper industry are typically designed with a mill’s thermal
energy demand in mind, including the supply steam temperatures and pressures that are required
by key mill processes. Thus, electrical power generation is a secondary benefit to providing
efficient and reliable process steam to the mill. Many mills will import supplementary electricity
from the grid as needed, but best practice mills may be able to meet all on-site electrical power
demand through self generation. CHP systems can also be used to directly drive mechanical
equipment such as pumps and air compressors.
Despite the benefits of CHP systems, and their widespread use in the U.S. pulp and paper
industry (currently 225 of the 386 mills have some form of CHP system in place, representing
approximately 12,000 megawatts (MW) of electric generating capacity (ICF 2010)), much
potential for CHP remains. Examples of CHP technology include power boilers and chemical
recovery furnaces (e.g., at kraft pulp mills). There are significant remaining opportunities to add
CHP capacity, based on evaluation of steam requirements met by boilers and by CHP in the
paper industry. In addition, there are opportunities to repower existing CHP plants, making them
larger and more efficient. If natural gas is available, existing steam turbine CHP systems can be
replaced by newer, more efficient combustion turbines; existing simple cycle combustion turbine