REPORT ON STUDIES ON BENCHMARKING /INPUT NORMS FOR PULP AND PAPER INDUSTRY SUBMITTED TO CESS GRANTS AUTHORITY pot
Bạn đang xem bản rút gọn của tài liệu. Xem và tải ngay bản đầy đủ của tài liệu tại đây (3.56 MB, 278 trang )
1
REPORT
ON
STUDIES ON
BENCHMARKING /INPUT NORMS
FOR PULP AND PAPER INDUSTRY
SUBMITTED TO
CESS GRANTS AUTHORITY
(Development Council for Paper, Pulp & Allied Industries)
BY
CENTRAL PULP AND PAPER RESEARCH INSTITUTE
SAHARANPUR, U.P., INDIA
www.cppri.org.in
2
All rights reserved. No part of this report may be reproduced in any form or by
any means without permission in writing from Central Pulp & Paper Research Institute.
3
Project Profile
Project : Studies on Benchmarking /Input Norms For Pulp And Paper Industry
Objective : To optimize the input norms for paper industry with an objective to reduce and
conserve the scare resources like; fiber, water, energy and chemicals, so that the
industry based on the input norms as a guide line can monitor their process
efficiency.
Duration : August 2001 to June 2004
Research Team
Technical Advisor : Dr. A. G. Kulkarni
Director
Central Pulp and Paper Research Institute Saharanpur, U. P., India
Principal Investigator : Dr. R. M. Mathur
Scientist E-II
Chemical Recovery & Energy Management Division
Associates : Dr. B. P. Thapliyal, Scientist E-I
Sh. Alok Kumar Goel, Sc.B
Sh. Arvind Jain, SRF
Sh. Veerendra K.Bhorale, SRF
4
Contents
Executive Summary
1.0 Introduction 1
2.0 Status of Indian paper industry 15
3.0 Technological status of processes & equipment- Analysis of data 31
4.0 Basic input consumption pattern-Analysis of data 93
5.0 Benchmarking/Input Norms for various categories of mills 139
6.0 International Benchmarks, reasons for gap and suggested initiatives 193
ANNEXURES
I Technology
II Format for Performance Rating / Benchmarking
III Basis for Norms
Page No.
5
INTRODUCTION
Chapter - 1
6
INTRODUCTION
• Quality and cost effective production
• Basic inputs
• Fibrous Raw materials
• Chemicals
• Non-fibrous additives
• Energy
• Water
• Benchmarks and Norms for inputs
• The project - Objective and Line of Investigations
7
Paper …………………. Quality & Cost Effective Production
Paper is one of the essential commodities and Paper Industry forms the core sector of our country’s
economy. Paper and paper products contributes to other sectors also such as education, communication and
product packaging. The uses and applications of paper and paper products are virtually limitless and new
speciality products are continuously being developed.
The per capita consumption of paper is considered as a benchmark of modernisation of any country. Per
capita consumption of paper & paper products in India is 5.5 kg, which is very low when compared with
developed countries. The reasons attributed for low consumption are; Low level of literacy, slow industrial
growth, lack of modernisation etc.
Despite the revolution in electronic media and a tough
competition from computers and Internet connectivity, the
demand forecasts clearly indicate rise in requirement of the
paper & paper products in the years to come. With rise in its
literacy rate, per capita consumption in India is expected to
double within next 10 years. Indian paper industry has a
tough task ahead and has to gear it self for facing the
growth in demand. However, there are several bottlenecks
industry has to overcome and one of the biggest hurdle is
the availability and utilisation of inputs to match quality with
cost effective production.
Industry
Public
perception
Capital
Demand
Resources
8
Paper ……………….… Quality & Cost Effective Production
The production process is based mainly on the use of natural fibers-primarily of wood but with significant reliance on non-
wood fibers in the developing world. Apart from this a large number of other inputs also affect the production of paper & its
products. The predominantly contributing factors are; chemicals, water, fillers and energy which play a significant role in
quality and cost effective production of paper products. This reliance on harvested products makes the sector an important
customer of the forestry and, to an extent, the agricultural sectors. It therefore forms an integrated part of the development and
welfare of rural areas across the globe.
Being mainly based on renewable raw materials, and with process and products compatible with environmental needs, the
paper industry is striving to meet the statutory requirements for its sustainability. The need for maintaining a balance between
Inputs, paper making process, quality, cost and environment, is the industry’s greatest challenge.
Inputs
Paper making
process
Quality & Cost
Environmental
compliance
Customer
requirements
Inter-Relationship of Materials & Processes
9
Basic Inputs ……………………….… The cost factors
A wide range of fibrous raw materials, chemicals, fillers & additives, water, energy and labour are utilised during the
pulping and papermaking process. Their availability, price and quality to a large extent determine the cost of production.
The industry has to strictly monitor these basic inputs for its market positioning and competitive advantage. Better
utilisation of the inputs and reuse of by-products / wastes is a key factor which controls the economics of pulp and paper
manufacturing.
Inputs
Outputs
Water
Energy
Raw Materials
• Wood
• Agro residues
• Waste paper
• Wood Pulp
Chemicals
Non fibrous additives
• Clay
• Chalk
• Dyes
• Starch
• Size & other binding agents
Labour
Products
•Wood Pulp
•Newsprint
•Paper & board for printing & writing
•Corrugated materials
•Paper & board for packaging
•Toilet paper & Tissues
Treated Effluent
Waste paper
Water
Solid Waste
Air Pollutants
PULP
&
PAPERMAKING
PROCESSES
10
Basic Inputs ………………………… The unusual trend
As compared to other industries like the cement and chemical industry, the input consumption in Pulp and Paper
industry is very high and the output is comparatively very low. The input-output ratio is 8:1.
Fibre, energy, water and chemicals are the important inputs in paper manufacture. Both from the quality aspect and
also from the cost of production point of view, it is very important to have some norms of the basic inputs, so that
the cost of production is maintained at minimum level without sacrificing the quality of production.
The quantum of these inputs varies with raw material to raw material and has a direct bearing on the over all
efficiency of the paper industry. The variation in quantity of major inputs is vary large in Indian mills. The power
consumption varies between 1200-2000 kWh, steam from 10-18 ton, coal 2-4 ton, water 80-250 m
3
, cooking
chemicals 60-400 kg/t paper. For improved efficiency there is a need to optimally utilise these primary inputs. This
calls for a detailed study of the paper sector to identify consumption pattern and their effect on competitive
positioning of the Indian paper industry in global market.
Purchased
Hardwood Labour (operating) Fuel (coal) power
USD/m3 USD/person/a USD/GJ USD/MWh
India 45 1000 1.69 87
Indonesia 23 1603 0.70 32
China 45 3870 1.29 72
Malaysia 28 11263 2.50 45
Thailand 30 3571 1.30 39
Unit costs in selected Asian countries 2002
11
Basic Inputs ……… Operational Efficiency w r t primary inputs
________________________________________________________________________
Parameters Proposed Range under which
Norm most of the units fall
________________________________________________________________________
Bleached pulp yield, % 45 38-44
Chemical consumption,
TTA, kg/t of unbleached pulp 330-350 340-355
Chlorine consumption,
as available Cl
2
kg/t 80-110 90-130
Washing loss, kg/t 10-12 20-25
Fibre loss, % 0.25-0.30 0.30-0.70
Finishing loss,% 4.0-5.0 6.0-10.0
Machine down time, % 10.0 15.0-25.0
_______________________________________________________________________
Source: CPPRI
The operational parameters of various processes and operations shows a wide variation. This is due to significant
differences in raw material, processes adopted and end products. Lack of optimised operations, level of
modernisation and automation are the major factors which govern the variation in operational efficiency.
12
Basic Inputs ………………… ……… Raw materials
The best raw materials for pulp and paper manufacture is as per the customer requirement and industry norms
are derived from soft woods and some of the hard wood species. In India due to dwindling forest resources, the
pulp and paper industry depends only on bamboo and mixed hardwood. Industry utilizes alternate raw material
to a large extent along with the farm plantations. Fibrous raw material is the single largest component
influencing the manufacturing cost of paper. Any perceptible increase in the cost of fibre from these raw
materials has a considerable impact on the manufacturing cost.
For sustained supply of raw materials, the industry has to use renewable sources to the maximum extent.
The fibre resources used by the Indian pulp and paper industry come from three sources:
Forests
Including bamboo and mixed hardwoods from forest felling, and eucalyptus wood from plantations (both
organized plantations and farmers' fields/agro forestry plots)
In India all forests are Government owned and largely not accessible to pulp and paper industry. Plantation
is being done by farmers on private lands and the produce is sold to pulp and paper industry. However, the
effort is still small and meets some 10-15 % of wood needs of the industry.
Agricultural residues
Such as bagasse, rice and wheat straws and cotton stalks.
Waste paper
Includes domestic and imported waste paper.
13
There is huge potential for conservation of natural resources and reduction in pollution by increased
recycling of secondary fibres. The waste paper recycling yields fibre at low chemical and energy inputs
thereby considerable cost reduction. The energy consumption in waste paper based mills is 30-40% less
than that of an integrated pulp & paper mill. The effluent problem is also considerably less severe for waste
paper based mill. A wide range of boards, lower grade writing papers and tissue papers may be produced
from waste paper . Investment for processing equipment is lower as compared with chemical pulping
equipment . Despite all these the recovery rate of waste paper in our country is very low as compared to
Germany, Netherlands, Japan, Taiwan etc. where it is above 40% as compared to 25% in our country. This
is mainly due to lack of conservation awareness. Waste paper recycling is going to be a very important for
survival of paper industry and its recovery rate should be increased to maximum possible levels. For
enhancing the waste paper recycling, following factors need close consideration;
• To increase the waste paper recovery the collection method need to be improved by reorganising the
collection system.
• Scope of sorting of waste paper at source should be explored.
• Proper selection of individual equipment for defibering, contaminants removal and deinking etc. is needed
as many times, equipment which is excellent as individual equipment does not fully function in the system.
Basic Inputs ……………… … Waste Paper Recycling
14
Basic Inputs ……………………………… Chemicals
Majority of chemical usage is in pulp mill during chemical pulping and bleaching operations. In Indian mills,
kraft and soda alkaline pulping processes are used predominantly for chemical pulping. The main
delignification chemical in these pulping processes are caustic soda and sodium sulphide in kraft (or sulphate)
process and caustic alone or with anthraquinone in the soda/ soda AQ pulping processes. The other pulping
methods used are the Neutral sulphite semi-chemical (NSSC) process utilising conventional chemical
treatment process followed by gentle defibring in the refiners to breakdown the woodchips into separate fibres.
Chemi-mechanical pulps are also produced by some mills by both mechanical and chemical means. The
conventional thermo mechanical pulp is treated with chemicals prior to refining and heating, to produce
chemi-thermo mechanical pulp (CTMP).
There are many different types of bleaching processes, involving different chemicals and conditions. In India
most of the bleached varieties are produced by chlorination of pulps. The widely used bleaching sequence in
India is CEH / CEpH / CEpHH. Chlorine, hypo, caustic and peroxide are the main chemicals used by these
mills. When compared with developed countries, our industry lacks the technological developments as the
trend in these countries is towards elemental chlorine free (ECF) and totally chlorine free (TCF) bleaching
15
Basic Inputs …………….….….… Non-fibrous additives
A wide range of chemicals are utilised in papermaking stock to impart or enhance specific sheet properties or to serve
other necessary purposes. Additives such as alum, sizing agents, mineral fillers, starches and dyes are commonly used.
Chemicals for control purposes such as drainage aids, defomers, retention aids, pitch dispersants, slimicides and
corrosion inhibitors are added as required. The order of addition is important, to enhance retention in the paper sheet.
Not all papermaking chemicals are added to the wet stock. Sizing solutions are often applied to the dried sheet at a
later stage in the process (e.g. at the size press) and pigment coatings are used for the better quality publication grades.
Increased paper mill chemical and mineral consumption is anticipated mainly for coatings. The highest tonnage
additive is clay, over half of which is used as part of surface coating formulations.
Wet end chemicals and mineral additives
Additives Applications
Acids and bases Controls pH
Alum Controls pH, fix additives onto fibres, improve retention
Sizing agents (e.g.rosin) Control penetration of liquids
Dry strength adhesives (e.g.starch,gums) Improve burst and tensile, add stiffness and pick resistance
Wet strength resins Add wet strength to such grades as toweling and wrapping
Fillers (e.g.clay, talc,TiO
2
) Improve optical and surface properties
Coloring materials (dyes & pigments) Impart desired color
Retention aids Improve retention of fines and fillers
Drainage aids Increase water removal on wire
Optical brightner Improve apparent brightness
16
Basic Inputs …………………………… … Energy
Energy is the second largest cost component influencing the manufacturing cost. The energy consumption is still very high
when compared with developed countries. There is a considerable potential of substantial savings of energy. Studies carried
out by National & International Agencies have clearly indicated a potential saving to the tune of 20%, based on reliable
calculations. The amount of energy saved should be sufficient for 0.8 million tons of additional capacity. By and large in all the
pulp & paper making sections there is scope for energy conservation.
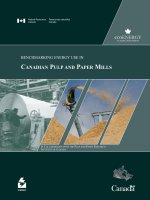
The industry has historically been an intensive
user of energy, which is needed primarily for the
drying process. In India, paper industry is the 5
th
most energy intensive industry accounting for 7%
of the nation’s total industrial energy use and
about 3% of all of the country’s energy use. In
Canada, the pulp and paper sector is the largest
industrial energy user: and it is the 4
th
largest
energy consumer among countries such as China,
Indonesia, Thailand and Korea.
Fig. 4.1 Energy Consumption in India & Developed Countries
0
5
10
15
20
25
30
35
India Developed Countries
GJ/t
Steam Consumption, GJ/t Electrical consumption, GJ/t Total Sp.Energy, GJ/t
17
Basic Inputs …………………………… … Water
In paper industry, water is used practically at all stages. Huge quantities of water are required for low consistency operation.
Water is now considered as one of the valuable resource, and mills are forced to reduce their water consumption levels.
Charter on corporate responsibility (CREP) has also included water discharge limit for liquid effluents. Thus, if the water
consumption is to be kept at a reasonable level, a systematic recycling and reuse of process water should be practiced. This
will not only provide the basic advantage of reduction of fresh water consumption and consequent discharge of the effluent
but would also result in the other additional major advantages such as;
1) Substantial recovery of fibres giving better yield from the raw material;
2) Savings in capital required for treatment of effluent.
3) Less storage areas, energy for pumping etc.,
Besides environmental effect, reduced energy consumption is associated with reduction in water consumption. Energy
consumption is low for a closed cycle plant, when compared with a mill without system closure.
Waste water generation
Paper
machine
36%
chemical
Recvery
2%
Cooling water
18%
Domestic
water
8%
pulp mill
15%
bleaching
21%
Pulp
Screening,
cleaning &
bleaching
37%
Effluent
treatment
plant
9%
Pulp washing
23%
Digester
5%
Miscellaneous
6%
Chemical
recovery
9%
Cooling tower
6%
Raw material
washing
5%
Water consumption pattern
18
Paper Industry…Benchmark & Basic Input Norm for improvement
Both from the quality aspect and also from the cost of production point of view, it is very important to have some norms of the
basic inputs, so that the cost of production is maintained at minimum level without sacrificing the quality of production. Indian
paper industry is based on wide range of fibres like; cereal, straw, bagasse and forest based raw materials and there is a wide
variation in the basic inputs for production processes based on different raw materials. As a result, cost of production is more
than what it actually should be. For instance; for production of 1 tonne of paper, mills use raw materials ranging from 2 to 3
tonnes, energy from 1000 to 2000 kWh, water from 125 m
3
to 300 m
3
/ t of paper, and labour / manpower from 5 to 30.
Considering consumption of all these basic inputs, it is impossible to achieve the cost effective production and compete in the
open economy. Further, keeping in view the need for resource conservation, particularly raw material, chemical, water, and
energy, it is very important to arrive at the input norms. For Indian paper industry no such study has been carried out in the past
and only brief studies were carried out on energy norms for paper industry. Looking into the importance of the subject, it was
recommended by the Research Advisory Committee (RAC) of CPPRI that the Institute must prepare norms for basic inputs for
paper industry in the form of a document.
19
The Project ……… … Objective & Line of Investigation
Objective:-
To develop the benchmark/norm for basic inputs, such as fibre, energy, water and chemicals for Indian pulp &
paper industry, a project was submitted to Cess Grants Authority with a focussed approach to help the industry
to identify their process efficiency, to optimize the inputs and achieve cost competitive production.
The main objective of the project was to optimize the input norms for paper industry with an objective to reduce
and conserve the scarce resources like; fibre, water, energy and chemicals, so that the industry based on the
input norms as a guideline can monitor their process efficiency.
Line of Investigation:
Selection of mills on the basis of size, raw material used, products etc. in consultation with mill
associations.
Development of data collection sheets / procedures to have uniformity among different categories of mills
producing different types of products from varying inputs.
Systematic collection of data on consumption of raw materials, water, energy, labour etc. per unit
production.
Compilation of basic input data of different mills and comparison with best achievable national and
international standards.
Arriving at the Benchmark / Norm using various statistical and marking techniques for different types of
mills like; newsprint, agro, waste paper based etc.
Dissemination of information on industry:- Basic Input Benchmark / Norm
Report Preparation:- Preparation of Standard Testing Procedures as a manual for industry will also be taken
up. The uniform testing procedures are a prerequisite for the industry to monitor their basic inputs in order
to study data on the various inputs like; raw materials, energy, water, chemicals etc. CPPRI has prepared a
comprehensive Standard Testing Manual, which is available on demand.
20
Status of
Paper Industry
Chapter - 2
21
Paper Industry……… ……… …… Global Scenario
The global consumption of paper was approximately 350 million tonnes in 2003. The writing and printing
segment accounted for 32 percent of this consumption while packaging, tissue and sanitary and newsprint
accounted for 50 percent, six percent and 12 percent respectively.
The global consumption of paper and paperboard increased 5.9 percent CAGR from 171 million TPA in 1980
to 350 million TPA in 2003, driven in the later years largely by higher Asian economic growth (7-10 percent
annum).
Global paper & paperboard market: 2003
32% Asia
9% Rest of the
world
31% North
America
28% Europe
22
Indian Paper Industry……… Capacity and Production
The Indian paper industry comprises of more than 600 mills with mill capacities ranging from less than 1000
tonne per annum to over 1,00,000 tonne per annum. Most of the mills are small, only 60 mills have a capacity
of over 33,000 tonnes per annum. In 2003, the country’s total paper and paper board capacity amounted to 8.8
million tonnes of which about 5.1 million tonnes per annum was registered as operational while the balance
1.1 million tonnes per annum was reported as idle capacity.
India accounts for less than two percent of the global paper and paper board consumption. However, the Indian
paper industry is growing at almost six percent annual growth rate, three times the annual global growth rate.
Growth of Indian Paper Industry
0
2
4
6
8
10
12
1950 1960 1970 1980 1990 2000 2003
million tpa
0
100
200
300
400
500
600
700
no. of mills
Capacity
Production
No.of Operating Mills
23
Paper Industry……………………… Paper products
In India about 618 pulp and paper mills produce variety of paper products such as writing & printing paper, kraft,
board, newsprint etc. The capacities of the mills range from 500 to 180,000 tonnes per year (tpa). There are
about 540 small and medium size units which account for 60 percent of the total capacity and the fragmentation
is higher in the industrial paper segment. The domestic paper industry, with a present market size of 5.5 million
tonnes (exclusive of newsprint), can be broadly classified into writing and printing paper, industrial and speciality
paper segments.
2004
Writing/Printing
45%
Tissue
1%
Cartonboard
24%
Others
5%
Containerboard
25%
Writing/Printing
43%
Tissue
2%
Containerboard
30%
Cartonboard
21%
Others
4%
2010
1.Cultural Paper : This includes writing & printing paper produced from 100% chemical pulp. The share of
cultural paper is around 44.8% of total demand. This finds usage mainly in the publishing and stationary sectors.
2. Industrial paper: This includes kraft paper, pulp board, duplex board and sack paper all of which have
packaging applications. It is used for paperboards where middle layer of chemical pulp is partially substituted by
inferior grade pulp. Kraft paper is a high strength paper.
3. Speciality paper includes tissue papers, absorbent paper, toilet paper, electrical & reprographic and security
papers.
24
Paper Industry…… Per capita consumption & growth potential
Within Asia, India is expected to
report the sharpest demand on
account of increasing literacy,
population and economic
growth. Estimates made by
ICRA and IPMA project that by
2012, the country could be
consuming more than 10 million
tonnes of paper, twice its
existing national production.
5
30
40
260
334
53
0
100
200
300
400
India China South
East
Asia
Japan USA World
average
Kg/capita
Country / Region wise paper consumption (kg per capita)
Even though the growth of the Indian paper industry has been commensurate with the GDP growth,
the country’s per capita consumption continues to be low compared to other countries. It is dismally
low when compared with World Average, developed countries and some of the Asian countries. The
consumption has recorded a growth over the last decade from 3 kg in 1991 to 5.0 kg at present.
25
Paper Industry……………….……… Demand & supply
The international paper industry is cyclic, influenced by economic growth, advertising expenditure,
population growth and supply dynamics. As a result, demand growth is influenced by slow growth in
the developed countries and aggressive growth in the developing ones.
Growth rate
(percent per year)
1980-1985
1996-2010
North America
2.3
1.8
Western Europe
3.1
2.5
Eastern Europe
-4.2
4.4
Middle east
5.4
4.3
Japan
3.5
1.5
China
10.1
4.9
Rest of Asia
8.4
4.3
Latin America
3
4.2
Africa
2.6
3.6
India
5
6.5
Growth rate (% per year)
Drivers and off take
Print advertising: Graphical paper (newsprint, magazine and
coated fine varieties).
Commercial activity: office paper.
Disposable activity: Tissues and personal care paper
Industrial activity: Packaging