Measuring the Effects of the September 11 Attack on New York City potx
Bạn đang xem bản rút gọn của tài liệu. Xem và tải ngay bản đầy đủ của tài liệu tại đây (211.22 KB, 16 trang )
FRBNY Economic Policy Review / November 2002 5
Measuring the Effects
of the September 11 Attack
on New York City
he attack on the World Trade Center on September 11,
2001, traumatized New York City and the nation. Almost
3,000 lives were lost, and more than 30 million square feet of
office space in Lower Manhattan was damaged or destroyed.
The loss of workers, physical capital, and infrastructure reduced
the productive potential of the city’s economy and disrupted
the lives of hundreds of thousands of people. Damage to the
transportation and communications infrastructure depressed
economic activity for a number of months, especially in Lower
Manhattan.
This article evaluates the short-term economic conse-
quences of the attack on Manhattan and the four other boroughs
that make up New York City. We begin with the deepest loss—
that of human lives. We then look at the effects of the attack on
the inputs to the production process: labor and capital.
The attack led to an idling and underutilization of labor not
only in the World Trade Center area, but also in other parts of
the city. (Views of New York City and Lower Manhattan are
provided in Appendix A.) Our analysis of labor focuses on
aggregate city employment as well as on industry effects and
factors that impact employee productivity, including health
and confidence.
1
The analysis of capital covers the destruction
of commercial space and infrastructure. We also discuss the
effects of the attack on the markets for office space, home
construction, and home sales. Finally, we examine how the
attack affected the city’s most economically vulnerable
residents.
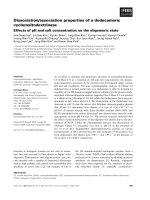
Jason Bram is an economist, James Orr a research officer, and Carol Rapaport
an economist at the Federal Reserve Bank of New York.
The authors thank Simon Potter and Robert Rich for valuable input and
insights, as well as two anonymous referees. They also acknowledge the
excellent research assistance of Silvia Ellis, David Lagakos, and Alisdair McKay.
The views expressed are those of the authors and do not necessarily reflect the
position of the Federal Reserve Bank of New York or the Federal Reserve
System.
•
The total cost of the September 11 attack on
the World Trade Center—comprising earnings
losses, property damage, and the cleanup
and restoration of the site—is estimated to
be between $33 billion and $36 billion through
June 2002.
•
The earnings losses consist of $7.8 billion
in deceased workers’ prospective lifetime
earnings and $3.6 billion to $6.4 billion in
reduced wage and salary income in city
industries affected by the attack.
•
The cost of cleaning up the site, replacing
the destroyed World Trade Center buildings,
and repairing damaged buildings and
infrastructure is expected to reach
$21.6 billion.
• Although the loss of life and disruption of
activity temporarily reduced New York City’s
productive capacity, the attack’s effects on
employment and consumer confidence had
largely run their course by mid-2002.
Jason Bram, James Orr, and Carol Rapaport
T
6 Measuring the Effects of the September 11 Attack
This framework is an economic one, incorporating quality-
of-life issues. To pursue our analysis, we have restricted
ourselves to the labor and capital markets. In theory, it should
be possible to evaluate output and income losses directly. In
practice, however, such an evaluation is unworkable because
official tabulations of gross New York City product do not exist
and income figures are reported with a considerable lag.
2
Thus,
output effects must be inferred from the behavior of the labor
and capital markets. Whenever possible, we separate the effects
of the attack from the effects of the business cycle (although we
do not attempt to isolate the effects of the fall 2001 anthrax
scares from the effects of the attack). Unless otherwise noted,
the data presented here cover the period through June 2002, the
end of the recovery process at the World Trade Center site.
We conclude that the attack disrupted New York City’s
economy in many ways. Although it is difficult to put a dollar
value on lives lost, it is also inappropriate to omit loss of life
from an estimate of the damage sustained. Our intention is to
present as complete a picture of the attack’s effects as possible.
Accordingly, we estimate that the aggregate present value of
lost lifetime earnings for these workers is about $7.8 billion. In
addition, in the nine months following the attack, lost jobs and
a reduction in the number of hours worked translated into an
estimated shortfall in aggregate earnings of $3.6 billion to
$6.4 billion. The cost of replacing the destroyed and damaged
physical capital and infrastructure is estimated at $21.6 billion.
Finally, the sum of these labor and capital losses yields an
estimated total loss through June 2002 of between $33 billion
and $36 billion.
3
Loss of Life
The death of almost 3,000 people in the attack was a loss to
New York City and to the nation. This number includes those
who worked in the two World Trade Center towers, the
firefighters and police personnel who responded to the attack,
and the tourists and other visitors who were in the World
Trade Center complex that morning. The method we use to
value loss of life is based on the concept of “lifetime-earnings
loss.” This method estimates individual economic losses by
adding up a worker’s pretax annual income from the year of
death to the year that he or she had expected to retire.
4
For
those who died in the attack, the estimated earnings loss is
calculated by multiplying the average expected level of annual
earnings by the average number of years left to work before
retirement.
5
We estimate workers who died in the attack earned, on
average, $127,000 a year. This estimate is based on the average
income in 2000 for all workers in Manhattan and all workers in
the finance and insurance sectors in Manhattan. The average
annual income for workers in the finance and insurance
sectors—where about half of the deceased workers had been
employed—is estimated to be $197,275 in 2002. The average
annual income of all workers in Manhattan, excluding the two
sectors, is estimated at $57,000.
6
We use the average age of the
workers killed in the attack, forty, and assume that they had
twenty-two more years left to work until retirement. The
average income of these workers is assumed to grow at the rate
of inflation, which is assumed to equal the average discount
rate. Under these assumptions, the current value of the
aggregate earnings loss reaches about $7.8 billion, or an average
of $2.8 million per worker.
7
Although private insurance is expected to cover a portion of
these losses, it is not likely that all of the workers had taken out
private life-insurance policies. The earnings losses sustained by
the workers’ families will be partially covered by various
charitable funds. In addition, the families of all World Trade
Center attack victims will be eligible to receive compensation
under the federal Victim Compensation Fund.
8
Although these
various payments will partially offset losses to families and
individuals, they do not reduce the overall cost of the attack
because those payments represent costs to other parties, such as
the government and insurance companies.
Employment Disruptions
In addition to the loss of lives, the attack on the World Trade
Center had a dramatic disruptive effect on employment in New
York City. The number of private-sector workers started to decline
at the beginning of 2001 because of national and local business
cycles. The level of employment bottomed out in March 2002 and
edged up during the second quarter of the year (Chart 1). From
the peak in employment in December 2000 to the trough in March
2002, the number of people working in New York City’s private
sector fell by 147,000, or 4.6 percent. (By comparison, the number
of private-sector jobs lost during the 1989-92 recession was
344,000, or 11.4 percent.) In this section, we estimate the number
of jobs lost because of the attack separately from those jobs lost
because of the business cycle.
More than one-third of the net job losses in the recent
downturn—specifically, 55,000 of the 147,000—occurred
between January and September 2001. However, the sharpest
FRBNY Economic Policy Review / November 2002 7
Chart 1
Private-Sector Employment in New York City
Thousands
2,600
2,700
2,800
2,900
3,000
3,100
3,200
3,300
0201
00
9998979695
94
93
929190
89
1988
Source: New York State Department of Labor.
Note: The shading indicates the post-September 11 period.
2,950
3,000
3,050
3,100
3,150
3,200
3,250
2002
2001
2000
Sources: U.S. Department of Labor, Bureau of Labor Statistics;
Federal Reserve Bank of New York.
Note: See Appendix B for methodology and a full explanation.
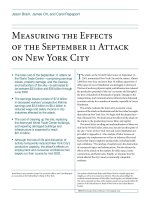
Chart 2
Path of New York City Private-Sector Employment
Thousands
Actual
Low-impact
scenario
High-impact
scenario
Source: New York State Department of Labor.
-8,000
-4,000
0
4,000
8,000
12,000
JunMayAprMarFebJanDecNovOctSepAug
2001
2002
September 11
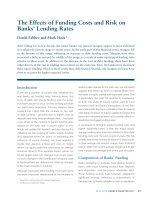
Chart 3
New York City Initial Jobless Claims
Net change in thousands from a year earlier
drop was in October 2001: a record 51,000 private-sector jobs
were lost in that month alone. The remaining 41,000 job losses
of the peak-to-trough decline occurred between October 2001
and March 2002. However, in the following months of April,
May, and June, the number of private-sector jobs rose by a total
of 10,000, or 0.4 percent.
To gauge how much of the fall in the number of jobs can be
attributed to the attack, we use a standard dynamic forecasting
model to estimate what the path of New York’s employment
would have been in the absence of an attack (Appendix B). The
difference between the actual path of employment and this
estimated path can be interpreted as the marginal effect of the
attack on employment in the city at monthly intervals. Using this
technique and two alternative sets of assumptions (high-impact
scenario and low-impact scenario), we estimate that in October
2001, the number of private-sector jobs in the city was about
38,000 to 46,000 lower than it would have been otherwise. In
February, this range moved to as high as 49,000 to 71,000, then
eased to between 28,000 and 55,000 by June 2002 (Chart 2).
Data on weekly initial claims for unemployment insurance
seem to confirm the pattern seen in payroll employment: the
attack’s effects on employment were substantial in October and
November of 2001, but had largely run their course by early
2002 (Chart 3). Prior to September 11, weekly claims in New
York City had been fluctuating in the 7,000 to 9,000 range—or
about 1,000 to 3,000 higher than a year earlier, reflecting a
general weakening in the economy. The weekly volume of
claims more than doubled in the second half of September, and
was running 10,000 to 12,000 higher than a year earlier, but then
retreated steadily for four months, returning to approximate
pre-attack levels by late February 2002. Aside from a brief spike
in late March and early April—largely attributable to filings for
extended benefits—the number of jobless claims was relatively
steady throughout the first half of 2002.
These employment disruptions varied across the city’s
boroughs and neighborhoods, and across industries (Box 1).
The most pronounced impact was concentrated in the blocks
surrounding the World Trade Center, where numerous
businesses, offices, and retail shops were either destroyed or
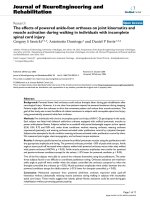
8 Measuring the Effects of the September 11 Attack
Employment in Selected New York City Industries
Net change in thousands from a year earlier
2000
2001
2002
Source: New York State Department of Labor.
Note: The shading indicates the post-September 11 period.
-30
-20
-10
0
10
Hotels
Securities and
banking
Restaurants
and bars
Air
transportation
Financial Services Jobs
in New York City and New Jersey
Seasonally Adjusted Level
Thousands
Sources: New York State Department of Labor; New Jersey
Department of Labor; Federal Reserve Bank of New York.
Note: The shading indicates the post-September 11 period.
Thousands
165
170
175
180
185
190
35
40
45
50
55
60
200220012000
New Jersey
Scale
New York City
Scale
Box 1
Employment Disruptions by Industry
The dynamic forecasting model suggests that most of the attack’s
net impact on employment levels occurred in October 2001. Here,
we take a closer look at what appear to be the most directly affected
industries: financial services, restaurants, hotels, and air trans-
portation. Together, these industries accounted for 42,000 of
October’s 51,000 drop in private-sector employment. In
subsequent months, although the estimated effect on overall
employment was relatively modest, some industries registered
further losses while others rebounded (see chart below). To get a
better understanding of the attack’s effects over time, it is helpful to
examine these industries and their performance. Because swings in
employment after September 11 are far larger than any preexisting
trends within these industries, we assume that changes in
employment after that date are mainly attributable to the attack.
The financial services industry appears to have been the most
directly affected sector by far. In New York City, the number of
jobs in the securities industry fell by 12,000, or 7 percent, in
October 2001, and by an additional 6,000 from October 2001 to
June 2002. In addition, the banking industry saw a net job loss of
8,000, or 8 percent, in October and lost another 1,000 jobs
through June 2002. Net job losses in these key financial industries
totaled 20,000 in October and another 7,000 through June 2002.
Because some of the loss reflected a relocation of operations to
nearby suburbs—mostly northern New Jersey—this figure
overstates the net impact on the metropolitan area overall (see
chart at right).
The restaurant industry also sustained steep job losses
immediately following the attack. For the city overall, the number
of jobs at bars and restaurants—which was imperceptibly affected
at the national level—fell by an estimated 9,000 (6 percent) in
October, but rebounded fully by December and held steady up to
June 2002. However, these are net changes and do not capture the
geographical distribution of employment in this industry. Thus,
it is not clear if restaurant employment in the areas closest to the
World Trade Center—the Financial District, Tribeca, and
Chinatown—has fully rebounded to pre-attack levels.
The hotel industry lost an estimated 6,000 jobs, or 15 percent,
citywide between September 2001 and March 2002. This reflected
the drop-off in tourism, although 5,000 of those jobs were lost in
October alone. In April 2002, the number of hotel jobs rose
markedly by an estimated 4,000 and held steady in May at about
5 percent below pre-attack levels. Nationally, hotel industry
employment has fallen by a more modest 4 percent since
September 2001, but has yet to show any sign of bottoming out.
The steep decline in the number of people traveling also led to
job losses in areas away from the World Trade Center site—in
particular, at John F. Kennedy International Airport and
LaGuardia Airport, both in the borough of Queens. The number
of jobs in the city’s air transportation industry fell by about
11,000, or 20 percent. Almost all of this decline occurred in
October and November 2001, and there has been no sign of a
rebound. Nationally, the number of jobs in this industry fell by
10 percent, with losses spread over the fourth quarter of 2001.
Although other industries, such as business services, apparel
manufacturing, printing, and publishing, were also presumably
affected, largely because of their strong concentration in Lower
Manhattan, there is no indication of any significant shift in
employment trends following September 11. However, it should
be noted that many business owners and workers who did not
lose their jobs evidently suffered income losses because of the
disruptions in the weeks and months immediately following the
attack. This is of particular concern in the restaurant and apparel
industries, where workers’ pay depends on business volume.
FRBNY Economic Policy Review / November 2002 9
badly damaged. Substantial employment effects were also felt
in the whole of Lower Manhattan (south of Canal Street
[Appendix A]), where transportation access was curtailed and
the volume of customer traffic fell precipitously. However,
because of the drop-off in tourism—as well as possible
multiplier effects from the loss of finance jobs—businesses
throughout the city suffered because of the attack. For example,
John F. Kennedy International Airport and LaGuardia Airport
(both in the borough of Queens) saw, as did related businesses,
a sharp decline in employment in the fourth quarter of 2001.
It is less clear whether the job losses were across all income
levels. One might hypothesize that low-skilled, low-paid
workers were more at risk of losing their jobs; labor economists
generally maintain that the workers with the least job-specific
skills are the first to be laid off in times of economic stress.
Indeed, many of the workers in the hard-hit restaurant and
retail sectors are relatively low-paid.
9
To test the hypothesis
that the city’s low-wage workforce faced a higher incidence of
attack-related job loss than high-wage workers, we compare
three industries where most employees are relatively well
paid with three other industries where most employees
are relatively poorly paid.
10
Both the high- and low-wage
industries experienced a range of employment declines.
Employees in the (low-wage) hotel and (high-wage) brokerage
industries were especially affected. However, those in the
(low-wage) general merchandise store and (high-wage) legal
industries maintained previous employment trends. This
example, although limited, does not support the hypothesis
that the September 11 attack caused disproportionate job
losses in low-wage industries.
The attack also led to a reduction in the number of hours
worked. A recent study of the effects of the attack on workers in
Chinatown indicates substantial short-term disruptions in the
restaurant and garment industries.
11
Restaurants faced
particularly severe declines in business volume in the weeks
following the attack. These declines appear to have affected the
number of hours worked as well as the number of jobs
available. The garment industry also reported substantial
declines in the number of hours worked (see Asian American
Federation of New York [2002]).
On the basis of this analysis, we estimate that the attack
led to a shortfall in wage and salary earnings of $3.6 billion to
$6.4 billion as of June 2002. This estimate mainly reflects
attack-related job losses, but also includes the reduction in
the number of hours worked (Box 2).
Furthermore, worker productivity may have been lowered
by changes in personal habits, health, and confidence. Vlahov
et al. (2002) report the results from phone interviews with 988
adult Manhattan residents living south of 110th Street five to
eight weeks after the attack. About 30 percent of the sample
reported an increased use of cigarettes, alcohol, and/or
marijuana. The same residents who increased their use of
cigarettes and/or alcohol were also found to be more likely to
have post-traumatic stress disorder (PTSD) and major
depression. In a related study, Galea et al. (2002) report that
about 7 percent of the phone sample reported psychological
symptoms consistent with current PTSD and almost
10 percent reported symptoms consistent with depression.
These percentages are about twice baseline values.
In addition, the New York City Department of Health and
the Centers for Disease Control performed a door-to-door
survey of 414 individuals living in the Battery Park City
residential complex (next to the World Trade Center site) and
two other downtown areas most directly affected by the attack
(Centers for Disease Control and Prevention 2002). As of
October 2001, almost 40 percent of the sample showed PTSD
symptoms. Moreover, about 50 percent were still experiencing
symptoms consistent with smoke inhalation from the still-
burning fires.
Surveys of consumer confidence can also help shed light on
the attack’s psychological effect on behavior. The widely cited
Conference Board survey is only available by census region
(that is, New Jersey, New York, and Pennsylvania combined),
but since 1997, Siena College in Loudonville, New York, has
conducted a parallel monthly survey of New York State
residents in which consumer confidence is reported separately
for the New York City metropolitan area. According to the
We estimate that the attack led to a
shortfall in wage and salary earnings of
$3.6 billion to $6.4 billion as of June 2002.
This estimate mainly reflects attack-
related job losses but also includes the
reduction in the number of hours worked.
[Consumer] confidence fell fairly sharply in
September 2001, recovered somewhat in
October, and then rebounded to above
pre-attack levels in November.
10 Measuring the Effects of the September 11 Attack
Siena College (2002) report, the pattern of consumer
confidence suggests a very short-lived effect from the attack.
Confidence fell fairly sharply in September 2001, recovered
somewhat in October, and then rebounded to above pre-attack
levels in November. It remained well above its September
trough through mid-2002. Interestingly, although this roughly
parallels the national trend, U.S. consumer confidence did not
begin to recover until December 2001, a month later than it did
in the New York City area.
Overall, the effects of the attack were quite uneven across
industries and workers. The finance, restaurant, hotel, and air
transportation industries in the city were directly affected by
the attack. Moreover, there is some evidence that the decline in
business volume in Lower Manhattan (following a decline in
demand) also led to a reduction in the number of hours
worked, largely in the restaurant and garment industries. More
generally, while many of the workers in the affected indus-
tries were relatively low-paid, we found no indication that
employees in the city’s lower paying industries were at signifi-
cantly greater risk of losing their jobs because of the attack than
were workers in higher paying industries. We did find some
evidence, however, that the productivity of workers living in
Manhattan may have been lowered in the immediate aftermath
of the attack because of health problems. Nevertheless,
Box 2
Earnings Disruptions
To estimate the marginal effect of the attack on wage and salary
earnings, we must first come up with a reasonable assumption
regarding the average earnings per worker associated with the net
job shortfall. Because the industry profile of attack-related job
losses evidently differs from the city’s overall industry mix, it would
be inappropriate to assume that the average earnings associated
with these job losses match the citywide average.
Although our employment simulation is based on a
macroeconomic model that ignores the industrial profile of job
losses, we can make assumptions about the mix of jobs lost based
on total job losses by industry in the first few months after the
attack (that is, October through December 2001). As indicated in
the table, the most persistent job losses were concentrated in the
financial services, air transportation, and hotel industries. The
table shows two alternative estimates of the average earnings per
worker in 2002 associated with the job shortfall. The “high-
impact” scenario assumes that all of the job losses were
concentrated in the financial, air transportation, and hotel
industries. The “low-impact” scenario assumes that 75 percent of
the job losses occurred in these industries, another 10 percent
occurred in restaurants, and the remaining 15 percent was evenly
distributed across all other industries.
These figures, combined with the employment scenarios
described earlier, imply that total wage and salary earnings would
have been between $3.4 billion and $6.2 billion higher if not for
Distribution of Job
Shortfall
(Percent)
Average Earnings in 2002
(Dollars)
Industry
Low-Impact
Scenario
High-Impact
Scenario
Low-Impact
Scenario
High-Impact
Scenario
Finance 45 64 197,275 197,275
Air transportation 10 13 50,752 50,752
Hotels 20 23 38,986 38,986
Restaurants 10 0 20,244 —
All other
industries 15 0 61,511 —
We i gh te d
average 100 100 115,470 142,775
Source: Authors’ calculations.
Note: The 2002 average earnings figures are based on the 2000 County
Business Patterns data for Manhattan (except for air transportation,
where earnings are for Queens) and are increased by 8 percent.
the attack. In addition, disruptions to Chinatown’s garment
industry and Lower Manhattan’s restaurant industry may have
reduced income by an additional $200 million, bringing the total
estimated loss to within a range of $3.6 billion to $6.4 billion.
a
a
In the first few months after the attack, workers in Chinatown’s garment industry reportedly incurred a steep fall-off in hours and income that
was not reflected in the employment statistics (see Asian American Federation of New York [2002]). Although income data by industry are not
yet available, aggregate reported income was about $220 million per quarter for the garment industry and $540 million for the restaurant industry
in 2000. Our estimated $200 million earnings shortfall assumes a 25 percent reduction in hours and earnings (of those still employed) in these two
industries persisting for one quarter.
FRBNY Economic Policy Review / November 2002 11
Siena College’s tracking of consumer confidence in the
metropolitan area strongly suggests a mitigation of these
adverse psychological effects and a general improvement in
attitudes in subsequent months.
Physical Capital Losses and Damage
The major components of New York City’s public and private
physical capital stock in Lower Manhattan that were destroyed
or damaged in the World Trade Center attack were as follows:
about 30 million square feet of commercial office space and
more than 100 retail stores in the World Trade Center area,
subway tunnels (Lines 1 and 9), the Port Authority Trans-
Hudson (PATH) train station at the World Trade Center, the
streets surrounding the attack site, and parts of the
telecommunications and power infrastructure in Lower
Manhattan, including a switching facility and substations. In
all, the resulting loss to the city’s productive capacity is similar
to what can follow an earthquake or major natural disaster.
12
Several economic and financial measures have been used to
estimate the dollar value of the city’s physical capital losses
associated with the attack.
13
In this article, we cite publicly
available repair and replacement cost estimates for the major
buildings and infrastructure affected by the attack. These dollar
values are nominal gross replacement and repair costs over a
multiyear period and do not explicitly account for the
depreciation of the assets or any potential offsets from govern-
ment rebuilding programs or private-insurance proceeds.
We group the main components of the city’s physical capital
losses directly related to the attack into three categories: 1) the
cost of the cleanup and restoration for rebuilding at the site, 2) the
cost of replacing about 14 million square feet of office and retail
space in the World Trade Center complex and its contents and
repairing the damaged buildings in the areas adjacent to the
World Trade Center,
14
and 3) the cost of repairing the damage to
the New York City subway lines, the destroyed PATH terminal in
the World Trade Center, destroyed or damaged Con Edison
facilities and equipment, and damaged telecommunications lines
and equipment in Lower Manhattan.
15
At the end of June 2002, the cleanup and restoration of the
World Trade Center site was deemed complete and the final
costs are expected to be about $1.5 billion (see table). These
costs cover debris removal, street repair, police and firefighters’
overtime pay, and other forms of disaster assistance and relief.
Most of these expenses are expected to be reimbursed by the
Federal Emergency Management Agency (FEMA).
16
The cost of replacing destroyed or damaged buildings in the
World Trade Center complex and adjacent areas is estimated to
be $11.2 billion. Of this, $6.7 billion will be for rebuilding the
destroyed World Trade Center complex, although it is unlikely
that the pre-attack design will be duplicated.
17
The remaining
$4.5 billion is the estimated cost of repairing the damaged
buildings. The cost of replacing the contents of the destroyed
buildings, including the technology and fixtures, has been
estimated to be $5.2 billion.
18
A tracking of former occupants in the World Trade Center
complex shows that tenants from about 65 percent of the
destroyed space have leased new space within New York City,
with the majority relocating to midtown offices. Tenants from
about 17 percent of the destroyed space have moved to New
Jersey. It is expected that about two-thirds of the damaged
property in the World Trade Center area will be reoccupied. It
is also expected that tenants from about 11 percent of the
damaged space will relocate to offices in New Jersey.
19
The losses to the public infrastructure in Lower Manhattan
are concentrated in three key areas—the collapsed subway
tunnel and other damage to the 1 and 9 subway lines, the
destroyed World Trade Center PATH station, and the damage
to and destruction of parts of the telecommunications and
power infrastructure. The Metropolitan Transportation
Authority (MTA) has estimated the cost of repairing the
subway lines to be $850 million and the Port Authority has
estimated that restoring basic PATH service will cost
$550 million.
20
FEMA funds can be used to meet these costs,
although private insurance taken out by both the MTA and the
Port Authority is expected to cover a portion of them.
The estimated cost of repairing the communications and
power infrastructure is $2.3 billion, much of which is expected
to be covered by private insurance and FEMA funds.
Improvements to the infrastructure in Lower Manhattan will
likely be undertaken, and the final bill, including these
improvements, may well be significantly larger. The estimated
total replacement and repair cost for these parts of the city’s
infrastructure is $3.7 billion. Although private insurance and
funds allocated through FEMA will substantially offset much of
the cost of these rebuilding efforts to New York City residents
and businesses, the productive potential of the city was
significantly reduced by the attack and will remain below its
pre-attack level until the rebuilding is largely completed.
Aggregating the cost estimates for each of these
components shows the total physical losses sustained in the
attack to be about $21.6 billion.
21
To put this amount in
perspective, it is equivalent to about 9 percent of the total
earnings in New York City in 2000, or an average of $2,650 per
12 Measuring the Effects of the September 11 Attack
city resident. As we have observed, private insurance is
expected to cover a significant amount of these losses, and
FEMA funds appear to be sufficient to cover a substantial
share of the uninsured public infrastructure costs. Of course,
this coverage mitigates the cost to New York City residents but
not to the nation as a whole.
These estimated replacement costs of the physical losses are
based on the assumption that the reconstruction of the World
Impact of the World Trade Center Attack on New York City as of June 2002
Impact Estimated Magnitude Notes
Labor market
Loss of human life Estimated 2,780 workers,
$7.8 billion lifetime-earnings loss
Losses estimated as present discounted value of
lifetime earnings; federal Victim Compensation Fund
set up to help offset earnings losses and psychological
impacts on families
Net job losses 38,000-46,000 in October 2001, rising to
49,000-71,000 by February 2002, diminishing to
28,000-55,000 by June 2002
Most of the employment losses related to the attack
were in finance, airlines, hotels, and restaurants
Net earnings losses $3.6 billion to $6.4 billion between September 2001
and June 2002
Based on estimates of net job losses and reduced hours
Attack-related productivity effects Some increase in post-traumatic stress disorder and
alcohol and drug use three months after attack
Difficult to quantify attack’s impact on workers’
mental and physical disabilities
Total labor loss $11.4 billion-$14.2 billion
Physical capital
Cleanup and site restoration $1.5 billion Completed June 2002; expenses covered by the Federal
Emergency Management Agency (FEMA)
Destroyed buildings in World Trade
Center complex
Approximately 14 million square feet,
$6.7 billion to rebuild
Book value of towers at $3.5 billion; complex
privately insured
Damaged buildings in World Trade
Center area
Approximately 15 million square feet,
$4.5 billion
Inclusion of damage to Class B and C space raises
estimate to 21 million square feet
Contents of buildings in World Trade
Center complex
$5.2 billion Significant offset from private insurance
Public infrastructure
Subway
PATH
Utilities
$850 million
$550 million
$2.3 billion
Estimated repair cost; significant offset from private
insurance and/or FEMA for repair to all three
components of infrastructure
Total capital loss $21.6 billion
Total (labor, capital) loss $33 billion-$36 billion
Notes: The rounding of the total (labor and capital) loss figure acknowledges imprecision in the estimates. On the one hand, estimates of the labor loss may
be understated, primarily for two reasons: the June 2002 cutoff for estimating earnings impacts and the possible earnings reductions due to a drop in the
number of hours worked (in industries other than apparel and restaurants). In addition, attack-related declines in worker productivity (due, for example, to
stress) may have affected employed workers and are not captured in our estimated earnings losses associated with declines in employment and hours. On the
other hand, estimates of the labor loss may be overstated, because of the double counting of the earnings losses of some of the deceased workers and the
assumption that the deceased workers would have worked in New York City until retirement. Furthermore, although this earnings-loss tally corresponds to
New York City proper, these figures will overstate the net impact on the broader metropolitan area and the nation because many of the job “losses” reflect job
relocations from the city to the suburbs—largely northern New Jersey. Because these are aggregate loss estimates, the issue of distributional impacts is not
addressed.
FRBNY Economic Policy Review / November 2002 13
Chart 4
Office Vacancy Rates
Percent
Source: Cushman and Wakefield.
Note: The shading indicates the post-September 11 period.
2
4
6
8
10
12
14
16
20022001200019991998
Northern New Jersey
Midtown Manhattan
Lower
Manhattan
Sources: Federal Reserve Bank of New York; New York City Human
Resources Administration.
Note: The shading indicates the post-September 11 period.
Index: July 1992=100
200
225
250
275
300
325
125
130
135
140
145
150
2002200120001999
Chart 5
Public Assistance Caseloads in New York City
Thousands
Public assistance caseloads
Scale
New York City
index of coincident
economic indicators
Scale
Trade Center area will essentially duplicate what existed before
the attack. However, as of June 2002, a final reconstruction
plan has not yet been reached and the subject remains under
discussion.
The Lower Manhattan Development Corporation (LMDC),
a public corporation with both city- and state-appointed
members, is helping to coordinate the redevelopment of the
site. The corporation has been soliciting from various advisory
boards ideas for the redesign of the site, including putting a
memorial to the attack victims on the site, setting aside part of
the World Trade Center area for residential units, and
reconfiguring the transportation linkages between PATH and
the New York City subway lines. The ultimate cost of replacing
the lost capital stock depends on the final decisions regarding
redevelopment of the site.
Impact on the Office Market
One of the most dramatic and surprising outcomes of the attack
was on Manhattan’s (and the metropolitan area’s) office
market. Demand for office space had been weakening and
vacancy rates rising prior to the attack. After the attack, with an
estimated 3 percent of Manhattan’s office space destroyed and
another 3 percent rendered temporarily unusable, it was widely
expected that a severe shortage of space would push down
vacancy rates and cause a sharp spike in rents. However, quite
the opposite occurred: vacancy rates rose further and rents
declined (Chart 4). This happened because of a number of
factors: demand weakened more than was anticipated, firms
had a good deal of extra space (in both Manhattan and adjacent
areas) that they were able to sublet to displaced firms, and some
Manhattan hotels were retrofitted to serve as temporary office
space.
Impact on the Most Vulnerable
The preceding two sections focused on labor and capital losses.
In this section, we look at the effects of the attack on the most
economically vulnerable New York City residents.
Chart 5 shows the monthly aggregate number of public
assistance caseloads and the Federal Reserve Bank of New
York’s index of coincident economic indicators since January
1999.
22
The bulk of public assistance is made through
One of the most dramatic and surprising
outcomes of the attack was on
Manhattan’s (and the metropolitan area’s)
office market. . . . Vacancy rates rose
further and rents declined.
14 Measuring the Effects of the September 11 Attack
Chart 6
Medicaid Enrollees in New York City
Thousands
Sources: Federal Reserve Bank of New York; New York City Human
Resources Administration.
Note: The shading indicates the post-September 11 period.
Index: July 1992=100
1,500
1,600
1,700
1,800
1,900
2,000
2,100
125
130
135
140
145
150
155
2002200120001999
Medicaid enrollees
Scale
New York City
index of coincident
economic indicators
Scale
Temporary Assistance to Needy Families, a federal and
New York State block grant program. The remainder of public
assistance includes the New York State programs Safety Net
Assistance and Safety Net Non-Cash. The caseloads for these
programs are evaluated together.
23
Understanding the causes of a downward trend in welfare
caseloads is notoriously difficult (Blank 2001). The decline in
the number of caseloads observed in the city between January
1999 and August 2001 could have stemmed from economic
expansion, the welfare reform incentives to reduce the number
of caseloads, or both. Between January and August 2000, when
the city economy was expanding, the number of public
assistance caseloads fell 8.7 percent. Between January and
August 2001, when the city’s economy was contracting but the
incentives for families to get off assistance were especially
strong, the number of caseloads fell 10.7 percent. In short, the
attack came at a time when the number of caseloads in
New York City was falling rapidly, despite the slowing
economy.
24
The post-September 11 data show that the down-
ward trend in caseloads is stronger than the attack’s effects.
Chart 6 performs a similar exercise regarding the number
of Medicaid caseloads. Medicaid—a federal government,
New York State, and New York City matching entitlement
program—provides medical assistance to certain low-income
individuals and families with dependent children. Unlike
public assistance, Medicaid enrollment displays some
coincident sensitivity to the cycle. Between January and August
2000, when the city economy was expanding, enrollment fell by
12,000 to reach 1,592,000. Between January and August 2001,
when the city economy was contracting, enrollment rose by
38,000. By December 2001, enrollment was up by 42,000, and
by January 2002, it had reached 1,716,000.
The sharp increase in Medicaid enrollment after
September 11 could stem from several factors. Those who were
eligible for Medicaid but had not enrolled may have
experienced worsening health from the attack and enrolled for
the first time after September 11. In addition, those with
incomes just above the Medicaid cutoff levels could have
suffered attack-related income losses and become eligible.
However, the United Hospital Fund (2002) concludes that
the increased enrollment is almost certainly the result of
changes in the eligibility requirements for new enrollees. The
attack disabled the Medicaid computer system and eligibility
records, so New York City could not use the standard
procedures to enroll patients. In response, the New York City
Human Resources Administration and the New York State
Department of Health developed a temporary assistance
program, Disaster Relief Medicaid (DRM). DRM simplified
the standard complex application process. Potential enrollees
were asked only to fill out a one-page application stating that
their income fell within certain guidelines. These individuals
were then presumed to be eligible for DRM and received same-
or next-day coverage.
Summary of Losses
The loss of human life and the damage and destruction of
commercial property and infrastructure that resulted from
the September 11 attack significantly reduced the productive
potential of the New York City economy. Moreover, the
attack disrupted economic activity not only in the industries
in the area of the World Trade Center, but also in a number
of other industries throughout the city, further reducing
employment.
In this article, we have assessed the impact of the attack on the
city’s economy by quantifying the effects on the inputs to the
production process—labor and capital. We first considered the
loss of human life. Although no single measure can capture the
full impact of a premature death, the computation of the
discounted value of a worker’s expected future earnings is a
conventionally used measure of an individual’s economic loss.
The attack claimed almost 3,000 lives and, using this discounted
earnings measure, we estimate that it caused $7.8 billion in
aggregate lost lifetime earnings for these workers and their
families. This was as much a loss to the nation as to the city.
FRBNY Economic Policy Review / November 2002 15
Chart 7
Single-Family House Price Appreciation
Percentage change from a year earlier
Source: Office of Federal Housing Enterprise Oversight.
Note: The shading indicates the post-September 11 period.
-10
-5
0
5
10
15
20
New York City
United States
020100
99
98979695949392911990
In addition, the attack caused significant declines in private-
sector employment. Much of the job loss appears to have been
concentrated in the finance, air transportation, hotel, and
restaurant industries. Other adverse effects of the attack on the
New York City labor market were also noted. In several
industries, most notably restaurants and apparel, the hours
worked by employees were significantly reduced. On the basis
of these figures, the attack is estimated to have reduced city
wage and salary income by a total of $3.6 billion to $6.4 billion.
In addition, surveys found some increase in the incidence of
PTSD and alcohol and drug use about three months after the
attack, which likely resulted in time off from work and reduced
productivity.
On the capital side, the attack caused an estimated
$21.6 billion in physical capital and infrastructure losses. Adding
this $21.6 billion in capital losses to the $11.4 billion to
$14.2 billion in lost earnings yields a total loss of $33 billion to
$36 billion. These losses include the costs of cleaning up the site,
the replacement of the destroyed World Trade Center complex
and its contents, the repair of the damaged buildings in the area,
and the repair to the damaged public infrastructure. Although
private insurance and FEMA funds are expected to cover a major
portion of these costs, the loss of this capital is still a cost to the
city’s economy in terms of lost productive potential.
Recovery from the Attack
As we have observed, employment in the most clearly affected
industries has been showing signs of a rebound since March
2002, despite little improvement at the national level and
persistent weakness in the financial markets, which play a key
role in driving the local economy. In terms of its distributional
impact, the attack does not appear to have taken a strikingly
disproportionate toll on low-skilled workers. Jobs in low-wage
industries appear to have been adversely affected to the same
degree as those in high-wage industries, and city welfare rolls
show few signs of sudden growth in the months after the attack.
Moreover, while surveys have found some psychological
harm to residents in the immediate area of the attack,
consumer confidence in the metropolitan area had rebounded
strongly as of mid-2002, suggesting that any widespread
pessimism associated with the terrorist attack was short-lived
in the New York City area, as it was nationwide. Another
reflection of improved confidence can be seen in local housing
markets. The market for Manhattan cooperative apartments
and condominiums picked up noticeably in the second quarter
of 2002, with the average selling prices rising an estimated
3 percent to 4 percent from a year earlier and the number of
unit sales rising nearly 50 percent.
25
Similarly, selling prices of
single-family homes in New York City’s outer boroughs and
nearby suburbs were an estimated 10 percent to 15 percent
higher in the second quarter from a year earlier (Chart 7).
26
Additional evidence of a recovery can be found by looking
at the cleanup and restoration of the site, which was essentially
completed months ahead of schedule and at a cost that appears
to be substantially less than the amount of federal money
allocated to the city for that effort. Furthermore, a number of
programs have been established to support the relief and
rebuilding efforts in Lower Manhattan. The Lower Manhattan
Development Corporation, for example, was established in
December 2001 to help coordinate the efforts to redesign and
rebuild the World Trade Center area. In January 2002, a federal
compensation program for the families of all victims of the
attack, the first of its kind, was set up, and has since started
making payments. Finally, the federal government has
authorized grants, tax relief, subsidies, and other forms of
assistance since the attack to aid in the rebuilding and
redevelopment of Lower Manhattan.
In conclusion, although New York City has clearly suffered
a severe blow from the attack, the major disruptions appear to
have been short-lived and conditions are in place to begin a
recovery. At this point, the greatest challenge to the city comes
from the economic fundamentals that have historically affected
the local economy: the national business cycle and, in
particular, developments in the financial markets.
16 Measuring the Effects of the September 11 Attack
Queens
Bronx
Staten Island
Brooklyn
Manhattan
New York City Boroughs
Source: Federal Reserve Bank of New York.
Queens
Lower Manhattan
John F. Kennedy
Airport
La Guardia
Airport
Battery
Park
City
Broadway
Hudson
River
East
River
World
Trade
Center
site
Battery
Park
SOHO
Canal Street
City Hall
Bowery
Brooklyn
Bridge
Chinatown
Little Italy
Tribeca
Lower Manhattan
Fulton Street
Wall Street
New York
Stock
Exchange
Broad
Street
Source: Federal Reserve Bank of New York.
Chambers Street
Vesey Street
Liberty Street
Church Street
West Street
Appendix A: New York City and Lower Manhattan
FRBNY Economic Policy Review / November 2002 17
Estimating the Effect of September 11
on the Path of Employment
To estimate the net impact of the terrorist attack on the
subsequent path of employment, one must formulate a set
of assumptions regarding the counterfactual—the path of
employment had there been no attack. We do this by using
an autoregressive forecasting model that estimates the
relationship between employment growth in New York City
and the rest of the nation. We then use this model to simulate
the path of New York City employment after September 11
had there been no attack. However, there are various ways
to specify this simulation, depending on a number of
assumptions. To assess the robustness of the simulation
(that is, to see how sensitive the outcome is to varying the
assumptions), we run a number of simulations varying each
of the following sets of specifications:
• Number of lags used in the regression: three to eight.
The number of lags used in the estimation reflects the
persistence of movements in employment. With relatively
few lags, employment tends to snap back to its long-term
trend relatively quickly, following any deviation. With more
lags, employment reverts to trend more gradually. We run
simulations using each of the above lag structures.
• Post-September 11 U.S. data: actual, simulated.
Since it is generally preferable to use actual data whenever
possible, we run one set of simulations using actual data for
the United States (excluding New York City) after the
attack. This implicitly assumes that employment outside
New York City would not have behaved much differently
if there had been no attack (that is, that the attack had a
relatively small net effect on jobs outside New York City).
If one assumes that the attack did have a significant
impact on U.S. employment outside New York City, then
using actual data after the attack would bias the results.
Thus, we also perform a separate set of simulations in which
U.S. data after September 11 are predicted based on pre-
attack changes in employment for the private sector overall
and for personnel-supply services. These estimates are then
used in the original regression to predict New York City
employment.
• Last actual data point used: August, September.
Although the bulk of the effects of September 11 on
employment showed up in the October 2001 data, it is
possible that the September 2001 numbers were also slightly
affected by the attack. Thus, we conduct one set of
simulations using actual September data and another
using actual data only through August.
As it turns out, the various combinations of assumptions
yield results that do not vary dramatically. The weakest
simulated employment path (low-impact scenario) is
generated by using eight lags, with actual data for the United
States, and using August as the last actual data point (for
New York City). The strongest simulated employment path
(high-impact scenario) is generated by using three lags, with
predicted data for the United States over the simulation period,
and using September as the last actual data point.
Equations:
private-sector employment in New York City,
private-sector employment in the United States
(excluding New York City), and
U.S. personnel-supply employment.
Low-impact scenario (simulation begins after August 2001):
.
High-impact scenario (simulation begins after
September 2001):
.
e
t
=
E
t
=
P
t
=
e
ˆ
t
αβ
i
e
ˆ
ti–
i 1=
8
∑
γ
i
E
ti–
i 1=
8
∑
++=
e
ˆ
t
αβ
i
e
ˆ
ti–
i 1=
3
∑
γ
i
E
ˆ
ti–
i 1=
3
∑
++=
E
ˆ
t
κφ
i
E
ˆ
ti–
i 1=
3
∑
η
i
P
ˆ
ti–
i 1=
3
∑
++=
Appendix B: Methodology
Endnotes
18 Measuring the Effects of the September 11 Attack
1. Some of these factors affect residents who are unemployed.
2. Estimates of gross city product are reported by the New York City
Office of the Comptroller. See <>.
3. It should be noted that different concepts of losses are included in
this sum, namely, replacement costs of capital, lifetime-earnings losses
of the deceased workers, and the nine-month earnings losses of those
idled because of the attack. Although there is evidently some double
counting of losses in the latter two categories, we assume it is minimal
and we make no adjustment for it.
4. The difficulties and pitfalls in putting a dollar value on human life
are discussed in Dorman (1996). In addition to using a discounted
earnings loss method, estimates of the economic value of a human life
have also been based on observed wage premiums for job-related
death risks faced by workers. A recent analysis using this methodology
estimated the economic value of the life of an “average” worker to be
between $1.5 million and $2.5 million in 1998 (Mrozek and Taylor 2002).
5. See the New York City Office of the Mayor for lists of the deceased
(<>). The average age of those who died in the
attack was 39.9 years.
6. These figures are based on data from the U.S. Department of
Commerce and 2000 County Business Patterns. We obtain estimates
for 2002 by incrementing those 2000 figures by 8 percent.
7. This method is similar to that used in the report by the New York
City Office of the Comptroller (2001).
8. The federal Victim Compensation Fund was established by the
federal government to compensate families of victims of the World
Trade Center attack. A major component of the amount of
compensation awarded to a family is the estimated lifetime-earnings
losses of the victim adjusted for taxes, benefits, unemployment risk,
and the victim’s share of consumption. An additional sum is included
in the compensation award for noneconomic losses. In calculating a
victim’s gross earnings losses, the fund assumes annual earnings
increases of 3 percent from a combination of inflation and
productivity growth, an annual increase related to experience (which
rises at a decreasing rate), and a discount factor of 4.8 percent. Using
these parameters, the fund estimates that a forty-year-old victim
earning $127,000 would have lost $2.7 million. The ultimate
compensation award is reduced by the amounts received from other
sources of compensation, such as Social Security death benefits and
life-insurance benefits.
9. Using a different methodology, the Fiscal Policy Institute (2002)
concludes that the attack took a heavy toll on low-wage workers.
10. We used recent Bureau of Labor Statistics and Current Population
Survey data to help identify two-digit industries where the average
wages were toward the top or bottom of all New York City area
industries. Within these groups, we selected three industries that
represented a nontrivial fraction of city employment and displayed
low wage variation across employees. We determined that hotels, food
stores, and general merchandise stores are important low-wage
industries in New York City, and engineering services, brokerage, and
legal services are important high-wage industries. Although eating and
drinking establishments is an important low-wage industry, wages
varied across employees much more than they did in the selected
industries.
11. Asian American Federation of New York (2002).
12. The most recent estimates of total insurance losses—including
property, business interruption, aviation, and medical care—range
from $38 billion to $50 billion associated with the attacks, including
the World Trade Center, the Pentagon in Washington, D.C., and
Pennsylvania, making it the costliest U.S. disaster in the past two
decades. Prior to the attacks, the largest insurance losses (in 2001
dollars) were the $19 billion damage caused by Hurricane Andrew in
1992 and the $14 billion damage caused by the Northridge, California,
earthquake in 1994 (Schaad 2002).
13. Two widely cited reports were produced by the New York City
Partnership and Chamber of Commerce (2001) and the New York
City Office of the Comptroller (2001).
14. About 14 million square feet of space in the World Trade Center
complex—World Trade Center Buildings 1, 2, 4, 5, 6, and 7—was
destroyed. Estimates of the damaged commercial space in the World
Trade Center area range from a low of about 14 million square feet,
largely Class A space, to a high of 21 million square feet, which
includes damaged Class B and C space. Estimates of the repair and
replacement of the damaged commercial space are available for the
Class A space only.
Endnotes (Continued)
FRBNY Economic Policy Review / November 2002 19
15. The estimates presented here are largely based on those reported
by the New York City Partnership and Chamber of Commerce (2001),
the New York City Office of the Comptroller (2001, 2002), and the
Independent Budget Office (2002), updated with information that has
become available since those studies were released.
16. See New York City Independent Budget Office (2002).
17. See New York City Office of the Comptroller (2001).
18. See New York City Office of the Comptroller (2002).
19. Estimates are based on a survey of large tenants (that is, occupying
more than 10,000 square feet). See TenantWise (2002).
20. See New York City Independent Budget Office (2002).
21. The Bureau of Economic Analysis (BEA) of the U.S. Department
of Commerce has estimated the property loss arising from the terrorist
attacks on the World Trade Center and the Pentagon, treating the loss
as a sharp increase in the depreciation of the fixed capital stock owned
by private business and government. The value of the destroyed World
Trade Center complex was based on its depreciated book value as
opposed to replacement cost. The BEA estimates the total value of the
assets destroyed in the attacks on the World Trade Center and the
Pentagon at $15.5 billion. See U.S. Department of Commerce (2001).
22. Reliable welfare data for September, October, and November 2001
are not available.
23. The 1996 welfare reforms gave recipients incentives to move from
the Temporary Assistance to Needy Families program to the Safety
Net Assistance program. Examining the programs individually would
confound the effects induced by these incentives with true changes in
the rolls.
24. However, welfare caseloads may reflect a weakened economy with
up to a two-year lag (Chernick and Reschovsky 2002).
25. These figures are based on data from appraisal firm Miller Samuel
and calculations by the Federal Reserve Bank of New York.
26. These figures are based on data from the New York State
Association of Realtors and the Office of Federal Housing Enterprise
Oversight.
References
20 Measuring the Effects of the September 11 Attack
Asian American Federation of New York. 2002. “Chinatown after
September 11: An Economic Impact Study.” April 4.
Blank, Rebecca M. 2001. “Declining Caseloads/Increased Work: What
Can We Conclude about the Effects of Welfare Reform?” Federal
Reserve Bank of New York Economic Policy Review 7,
no. 2 (September): 25-36.
Centers for Disease Control and Prevention. 2002. “Community Needs
Assessment of Lower Manhattan Residents Following the World
Trade Center Attacks—Manhattan, New York City, 2001.”
Morbidity and Mortality Weekly Report, no. 51 (special
issue). September 11. < />mmwrhtml/mm51SPa4.htm> (November 2002).
Chernick, Howard, and Andrew Reschovsky. 2002. “Welfare Reform
and Recession: Can the States Handle Both?” University of
Wisconsin-Madison Institute for Research on Poverty FOCUS 22,
no. 1: 22-8.
Dorman, Peter. 1996. Markets and Mortality: Economics,
Dangerous Work, and the Value of Human Life.
Cambridge: Cambridge University Press.
Fiscal Policy Institute. 2002. “World Trade Center Job Impacts Take
a Heavy Toll on Low-Wage Workers.” November 5. Available
at <>.
Galea, Sandro, Jennifer Ahern, Heidi Resnick, Dean Kilpatrick, Michael
Bucuvalas, Joel Gold, and David Vlahov. 2002. “Psychological
Sequelae of the September 11 Terrorist Attacks in New York City.”
New England Journal of Medicine 346, no. 13: 982-7.
Mrozek, Janusz, and Laura Taylor. 2002. “What Determines the Value
of Life? A Meta Analysis.” Journal of Policy Analysis and
Management 21, no. 2: 253-70.
New York City Independent Budget Office. 2002. “World Trade Center
Aid: Too Much for Some Needs, Not Enough for Others?”
Newsfax no. 100, May 28.
New York City Office of the Comptroller. 2001. “The Impact of the
September 11 Attack on New York City’s Economy and Revenues.”
October 4.
———. 2002. “One Year Later: The Fiscal Impact of 9/11 on
New York City.” September 4.
New York City Partnership and Chamber of Commerce. 2001.
“Economic Impact Analysis of the September 11th Attack on
New York City.” November.
Orr, James, Robert Rich, and Rae Rosen. 1999. “Two New Indexes Offer
a Broad View of Economic Activity in the New York–New Jersey
Region.” Federal Reserve Bank of New York Current Issues in
Economics and Finance 5, no. 14 (October).
Schaad, Werner. 2002. “Terrorism—Dealing with the New Spectre.”
Swiss Re Focus Report, February.
Siena College. 2002. “Siena Research Institute: Surveys.”
< (September 2002).
TenantWise. 2002. “Special Report: Overview of Current Situation.”
July. Available at < />United Hospital Fund. 2002. “Disaster Relief Medicaid Offers Policy
Lessons for the Future.” Currents: Medicaid Managed Care 6,
no. 4 (spring): 1-3.
U.S. Department of Commerce, Bureau of Economic Analysis. 2001.
“Survey of Current Business.” November.
Vlahov, David, Sandro Galea, Heidi Resnick, Jennifer Ahern, Joseph A.
Boscarino, Michael Bucuvalas, Joel Gold, and Dean Kilpatrick. 2002.
“Increased Use of Cigarettes, Alcohol, and Marijuana among
Manhattan, New York, Residents after the September 11th
Terrorist Attacks.” American Journal of Epidemiology 155,
no. 11 (June): 988-96.
The views expressed are those of the authors and do not necessarily reflect the position of the Federal Reserve Bank of New York
or the Federal Reserve System. The Federal Reserve Bank of New York provides no warranty, express or implied, as to the
accuracy, timeliness, completeness, merchantability, or fitness for any particular purpose of any information contained in
documents produced and provided by the Federal Reserve Bank of New York in any form or manner whatsoever.